Bowling Centers Market Size and Share
Market Overview
| Study Period | 2020 - 2031 |
|---|---|
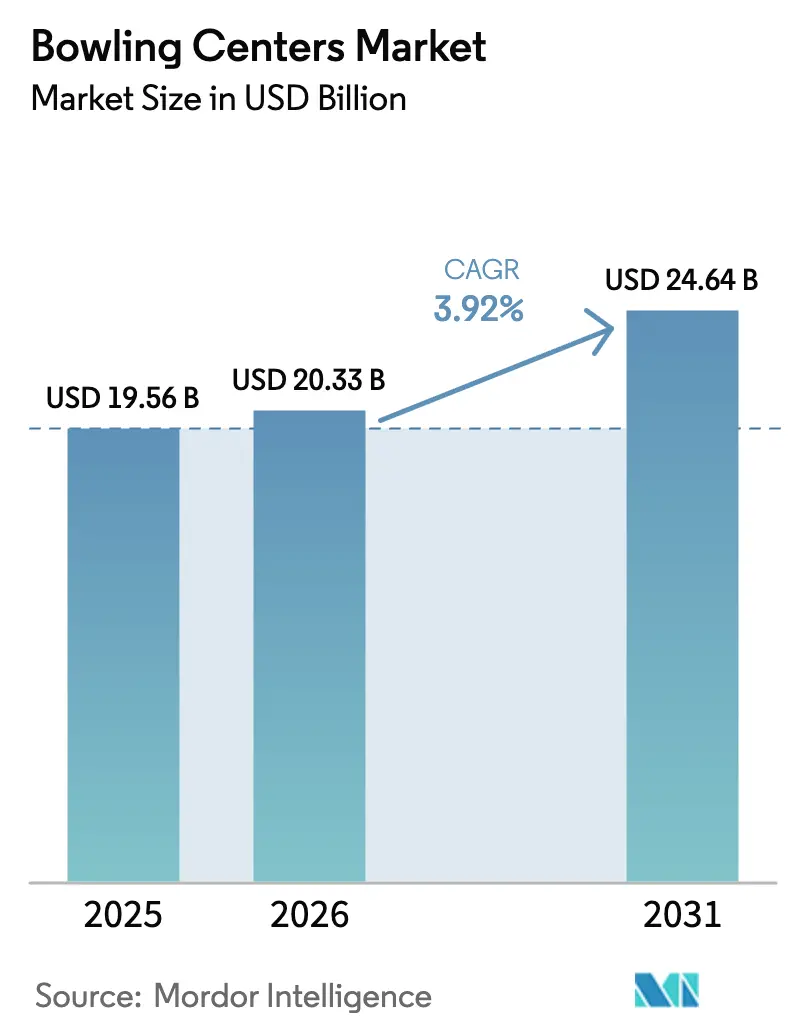
| Market Size (2026) | USD 20.33 Billion |
| Market Size (2031) | USD 24.64 Billion |
| Growth Rate (2026 - 2031) | 3.92% CAGR |
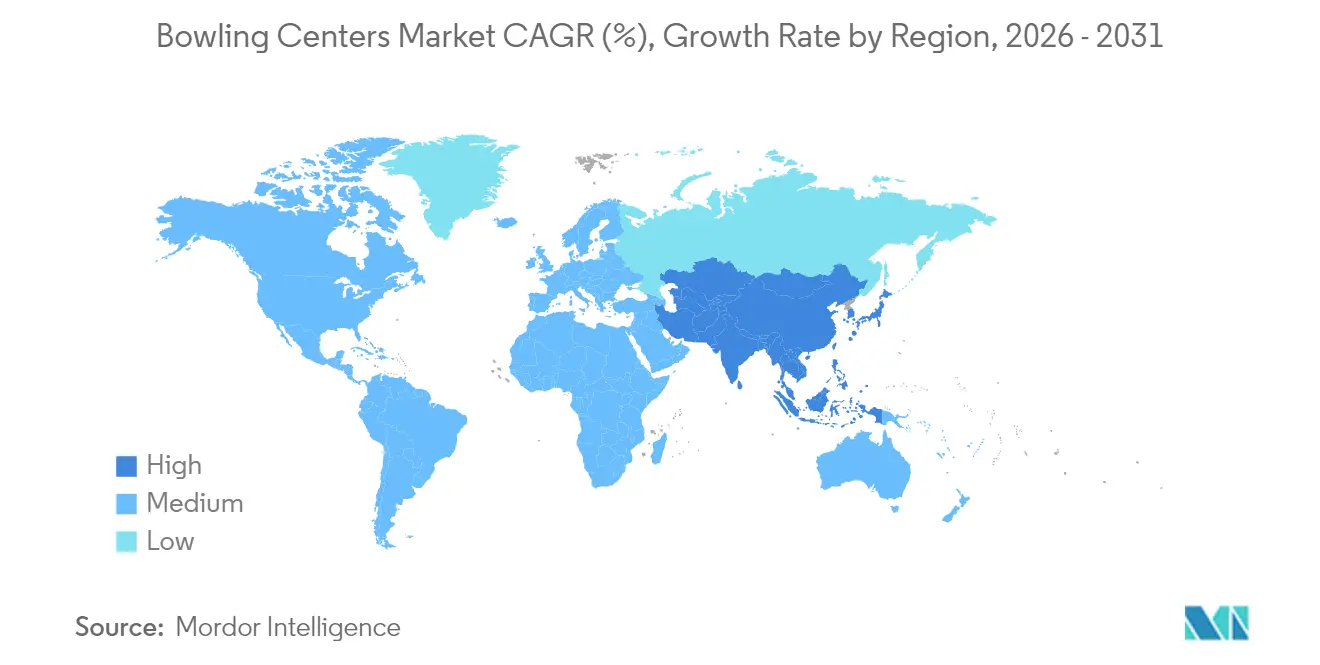
| Fastest Growing Market | Asia |
| Largest Market | North America |
| Market Concentration | Medium |
Major Players *Disclaimer: Major Players sorted in no particular order Image © Mordor Intelligence. Reuse requires attribution under CC BY 4.0. | |
Bowling Centers Market Analysis by Mordor Intelligence
Bowling centers market size in 2026 is estimated at USD 20.33 billion, growing from 2025 value of USD 19.56 billion with 2031 projections showing USD 24.64 billion, growing at 3.92% CAGR over 2026-2031. Rising demand for immersive gameplay, broader food-and-beverage (F&B) programs, and corporate team-building events sustains venue traffic despite mounting real-estate costs. Operators accelerate technology adoption—augmented reality (AR), virtual reality (VR), and SaaS-based lane management—to enhance yield and strengthen loyalty. Multi-format entertainment concepts that combine bowling, arcades, and premium dining expand average spend and draw multi-generational audiences. Consolidation by major chains alongside steady independent investment preserves a fragmented but dynamic competitive field.
Key Report Takeaways
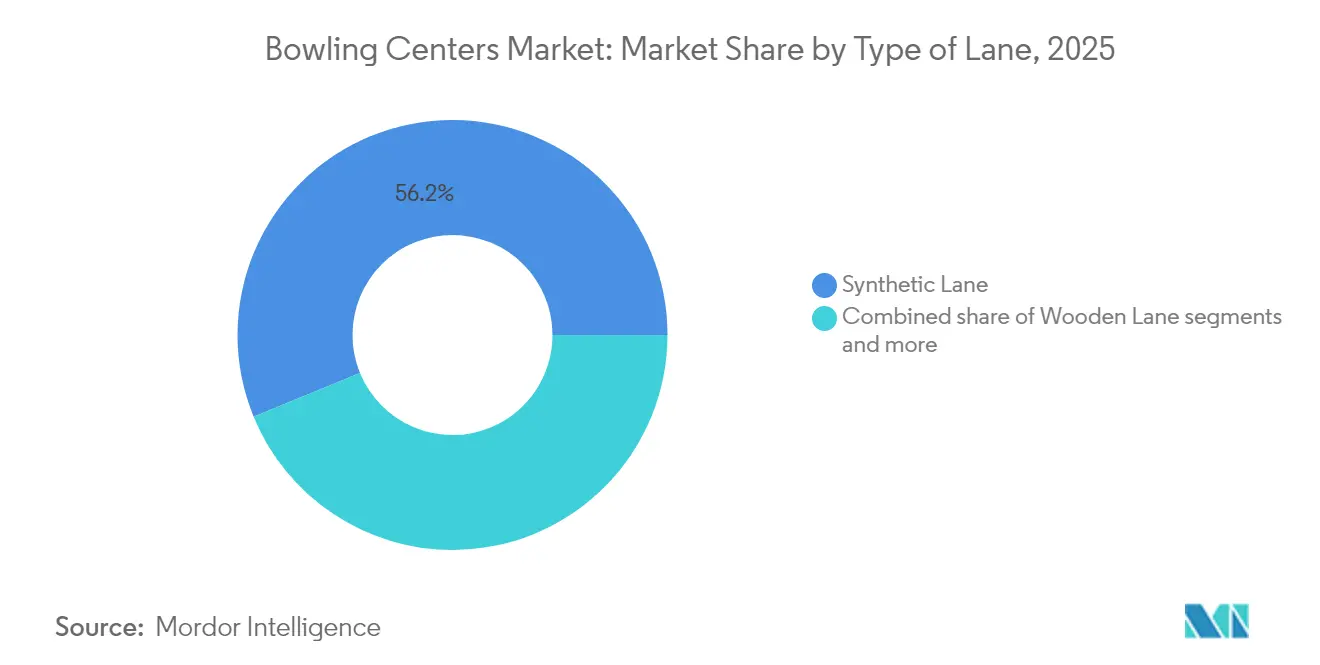
- By type of lane, synthetic surfaces led with 56.20% of the bowling centers market share in 2025, while Guardian lanes are projected to advance at a 9.86% CAGR through 2031.
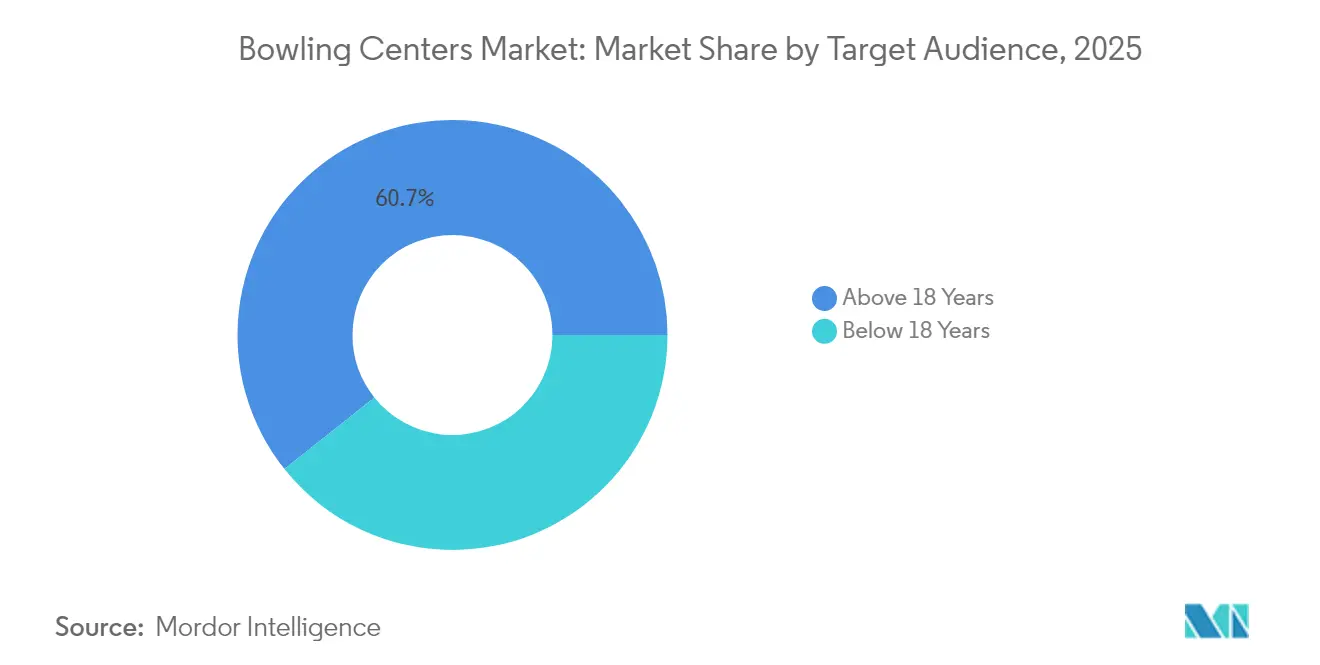
- By target audience, adults above 18 years accounted for 60.72% of the bowling centers market share in 2025; the below-18 segment is set to grow fastest at 7.71% CAGR to 2031.
- By service offering, traditional ten-pin bowling generated 46.85% of the bowling centers market size in 2025, whereas hyper-bowling is forecast to expand at 11.09% CAGR through 2031.
- By geography, North America captured 37.40% of the bowling centers market share in 2025, and Asia-Pacific is expected to post the highest regional CAGR at 9.12% to 2031.
Note: Market size and forecast figures in this report are generated using Mordor Intelligence’s proprietary estimation framework, updated with the latest available data and insights as of 2026.
Global Bowling Centers Market Trends and Insights
Drivers Impact Analysis*
| Driver | (~) % Impact on CAGR Forecast | Geographic Relevance | Impact Timeline |
|---|---|---|---|
| Immersive AR/VR-enhanced lanes | +0.8% | North America & Europe core, expanding to APAC | Medium term (2-4 years) |
| Food-and-beverage revenue diversification | +0.6% | Global, strongest in North America | Short term (≤ 2 years) |
| Rise in corporate team-building events | +0.4% | North America & Europe, emerging in APAC urban centers | Short term (≤ 2 years) |
| Retro bowling nostalgia marketing to Gen-Z | +0.3% | Global, particularly North America & Europe | Medium term (2-4 years) |
| Bowling lounges in mixed-use real estate | +0.5% | Global urban markets, strongest in APAC & North America | Long term (≥ 4 years) |
| Dynamic SaaS-based lane pricing models | +0.2% | North America & Europe early adopters, expanding globally | Medium term (2-4 years) |
| Source: Mordor Intelligence | |||
Immersive AR/VR-enhanced lanes
The integration of augmented and virtual reality is transforming bowling from a traditional sport into an immersive entertainment experience. Systems like QubicaAMF's HyperBowling and Neoverse use projection mapping and interactive features to gamify physical lanes, encouraging longer visits and supporting higher pricing [1]“Entertainment Systems,” QubicaAMF, qubicaamf.com. . Venues such as the Hollywood Bowl are expanding this concept by pairing AR darts with bowling, enhancing the overall entertainment offering. These tech-enabled lanes typically generate 20–30% more revenue per lane compared to standard setups, as guests pay a premium for unique, shareable experiences. The appeal cuts across age groups—gamification attracts younger audiences, while enhanced visuals resonate with older patrons. Although installation costs range from USD 15,000 to USD 25,000 per lane, operators report a return on investment within 18 to 24 months due to increased pricing power and repeat visits.
F&B revenue diversification
The elevation of food-and-beverage (F&B) operations from secondary offerings to core revenue drivers is reshaping the economics of bowling centers. Successful venues now derive 50–60% of total revenue from F&B, up from the historical 30–40%, by introducing full-service dining, craft beverages, and event catering [2]“Corporate Parties,” AMF Bowling, amf.com. . This reflects a broader consumer shift toward integrated entertainment experiences, where venues function more like restaurants that offer bowling, rather than the reverse. Bowlero Corporation exemplifies this model, with enhanced menus, full bars, and private dining areas that boost both visit duration and per-capita spending. Robust F&B offerings also stabilize revenue during off-peak bowling hours by attracting dining-focused customers throughout the day. While these programs can increase EBITDA margins by 25–35%, they require substantial upfront investment in kitchen infrastructure and staff training to deliver the service quality needed for premium pricing.
Corporate team-building demand
Corporate team-building events have become a high-margin revenue source for bowling centers, capitalizing on the sport’s social, inclusive appeal and the growing need to rebuild workplace relationships post-pandemic. The return-to-office trend has driven increased corporate spending on group activities, with bowling venues well-suited due to their group capacity, private event spaces, and in-house catering that simplifies planning. Operators report that corporate events yield 40–60% higher per-person revenue than typical customers, as companies purchase bundled packages covering lanes, food, and extended venue access. These events primarily attract adults—the core demographic of bowling venues—while also introducing new customers who may not otherwise visit recreationally. Venues offering private rooms, AV setups, and flexible menus can charge premium rates, especially during weekdays when standard foot traffic is lower. This segment also adds predictability through advance bookings and recurring clients, allowing for better staffing and operational planning.
Retro bowling nostalgia for Gen-Z
The use of vintage aesthetics and nostalgic branding has proven highly effective in attracting Gen-Z customers, despite their lack of direct connection to bowling’s mid-century origins. This generation values "authentic" and visually engaging environments, making retro-themed venues ideal for social media content and organic promotion. Successful executions go beyond surface-level decor, incorporating vintage scoring systems, classic music, and themed staff uniforms to create fully immersive experiences. The approach is especially popular in urban areas where Gen-Z seeks unique, low-effort social activities as alternatives to conventional nightlife. Retro-themed venues report 15–25% higher Gen-Z traffic, with visitors arriving in larger groups and staying longer to capture and share content. This peer-driven marketing lowers acquisition costs while reigniting interest in bowling among a demographic previously disengaged from the activity.
Restraints Impact Analysis*
| Restraint | (~) % Impact on CAGR Forecast | Geographic Relevance | Impact Timeline |
|---|---|---|---|
| Escalating urban real-estate costs | -0.7% | Global tier-1 cities, most acute in North America & Europe | Short term (≤ 2 years) |
| High maintenance cost of wooden lanes | -0.3% | Global, particularly venues with legacy wooden installations | Medium term (2-4 years) |
| Increasing liability insurance premiums | -0.2% | North America & Europe primarily | Short term (≤ 2 years) |
| Leisure-spend shift to e-sports lounges | -0.4% | Global, strongest impact in APAC & North America urban areas | Medium term (2-4 years) |
| Source: Mordor Intelligence | |||
Escalating urban real-estate costs
Rising commercial real estate costs in tier-1 urban markets pose a major challenge for bowling centers, which require large spaces that are increasingly unaffordable in high-density areas. Standard venues need 15,000–25,000 square feet, making fixed costs unsustainable as urban rents have surged 20–40% since 2020 [3]“Recreation & Hospitality Insurance,” Leavitt Group, leavitt.com.. Operators must choose between lower margins in prime locations or relocating to suburban areas with less foot traffic and customer accessibility. Smaller businesses and new entrants are especially vulnerable, lacking the capital and leverage to secure long-term leases at high rates. In response, some adopt micro-bowling formats or exit the market entirely, while larger chains consolidate their advantage through portfolio-based lease deals and operational scale.
High maintenance cost of wooden lanes
E-sports lounges and gaming cafés are emerging as strong competitors to traditional bowling venues, especially among younger audiences. These digital entertainment formats offer lower costs, shorter time commitments, and skill-based progression that drives repeat visits through competition rather than novelty. With smaller space needs and higher revenue per square foot, they are more economically viable in high-rent urban areas where bowling centers struggle. The 18–34 demographic, crucial for bowling’s future growth, is increasingly drawn to the instant gratification and online community aspects of gaming. Moreover, e-sports venues benefit from network effects that create vibrant, self-sustaining communities—something bowling centers find difficult to replicate without major investments in leagues and prize structures.
*Our forecasts treat driver/restraint impacts as directional, not additive. The impact forecasts reflect baseline growth, mix effects, and variable interactions.
Segment Analysis
By Type of Lane: Synthetic Surfaces Drive Efficiency
Synthetic installations captured a 56.20% share in 2025 as proprietors prioritized durability and uniform ball reaction. Operators emphasize lower lifecycle costs and minimal downtime, freeing capital for guest-facing upgrades. Wooden lanes still appeal to purists but hold only a 35.40% share, primarily in legacy sites. Guardian lanes, a composite innovation, are poised for a 9.86% CAGR as they blend wood-like aesthetics with synthetic resilience. The bowling centers market size for Guardian technology is projected to expand rapidly as refurbishment cycles accelerate. Multipurpose lighting and projection on synthetic decks facilitate AR content, strengthening their business case. . Suppliers bundle financing and maintenance, easing adoption for mid-tier centers. Insurance discounts linked to reduced fire risk compared with timber further tilt economics toward synthetics.


By Target Audience: Adults Anchor Revenue Streams
Adults above 18 years generated 60.72% of 2025 revenue, validating premium F&B and nightlife positioning. Alcohol sales, event bookings, and league memberships underpin higher spend for this cohort. Marketing targets corporate outings and social groups, using loyalty apps to personalize offers. Youth under 18 record the fastest 7.71% CAGR, reflecting family packages and birthday events that cultivate future repeat visitors. The bowling centers' market share for family programming increases as operators integrate arcade redemptions and educational excursions. Flexible venue design segregates adult nightlife areas from kid-friendly zones, preventing brand dilution. Weekday afternoon promotions attract after-school traffic, filling historically idle slots without cannibalizing peak evening demand.
By Service Offering: Experiential Formats Gain Traction
Traditional ten-pin retained a 46.85% share in 2025 due to universal accessibility and established rules. Hyper-bowling, combining physical play with digital targets, will post an 11.09% CAGR as guests seek novel challenges. Competitive league bowling remains vital, sustaining lane utilization on weeknights, though growth is flat. Arcade and family entertainment center (FEC) add-ons reached 41.35% share, lengthening visits and cross-selling food and beverages. The bowling centers market size attributed to combined game-mix venues continues to rise as operators pursue wallet share. Upselling strategies bundle timed play, arcade credits, and dining vouchers to push transaction values. Subscription models granting unlimited weekday access encourage habit formation and steady cash flow.
Geography Analysis
North America accounted for 37.40% of the global bowling entertainment market in 2025, driven by long-established chains and consistently high consumer spending. Many heritage bowling centers are undergoing refurbishments that introduce modern string pinsetters and mobile scoring technology. These upgrades enhance customer experience, encouraging repeat visits and longer dwell times. Premium locations in urban centers continue to attract families, young adults, and corporate groups seeking recreational activities. Overall, the mature North American market demonstrates steady demand and ongoing innovation in both facilities and digital engagement.
Asia-Pacific is forecasted to achieve a 9.12% CAGR through 2031, propelled by urban malls integrating experiential anchors like bowling alleys. Rising disposable incomes and the expansion of the middle-class consumer base support frequent entertainment visits across the region. Investments are concentrated in China, India, and Southeast Asia, where developers view bowling as a strategic driver of family traffic. The growing preference for leisure-oriented malls encourages developers to embed entertainment as a core component of mixed-use complexes. Additionally, localized marketing campaigns and culturally tailored offerings enhance customer engagement and brand loyalty in key cities.
Europe holds a 29.20% share, reflecting premium boutique bowling formats that combine culinary experiences with sporting entertainment. Government programs occasionally provide incentives for urban regeneration, lowering upfront costs for entertainment tenants. Emerging regions such as South America and the Middle East report smaller shares but benefit from tourism and retail-led development initiatives. Local supply chains streamline lane manufacturing and parts distribution, reducing lead times and mitigating import duties. Cross-border franchising agreements enable rapid market entry while ensuring adherence to global brand standards and quality expectations.

Competitive Landscape
The bowling centers market remains highly fragmented, with the top five players collectively accounting for a modest portion of overall market share. This creates ample white-space opportunities for regional operators, technology vendors, and experiential entertainment brands to carve out distinct niches. The fragmented structure is largely due to the localized nature of bowling, the significant capital investment required to build venues, and varying consumer preferences across regions and age groups. Bowlero Corporation leads the market by focusing on acquisitions and operational consistency, while companies like QubicaAMF and Brunswick Bowling Products operate primarily as equipment and technology providers, introducing vertical competition between venue operators and solution vendors. This mix of business models allows both integrated and specialized players to coexist and target different areas of the value chain.
Three main strategic approaches have emerged in the industry: operators scaling through consolidation, tech firms enhancing profitability with integrated systems, and experiential brands delivering premium, themed bowling concepts. Technology suppliers are now competing on full-package solutions—bundling hardware, software, and ongoing services—to boost venue performance and customer engagement. A key example is QubicaAMF’s EDGE String pinspotter, which received Professional Bowlers Association approval for televised events in 2025, underscoring the role of technical innovation in competitive positioning. These advancements not only enhance the player experience but also support greater operational efficiency and profitability for venues. Such differentiation is increasingly critical in a market where standardized formats struggle to meet evolving consumer demands.
Disruptive concepts are also gaining traction, particularly in urban markets where space constraints and rising rents challenge traditional bowling models. Micro-bowling formats allow for space-efficient installations, while subscription-based models are being explored to drive repeat visits and maximize customer lifetime value. In parallel, real estate developers are incorporating bowling into larger mixed-use projects, positioning it as a traffic-driving amenity within retail and entertainment hubs. These emerging formats reflect a broader trend of innovation aimed at increasing accessibility, diversifying revenue streams, and appealing to modern consumers. As competition intensifies, success will hinge on delivering flexible, tech-enabled, and experience-rich bowling environments that go beyond the traditional game.
Bowling Centers Industry Leaders
Bowlero Corporation
QubicaAMF Worldwide
Brunswick Bowling Products
Hollywood Bowl Group
Round One Entertainment
- *Disclaimer: Major Players sorted in no particular order


Recent Industry Developments
- February 2025: Brunswick Bowling updated its OpenLane mobile app with enhanced loyalty points integration, pro metrics analytics, and social sharing capabilities designed to drive customer acquisition and retention while enabling centers to distribute exclusive offers and track performance data across multiple channels.
- January 2025: QubicaAMF served as the presenting sponsor for the IBF World Cup in Hong Kong, China, marking the first time Hong Kong hosted the international tournament and demonstrating the company's commitment to global market expansion and professional bowling development.
- December 2024: QubicaAMF announced its role as presenting sponsor of the 2025 PBA All-Star Weekend, with its EDGE String pinspotter becoming the first string technology approved for televised Professional Bowlers Association competition, validating string pinspotter technology for mainstream professional use.
- December 2024: Bowlero Corporation completed its rebranding to Lucky Strike Entertainment and began trading on NYSE under ticker symbol LUCK, reflecting the company's strategic evolution toward premium entertainment experiences while maintaining its position as the largest global bowling center operator.


Global Bowling Centers Market Report Scope
Bowling is a game where a ball is rolled in a long and narrow lane toward a group of pins with the aim of knocking all the pins down. Bowling centers are centers where these games are played.
The global bowling center market is segmented by type of lane, target audience, and geography. By type of lane, the market is further segmented into wooden lane, synthetic lane, and guardian lane. By target audience, the market is further segmented into above 18 years and below 18 years. By geography, the market is segmented into North America, Asia, Europe, and the Middle East and Africa. The report offers market size and forecasts in value (USD) for all the above segments.
| Wooden Lane |
| Synthetic Lane |
| Guardian Lane |
| Above 18 Years |
| Below 18 Years |
| Traditional Ten-Pin Bowling |
| Competitive League Bowling |
| Hyper-Bowling / Gamified Lanes |
| Arcade & FEC Add-ons |
| Food & Beverage Services |
| North America | United States |
| Canada | |
| Mexico | |
| South America | Brazil |
| Argentina | |
| Peru | |
| Chile | |
| Rest of South America | |
| Europe | United Kingdom |
| Germany | |
| France | |
| Italy | |
| Spain | |
| BENELUX (Belgium, Netherlands, Luxembourg) | |
| NORDICS (Denmark, Finland, Iceland, Norway, Sweden) | |
| Rest of Europe | |
| Asia-Pacific | China |
| Japan | |
| India | |
| Australia | |
| South Korea | |
| South-East Asia (Singapore, Malaysia, Thailand, Indonesia, Vietnam, Philippines) | |
| Rest of Asia-Pacific | |
| Middle East & Africa | United Arab Emirates |
| Saudi Arabia | |
| South Africa | |
| Nigeria | |
| Rest of Middle East & Africa |
| By Type of Lane | Wooden Lane | |
| Synthetic Lane | ||
| Guardian Lane | ||
| By Target Audience | Above 18 Years | |
| Below 18 Years | ||
| By Service Offering | Traditional Ten-Pin Bowling | |
| Competitive League Bowling | ||
| Hyper-Bowling / Gamified Lanes | ||
| Arcade & FEC Add-ons | ||
| Food & Beverage Services | ||
| By Geography | North America | United States |
| Canada | ||
| Mexico | ||
| South America | Brazil | |
| Argentina | ||
| Peru | ||
| Chile | ||
| Rest of South America | ||
| Europe | United Kingdom | |
| Germany | ||
| France | ||
| Italy | ||
| Spain | ||
| BENELUX (Belgium, Netherlands, Luxembourg) | ||
| NORDICS (Denmark, Finland, Iceland, Norway, Sweden) | ||
| Rest of Europe | ||
| Asia-Pacific | China | |
| Japan | ||
| India | ||
| Australia | ||
| South Korea | ||
| South-East Asia (Singapore, Malaysia, Thailand, Indonesia, Vietnam, Philippines) | ||
| Rest of Asia-Pacific | ||
| Middle East & Africa | United Arab Emirates | |
| Saudi Arabia | ||
| South Africa | ||
| Nigeria | ||
| Rest of Middle East & Africa | ||


Key Questions Answered in the Report
How big is the Bowling Centers Market?
The Bowling Centers Market size is expected to reach USD 20.33 billion in 2026 and grow at a CAGR of 3.92% to reach USD 24.64 billion by 2031.
How large is the bowling centers market in 2026?
The bowling centers market size stands at USD 20.33 billion in 2026 and is projected to reach USD 24.64 billion by 2031.
What is the expected growth rate for bowling centers through 2031?
Industry revenue is forecast to rise at a 3.92% CAGR from 2026 to 2031.
Which lane type leads global adoption?
Synthetic surfaces command 56.20% of installations due to lower maintenance and compatibility with immersive technology.
Why is Asia-Pacific considered the fastest-growing region?
Rapid urbanization, mall development, and rising disposable income support a 9.12% CAGR for Asia-Pacific venues.
How are operators boosting profitability beyond lane revenue?
F&B programs, corporate event packages, and dynamic SaaS-based pricing collectively increase average spend and margin.
Page last updated on:


