
E-learning Market Size and Share

E-learning Market Analysis by Mordor Intelligence
The e-learning market size is estimated at USD 275.9 billion in 2026 and is projected to be USD 305.8 billion in 2027, reaching USD 506.6 billion by 2032, growing at a CAGR of 10.62% from 2027 to 2032.
Broader connectivity and workforce skills needs expand demand for digital instruction, while public programs in the Philippines add institutional routes to delivery. Suppliers that combine course content with platform operation and skills assessment sell services that continue beyond the first enrollment, because schools and employers need the learning environment to keep running. Engagement difficulties in virtual classrooms and infrastructure gaps in rural Ugandan schools constrain usable delivery. Providers able to operate learning environments can pursue recurring subscriptions, while connectivity-dependent offerings face a narrower reachable school base.
Key Report Takeaways
- By delivery mode, self-paced learning held a 57.67% e-learning market share in 2026, while instructor-led learning is forecast to grow fastest at a CAGR of 12.5% from 2027 to 2032.
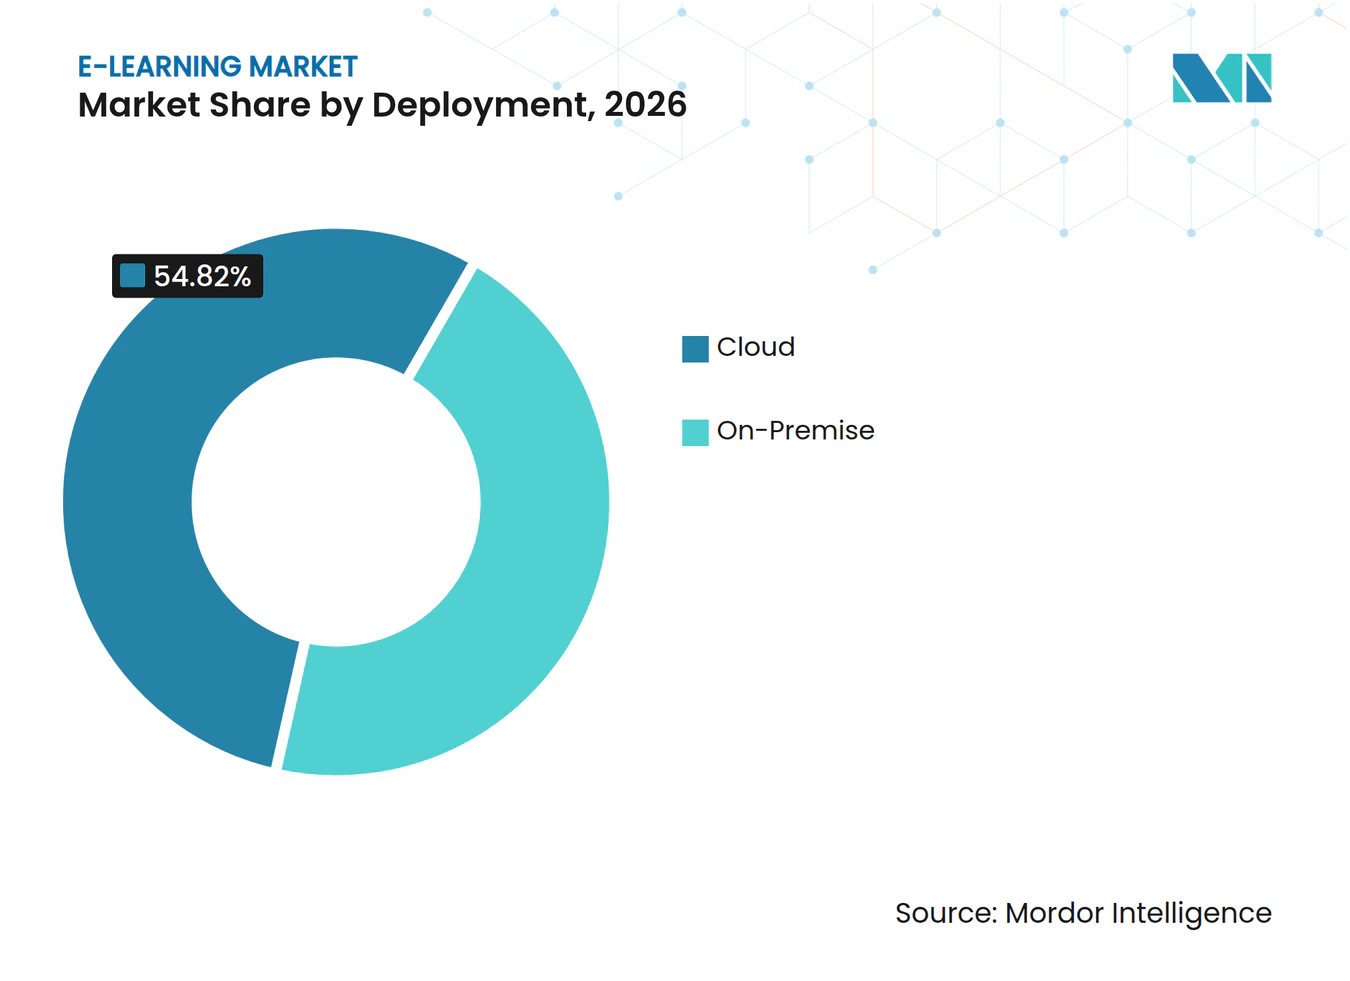
- Deployment was led by cloud with a 54.82% share of the e-learning market size in 2026, and cloud is also forecast to grow fastest at a CAGR of 11.55% from 2027 to 2032.
- Technology demand was led by online e-learning with a 42.86% share in 2026, while mobile e-learning is forecast to grow fastest at a CAGR of 15.45% from 2027 to 2032.
- Among end users, academic buyers accounted for a 45.44% share in 2026, with corporate learning forecast to grow fastest at a CAGR of 10.75% from 2027 to 2032.
- Across geographies, North America led with a 34.41% share in 2026, and Asia-Pacific is forecast to expand fastest at a CAGR of 12.2% from 2027 to 2032.
Note: Market numbers in this report are based on Mordor Intelligence's proprietary estimation framework, which combines nine months of actuals with Q4 projections for base year 2026.
Market Trends and Insights
Drivers Impact Analysis of E-learning Market*
| Driver | (~) % Impact on CAGR Forecast | Geographic Relevance | Impact Timeline |
|---|---|---|---|
| Growing penetration of smartphones & high-speed internet | +3.8% | North America, Europe and Asia-Pacific | Medium term (2-4 years) |
| Corporate up-skilling demand amid digital transformation | +3.4% | North America, Europe and Asia-Pacific | Short term (≤ 2 years) |
| Government initiatives for digital education | +2.8% | Public institutions in the Philippines | Medium term (2-4 years) |
| Cost advantages over classroom training | +2.5% | United States government agencies | Short term (≤ 2 years) |
| Rise of micro-credential partnerships between universities & Big Tech | +1.4% | United States university systems | Medium term (2-4 years) |
| EdTech venture funding shift toward emerging markets | +0.8% | Countries across Africa | Long term (≥ 4 years) |
| Source: Mordor Intelligence | |||
Growing penetration of smartphones & high-speed internet
Connected-device reach expands the potential audience for learning services, while network capability determines which forms of instruction can reach that audience. ITU reported that 5G coverage had expanded to 55% of the world’s population in 2025. GSMA reported 4.8 billion people using mobile internet on their own device by the end of 2025. However, additions slowed to around 160 million people during 2025 from 190 million in 2024. Learning providers must convert connected users into learners to turn this distribution base into demand. Course distribution aimed at existing users can therefore address a much broader population than offers relying solely on first-time mobile-internet users.
Corporate up-skilling demand amid digital transformation
Employers’ skills priorities create an opening for digital-learning suppliers that can serve training needs through organizational accounts. For 2025-2030, 85% of employers surveyed by the World Economic Forum expected to prioritize workforce upskilling in response to macrotrends.[1] Coursera Inc. reported 1,730 paid enterprise customers at December 31, 2025, up 7% year over year. This direct-sales measure combines business, campus, and government accounts, excludes Teams and channel customers, and may count organizational divisions separately. Together, the findings connect an expressed training priority with measured account expansion for an online-learning supplier, creating a basis for organizational demand. An employer account gives suppliers a route to serve workforce learning without acquiring every employee as a separate retail customer.
Government initiatives for digital education
In May 2025, the Philippines’ Agricultural Training Institute awarded Nephila Web Technology Inc. a digital-learning service renewal. The award covered Moodle LMS and mobile-app subscription and hosting for administering e-learning courses under the institute’s e-Extension Program. The institute procured an operating learning environment in which it could administer its own courses. A renewal creates another subscription and hosting purchase around an existing program, making service continuation a source of demand in its own right. Public-sector demand of this kind can sustain service revenue after course creation, favoring suppliers able to maintain the delivery environment.
Cost advantages over classroom training
For agencies buying instruction on a defined system, delivery format can change the quoted charge even when course length is held constant. The USDA National Finance Center’s 2026 schedule priced its 5-day EmpowHR course at USD 1,022.25 for in-person training and USD 641.08 for virtual training. This gives the buyer a direct format decision within a single training requirement, making the delivery choice relevant to the cost of that purchase. Where virtual instruction meets the agency’s needs, the lower scheduled charge can make a paid digital offering easier to select under a fixed training allocation. The advantage is commercially strongest when the supplier can preserve the required instructional scope while offering the lower-priced delivery format.
Restraints Impact Analysis of E-learning Market*
| Restraint | (~) % Impact on CAGR Forecast | Geographic Relevance | Impact Timeline |
|---|---|---|---|
| Low completion rates & learner-engagement challenges | -1.6% | South Wales school network | Short term (≤ 2 years) |
| Digital divide in rural & low-income areas | -1.3% | Rural areas of Uganda | Long term (≥ 4 years) |
| Content-localization barriers for multilingual markets | -0.7% | South African universities | Medium term (2-4 years) |
| Data-privacy regulatory complexity | -0.5% | China and India | Medium term (2-4 years) |
| Source: Mordor Intelligence | |||
Low completion rates & learner-engagement challenges
Remote instruction does not remove the work required to keep learners involved, creating a service burden alongside the delivery platform. In a 2025 survey, 72% of organizations cited learner engagement as their top challenge with virtual instructor-led training. For training suppliers, this makes a connected classroom an incomplete solution when the teaching format fails to sustain participation. Buyers seeking useful instruction must consider the facilitation needed to turn attendance into active learning, complicating a purchase based solely on delivery capacity. That requirement can limit the cost advantage available from moving instruction online if additional teaching effort is needed. The remaining constraint is the expense of supporting engagement within the remote session itself.
Digital divide in rural & low-income areas
School connectivity limits the addressable customer base before the quality of a digital course can influence its adoption. An assessment of 3,276 Ugandan secondary schools between November 2025 and early 2026 found that more than a third had no internet access.[2] Rural schools were more likely than urban schools to lack basic digital-learning infrastructure. For providers serving these schools, an additional course license cannot resolve the underlying inability to deliver connected instruction. The commercial constraint therefore concerns deployment readiness as well as the affordability of the learning service itself. Schools lacking that foundation require infrastructure spending before connected course subscriptions can become a practical recurring purchase.
*Our forecasts treat driver/restraint impacts as directional, not additive. The impact forecasts reflect baseline growth, mix effects, and variable interactions.
E-learning Market Segment Analysis
By Delivery Mode:
Flexible Access and Guided InstructionSelf-paced accounted for a 57.67% share of the e-learning market size in 2026. Pearson’s 2025 presentation reported about 500,000 paid subscribers for its Mondly online English language learning tools. Mondly’s business solutions include at least 130 hours of self-paced learning. Learner-controlled pacing separates access to instruction from the scheduling of a shared teaching session, allowing purchasers to progress through material at different times. Flexible timing widens the circumstances in which a subscription is usable, so this library can serve learners who cannot attend scheduled sessions.
Instructor-led is the fastest-growing segment in the e-learning market, with a forecast CAGR of 12.5% from 2027 to 2032. A 2026 Class and Training magazine report found that 98% of 545 surveyed organizations used virtual instructor-led training, with 40% relying on it for at least half their training programs. This usage connects the format to organizational program delivery, giving guided virtual instruction an established place within the surveyed buyers’ training activities. For suppliers, the commercial task is to provide teaching capacity suited to live programs and the cohorts using them. With adoption already widespread in this sample, suppliers can target a larger role within existing training programs through services that accommodate additional guided instruction.




By Deployment:
Hosted Access and Institutional MigrationCloud was the largest and fastest-growing segment in the e-learning market, with a 54.82% share in 2026 and a forecast CAGR of 11.55% from 2027 to 2032. Shanghai Able Digital’s Cloud LMS had 676 subscribing customers in China in 2025. Cloud deployment combines access to learning-management software with the supplier’s responsibility for operating the hosted system throughout each customer’s subscription. Across a base of 676 subscribers, that service relationship gives the provider an opportunity to earn from continuing platform access as well as winning new customers.
On-premise deployments also create migration work when institutions change how they operate their learning environment. On-premise infrastructure at the University of Portsmouth hosted more than 3,000 Moodle modules and courses before the university migrated them, with associated files, activities, and enrollments, to cloud in summer 2025. Cloud Moodle began operating in August 2025 after that move from on-premise hosting. For university buyers, a change in hosting therefore involves moving the course environment and its associated records, making the transition broader than the selection of a new access arrangement. Completing the move before the new academic year made migration timing part of instructional continuity even though the university kept Moodle.

By Technology:
Course Activity and Mobile ParticipationOnline e-learning represented a 42.86% e-learning market share in 2026. Coursera learners logged approximately 54.4 million course enrollments in 2025, 10% more than in 2024. Coursera’s global online platform connects learners, content creators, organizations, and institutions. As the intermediary between instruction providers and several buyer groups, Coursera ties the growth of online course activity to a single distribution channel.
Mobile e-learning is the fastest-growing segment in the e-learning market, with a forecast CAGR of 15.45% from 2027 to 2032. Duolingo reported more than 50 million daily active users on its flagship mobile learning app in 2025. Duolingo also reported more than USD 1 billion in company-wide total bookings for 2025. Duolingo’s total bookings measure includes subscription purchases, advertising-network income, Duolingo English Test purchases, and in-app virtual goods. Subscriptions are therefore one paid route among several in a mobile learning business, so growth depends on converting daily users into paying ones as well as adding them.
By End-User:
Academic Scale and Workforce SubscriptionsAcademic was the largest segment in the e-learning industry, with a 45.44% share in 2026. SARA-participating U.S. institutions self-reported 4,657,856 students enrolled exclusively in distance-education courses in fall 2025, up 4.9% from fall 2024. The increase means these institutions had more exclusively remote students to serve, expanding the delivery workload for platforms and course services. Because fall-term reporting captures less than half of annual exclusively distance-education enrollment at most participating institutions, those academic buyers serve a larger student base across the year.
Corporate is the fastest-growing segment in the e-learning industry, with a forecast CAGR of 10.75% from 2027 to 2032. Before its May 2026 acquisition by Coursera, Udemy reported Q1 2026 Enterprise revenue of USD 132.9 million, up 4% year over year. Larger new-customer deals lifted Udemy Business subscriptions, but lower net retention partly offset growth and churn outpaced expansion. InterDigital deployed LinkedIn Learning company-wide for all employees in 2025, with curated content planned at corporate and department levels. Employer-wide deployment creates a route to scale learning within an account, while larger new-customer deals offer suppliers a growth channel despite retention pressure.
Geography Analysis
North America E-learning Market
North America represented 34.41% of the e-learning market size in 2026. In 2024-25, 6,206,019 undergraduates at U.S. Title IV institutions were enrolled exclusively in distance-education courses, measured as 12-month unduplicated headcount. Public institutions accounted for 4,311,654 of those undergraduates, and total graduate enrollment exclusively in distance-education courses across U.S. Title IV institutions was 1,829,746. The public-campus concentration identifies where suppliers can reach much of this U.S. undergraduate learning population, making public institutions a central academic channel for online course delivery within North America.
Asia-Pacific E-learning Market
Asia-Pacific is forecast to grow at a CAGR of 12.2% from 2027 to 2032. Coursera reported regional revenue of USD 108.9 million in 2025, up from USD 89.7 million in 2024, allocated by customer billing address. In May 2026, Philippine Normal University signed a one-year OpenLearning LMS agreement for 5,000 students through reseller CE-Logic Inc., specifying a June 1, 2026 start. The one-year, 5,000-student term was in line with Philippine procurement rules limiting the duration and value of public-institution contracts, with expansion to all 12,000 university students an opportunity under a longer-term arrangement. Institutional procurement therefore stages how quickly this LMS rollout can widen, making growth through larger university contracts contingent on subsequent agreements.
Europe combines established online participation with varied delivery settings, with 34.8% of EU internet users reporting online courses or learning-material use for the first quarter of 2025. In South America, 449 students graduated in 2025 from Argentina’s rural digital-platform school model across 6 provinces, with urban teachers and local tutors supporting instruction. Within the Middle East and Africa, the Democratic Republic of the Congo’s education minister described locally hosted tablet content for students without internet at a March 2025 UNESCO webinar. The latter examples make local teaching support and offline content delivery distinct ways to extend digital instruction into underserved classrooms. A platform-only supplier would need local teaching partners or an offline delivery option to address the rural and disconnected classrooms in these examples.

Regulatory Framework and Outlook
The comparison assesses selected jurisdictions from the perspective of suppliers serving institutional digital-learning buyers. Entry conditions differ between approval to deliver recognized programs, handling student information, and using AI for educational decisions. In the United States, FERPA’s school-official exception requires a function otherwise performed by school staff, school control, use consistent with the school’s rights notice, and no unauthorized data use or redisclosure. A supplier’s service function and the school’s control over its data therefore help determine whether the exception is available.
Regulatory Table of E-learning Market
| Decision factor | United States | Brazil | Germany | India | Saudi Arabia |
|---|---|---|---|---|---|
| Primary authority | Department of Education’s Student Privacy Policy Office; Federal Trade Commission | Agência Nacional de Proteção de Dados (ANPD) | Bundesnetzagentur within assigned education-AI surveillance areas | University Grants Commission and its Distance Education Bureau | National eLearning Center (NeLC) |
| Key instruments or direction | FERPA school-official exception; amended COPPA Rule for covered child-data services | Digital Child and Adolescent Statute; age-assurance guidance work | AI Act requirements for specified educational assessment functions from December 2, 2027 | Online and open-distance recognition requirements; covered allied-health program restrictions | eLearning Regulation licensing and FutureX integration requirements |
| Commercial effect | School-controlled education-record processing; covered operators must meet child-data duties | Child-directed or likely child-accessed services face protection and age-assurance duties | Covered learning-outcome and education-level assessment AI requires compliance preparation | Institutional recognition governs eligible programs; covered allied-health programs, including psychology specializations, barred from online and open-distance delivery from August 2026 | Local and international providers need required licenses and technical integration |
| Current policy attractiveness | Medium | Medium | Medium | Medium | Low |
| Future direction of policy attractiveness | No change | Hardening | Hardening | No change | No change |
| Source: Mordor Intelligence | |||||
The United States offers conditional school-service access after COPPA’s general April 22, 2026 compliance deadline, while India’s medium, stable assessment reflects continuing recognition conditions and its covered allied-health restriction effective August 2026. Brazil’s medium rating and hardening outlook reflect child-protection duties effective since March 2026 and age-assurance guidance listed as ongoing in ANPD’s October 2026 agenda. Germany’s medium rating and hardening outlook reflect the EU AI Act’s December 2, 2027 requirements for specified educational AI and Bundesnetzagentur’s assigned supervision. Saudi Arabia’s low rating reflects licensing and FutureX integration duties, and its stable outlook rests on NeLC’s March 2026 announcement that private training providers would obtain program licenses directly from the Technical and Vocational Training Corporation (TVTC) from May 2026 after FutureX integration, a planned licensing-channel change retaining both requirements.
Value Chain Stages
The value chain compares content authoring, platform distribution, and the operation of institutional learning services. Google and IBM are among the employer brands authoring many of Coursera’s Professional Certificates. Coursera pays creator fees for Enterprise offerings and a significant portion of Consumer offerings. This separates compensation for producing instruction from the charges earned by making content accessible and maintaining the learning environment.
Value Chain Analysis Table of E-learning Market
| Primary activity | Key participants | Value capture | Bottleneck | Resilience response |
|---|---|---|---|---|
| Content authoring | Industry certificate authors such as Google and IBM | Creator fees under applicable Enterprise and Consumer agreements | Keeping instruction relevant and engaging | Revise lessons using learner-engagement feedback |
| Content aggregation and distribution | Learning-platform distributors such as Coursera Inc. and edX | Coursera course-access charges and subscriptions | Sustaining useful activity across a broad catalog | Curate pathways around specific learning objectives |
| Institutional delivery and support | LMS operators such as D2L (Brightspace) | Access subscriptions, added support, excess usage, and professional-services fees | Coordinating implementation and integration with institutional operations | Phase configuration, integration, and user onboarding |
| Source: Mordor Intelligence | ||||
Starting in 2025, Coursera based creator revenue-share allocation on learner engagement rather than enrollment rates. Within those arrangements, maintaining useful instruction consequently becomes part of the creator’s earnings incentive. For its fiscal year ended January 31, 2026, D2L reported mostly customer contracts lasting 3 to 5 years, with subscription revenue generally recognized over the contract term. Together, these models tie creator earnings to continued learner engagement and institutional subscription revenue to multi-year service relationships.
Competitive Landscape
Market Concentration

Competition brings broad course distributors and enterprise skills platforms together, leaving several distinct supplier models serving institutional and individual learning needs. Coursera Inc. reported USD 757.5 million in 2025 revenue, up 9% year over year.[3] Coursera completed its combination with Udemy Inc. on May 11, 2026, with Udemy continuing as its wholly owned subsidiary. LinkedIn Learning supplies workplace learning, edX (2U, LLC) distributes partner courses, and Skillsoft provides enterprise skills-management capabilities. The combination concentrates ownership of 2 established platforms while leaving other providers with distinct routes to workplace and institutional buyers through their content and delivery capabilities.
Company strategies differ in whether they organize learning around a broader skills-management service or expand access to specialized third-party instruction. During the fiscal year ended January 31, 2026, Skillsoft shifted toward a platform combining curated content, content creation, skills benchmarking, AI-assisted learning, and role-based development. In September 2026, 2U expanded its Google Cloud partnership with 12 additional AI and cloud courses available through edX to individual and enterprise learners. Skillsoft’s shift gives enterprise buyers one platform for several stages of skills development, while the Google Cloud courses give edX learners and enterprise customers direct access to Google Cloud’s official training.
Coursera’s planned enterprise skills platform puts AI-enabled development alongside Skillsoft’s skills-management offering in competition beyond course distribution. Coursera previewed Project Helix, a code-named AI-native skills platform for organizations, at its September 2026 FWD event and said broad enterprise availability is expected in the first half of 2027. Skillsoft’s June 27, 2025 accessibility report assessed English-language and certain localized Percipio Compliance courses accessed through Percipio Learning Platform, Content Integration, or Compliance 1.0 and played in Compliance Player RIA 4.1. Its WCAG 2.2 Level A and AA ratings included both support and partial support, identifying accessibility limitations within that course experience. Buyers can therefore assess those course limitations criterion by criterion, while a broader enterprise rollout of Project Helix depends on its expected first-half 2027 availability.
E-learning Industry Leaders
-
Coursera Inc.
-
Udemy Inc.
-
LinkedIn Learning
-
edX (2U, LLC)
-
Skillsoft
- *Disclaimer: Major Players sorted in no particular order
E-learning Market Companies Covered in this Report
- Coursera Inc.
- Udemy Inc.
- LinkedIn Learning
- edX (2U, LLC)
- Skillsoft
- Pluralsight
- Blackboard Inc.
- Instructure (Canvas)
- Cornerstone OnDemand
- Moodle
- Docebo S.p.A.
- Pearson plc
- Litmos
- G-Cube
- Chegg Inc.
- Udacity
- D2L Corp. (Brightspace)
- Google LLC (Classroom)
- Aptara
- FutureLearn Ltd.
Key Opportunities for Market Participants
The opportunities compare sponsored learning access with the different instructional needs of introductory and intensive training cohorts. On October 14, 2026, MyDIGITAL Corporation said Malaysia’s first 25,000 Coursera Global Learning Pass licenses were fully subscribed, with applicants entering a priority waiting list for Cohort Two. In August 2026, India’s National Skill Development Corporation (NSDC) and Cultus Education announced nationwide online Amazon Web Services (AWS) cloud and AI training targeting 150,000 foundational learners and 10,000 intensive trainees. The intensive pathway is for participants demonstrating readiness, while Malaysia’s next license batch depends on additional availability.
Market Opportunities Table of E-learning Market
| Opportunity | Why now | Buyer / lead segment | Recommended play | Main barrier | Likely beneficiaries |
|---|---|---|---|---|---|
| Activate additional sponsored course access | Priority waiting list for Malaysia’s second cohort | Malaysian applicants and public program administrators | Prepare cohort onboarding around confirmed license releases | Additional licenses must become available | Coursera Inc., the course-license supplier |
| Deliver foundational cloud literacy at scale | Nationwide online foundation intake announced in India | Indian youth, prioritizing underserved communities | Sequence introductory modules with guided progression | Sustaining learning across a large introductory cohort | Cultus as delivery partner and AWS as content provider |
| Build a supported pathway into intensive cloud and AI training | Readiness-qualified intensive pathway within India’s initiative | Indian youth ready for intensive training | Combine practical exercises with learning support | Delivering sufficient practice to develop job-ready skills | Cultus and AWS within their delivery and content roles |
| Source: Mordor Intelligence | |||||
The central opening is to match sponsored access with the level of instruction a learner can use. Waiting-list conversion depends on released capacity, while progression into intensive training requires preparation for deeper technical work. Providers can capture that distinction through cohort services and structured learning pathways that complement the licensed course content.
Recent Industry Developments in E-learning Market
- Sep 2026: 2U expanded its Google Cloud partnership with 12 additional AI and cloud courses on edX, available to individual learners and enterprise customers.
- Sep 2026: Coursera Inc. previewed Project Helix, a code-named AI-native skills platform for organizations, at its FWD event and said broad enterprise availability is expected in the first half of 2027.
- May 2026: Coursera Inc. completed its combination with Udemy Inc., which continued as Coursera’s wholly owned subsidiary.
E-learning Market Report Scope and Research Methodology
Market Definition and Coverage
The global e-learning market measures annual end-user spending on paid digital learning services and content licenses delivered in self-directed or instructor-facilitated formats through hosted or locally deployed digital platforms. It serves academic, corporate and government learning needs globally.
Scope exclusions: Hardware devices, stand-alone conferencing tools and informal open-video tutorials are excluded.
Segments Covered in This Report
- By Delivery Mode
- Self-Paced
- Instructor-Led
- By Deployment
- Cloud
- On-Premise
- By Technology
- Online e-learning
- Learning Management System (LMS)
- Mobile e-learning
- Rapid e-learning
- Virtual Classroom
- By End-User
- Academic
- Corporate
- Government & Public Sector
- By Geography
- North America
- United States
- Canada
- Mexico
- South America
- Brazil
- Peru
- Chile
- Argentina
- Rest of South America
- Europe
- United Kingdom
- Germany
- France
- Spain
- Italy
- BENELUX (Belgium, Netherlands, Luxembourg)
- NORDICS (Denmark, Finland, Iceland, Norway, Sweden)
- Rest of Europe
- Asia-Pacific
- India
- China
- Japan
- Australia
- South Korea
- South East Asia (Singapore, Malaysia, Thailand, Indonesia, Vietnam, Philippines)
- Rest of Asia-Pacific
- Middle East & Africa
- United Arab Emirates
- Saudi Arabia
- South Africa
- Nigeria
- Rest of Middle East & Africa
- North America
Data Sources, Market Sizing, and Validation
Desk Research
Public sources such as the International Telecommunication Union's connectivity indicators, the World Economic Forum's employer strategy findings, Eurostat's online learning participation data, and UNESCO's education and digital access measures provide market context, including the reach of connected learners, employer training priorities, and participation in online learning. These sources help assess demand conditions and compare regional adoption signals with reported spending and platform activity.
Company filings, annual reports, investor materials, procurement notices, and reputable press can clarify supplier revenue, paid subscriptions, institutional purchases, and changes in delivery models. These named sources are illustrative and not exhaustive, and further sources inform collection, validation and clarification.
Primary Interviews and Surveys
Interviews and structured questionnaires with academic buyers, corporate learning leaders, government program owners, platform providers, and content suppliers can test secondary evidence on paid access, purchasing channels, delivery formats, and renewal behavior. Responses can clarify missing price or adoption inputs and explain conflicting signals, while analysts compare respondent accounts with public filings, procurement records, and market indicators before using them in the estimate.
Distribution of primary research fieldwork respondents
| Company type | Respondent position | Region |
|---|---|---|
| Top tier: 31% | CXOs: 20% | APAC: 38% |
| Mid tier: 44% | Functional/Unit leaders: 35% | EMEA: 32% |
| Smaller Players: 25% | Managers: 45% | Americas: 30% |
Market-Sizing & Forecasting
The model estimates annual global end-user spending in USD through a top-down demand model, using connectivity and internet access, employer upskilling priorities, participation in online courses, academic and government digital learning activity, and supplier revenue disclosures as indicators of paid learning demand. Scenario analysis carries these indicators through the forecast period, with assumptions varied where adoption, budgets, or purchasing conditions move differently by region. Segment shares are derived from reported revenue and purchase evidence for self-paced and instructor-led delivery, cloud and on-premise deployment, the listed technologies, academic, corporate and government buyers, and the covered geographies. Each split is checked against its segment total. Selective bottom-up checks compare sampled paid license or course prices with plausible subscriber, learner, or institutional purchase volumes and supplier roll-ups, then reconcile those checks to the global spending estimate. Where price or volume detail is missing, analysts use adjacent public adoption and spending indicators, document the assumption, and test its effect in scenarios. Experts can review variable-level assumptions and forecast direction without substituting unverified opinion for observed evidence.
Data Validation & Update Cycle
Analysts triangulate supplier revenue, buyer spending signals, public adoption data, procurement evidence, and respondent explanations, then check totals and segment shares for unexplained changes or inconsistencies. They trace anomalies to source definitions, timing, currency, or coverage, revise or qualify the affected input, and obtain clarification from a source or respondent when a material conflict remains. A second analyst reviews source traceability, calculations, and the narrative before sign-off. Estimates are refreshed annually, revisited between cycles after material market events, and checked again in a fresh pre-delivery review.
Mordor Intelligence's Global Elearning Market Size Versus Other Published Estimates
Published estimates can differ in the transactions and products they count and the inputs used to model demand. The global e-learning market measures annual end-user spending on paid digital learning services and content licenses delivered in self-directed or instructor-facilitated formats through hosted or locally deployed digital platforms.
Key Gap Drivers include the study's defined coverage and market-specific modeling choices. The model estimates annual global end-user spending in USD through a top-down demand model, using connectivity and internet access, employer upskilling priorities, participation in online courses, academic and government digital learning activity, and supplier revenue disclosures as indicators of paid learning demand.
Benchmark comparison
| Source | Market Size | Gaps in Research Methodology |
|---|---|---|
| Mordor Intelligence | USD 305.8 B (2027) | |
| Global Market Research Firm A | USD 273.8 B (2026) | At its 2026 base, this estimate is 10.5% below this report's 2027 value of USD 305.8 B, 1 year later. The estimate predates the report's measurement point and reflects an earlier phase of market expansion. |
| Global Market Research Firm B | USD 352.59 B (2025) | At its 2025 base, this estimate is 15.3% above this report's 2027 value of USD 305.8 B, 2 years later. Its market definition includes interactive learning hardware and related goods alongside learning services. |
Mordor Intelligence's analysts triangulate supplier revenue, buyer spending signals, public adoption data, procurement evidence, and respondent explanations, then check totals and segment shares for unexplained changes or inconsistencies.
Key Questions Answered in the Report
What is the E-learning market size and growth outlook?
The size is projected at USD 305.8 billion in 2027, reaching USD 506.6 billion by 2032, with a CAGR of 10.62% from 2027 to 2032.
What supports demand for paid digital learning services?
Connectivity, workforce upskilling, public programs, and delivery economics support demand. ITU reported that 5G coverage reached 55% of the world’s population in 2025.
Which learning delivery format leads spending?
Self-paced learning held a 57.67% share in 2026. Instructor-led learning is forecast to grow fastest at a CAGR of 12.5% from 2027 to 2032.
Which companies compete in paid online learning?
Coursera Inc., LinkedIn Learning, edX (2U, LLC), and Skillsoft are major providers. Udemy became Coursera’s wholly owned subsidiary in May 2026.
What challenge can limit adoption of virtual training?
A 2025 survey found that 72% of organizations cited learner engagement as their top virtual instructor-led training challenge, highlighting the importance of effective facilitation.
Which region leads e-learning spending, and where is growth fastest?
North America held a 34.41% share in 2026, while Asia-Pacific is forecast to grow fastest at a CAGR of 12.2% from 2027 to 2032.