ATP Assays Market Size and Share
Market Overview
| Study Period | 2019 - 2030 |
|---|---|
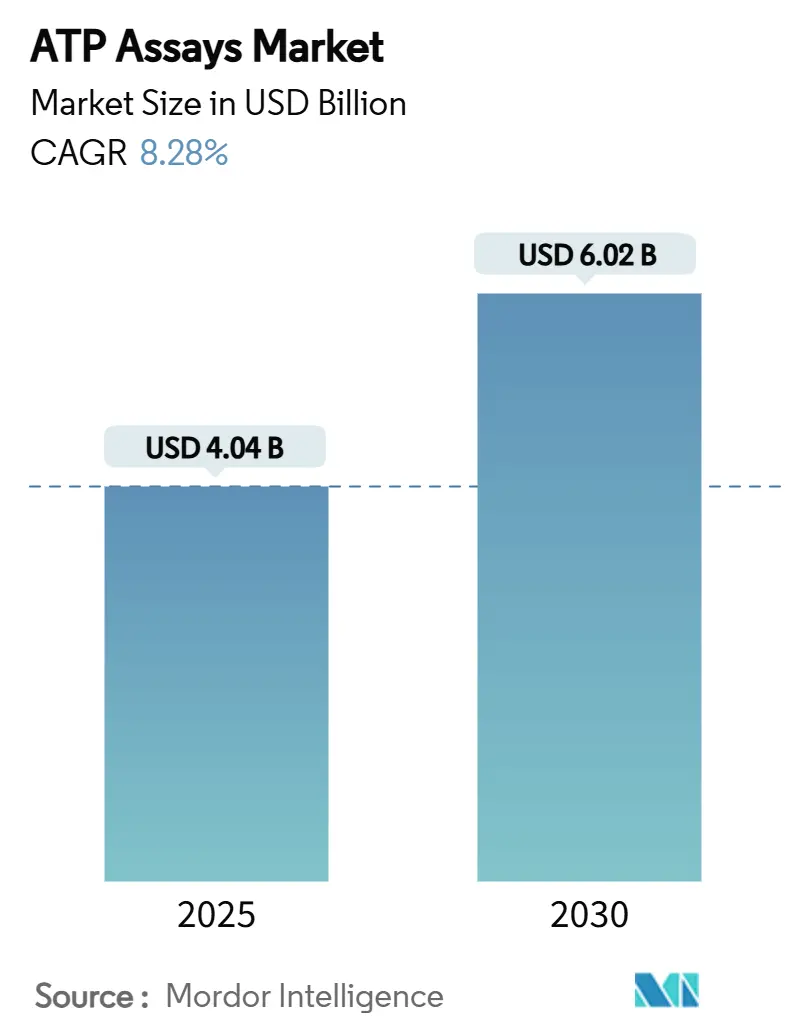
| Market Size (2025) | USD 4.04 Billion |
| Market Size (2030) | USD 6.02 Billion |
| Growth Rate (2025 - 2030) | 8.28% CAGR |
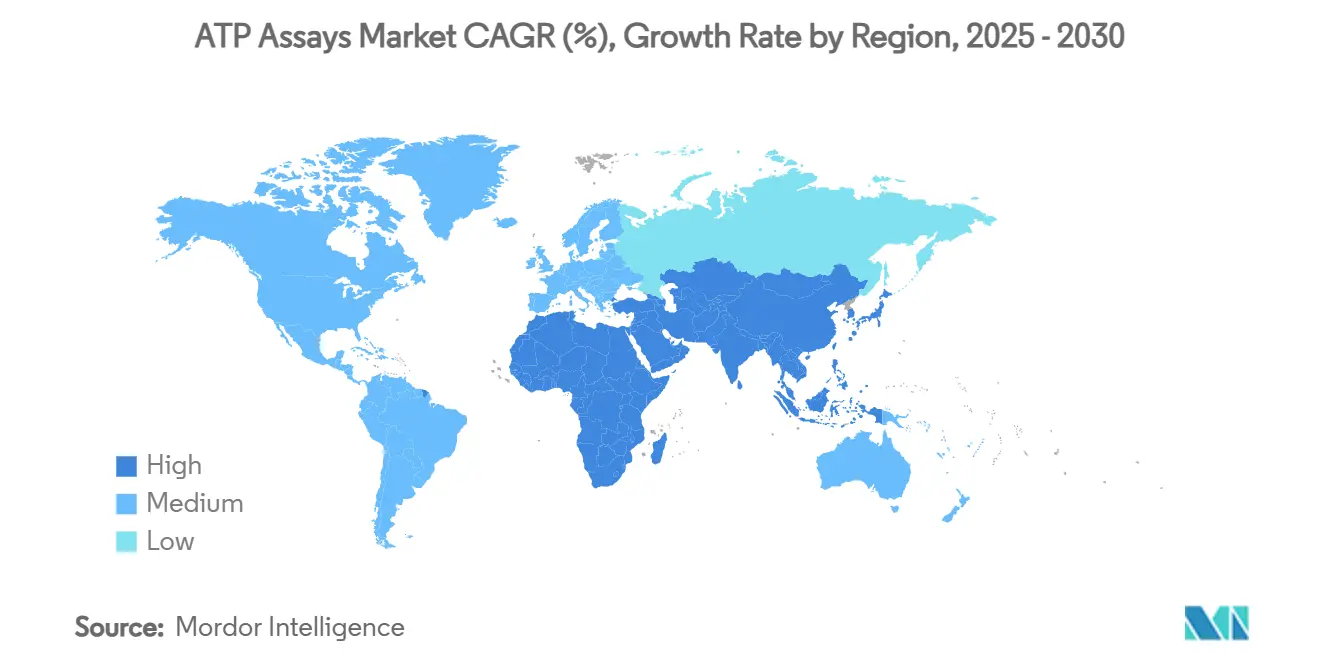
| Fastest Growing Market | Asia Pacific |
| Largest Market | North America |
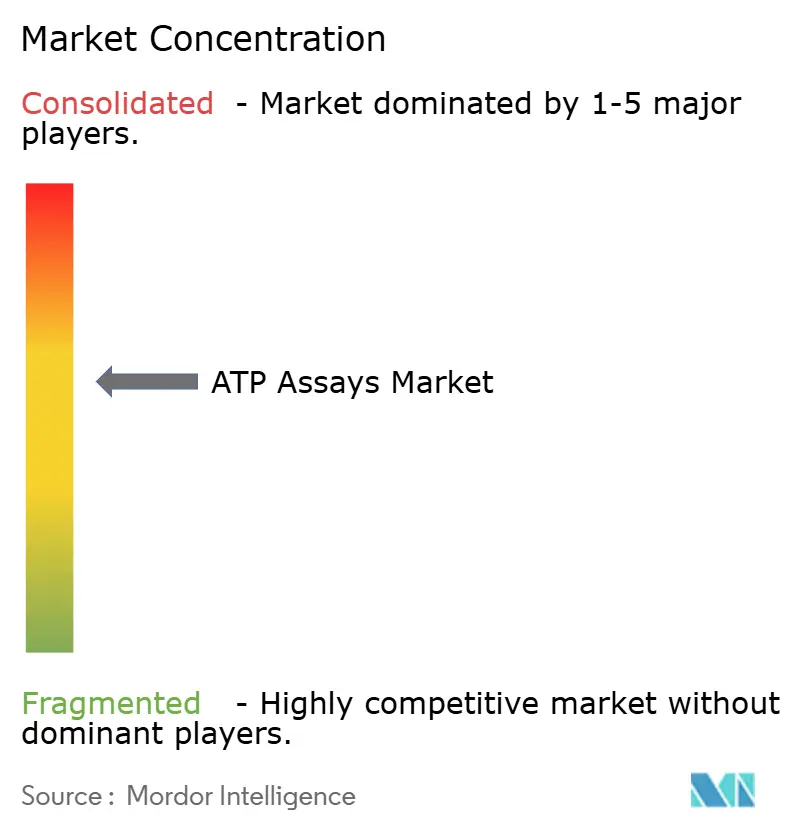
| Market Concentration | Medium |
Major Players *Disclaimer: Major Players sorted in no particular order Image © Mordor Intelligence. Reuse requires attribution under CC BY 4.0. | |
ATP Assays Market Analysis by Mordor Intelligence
The ATP assays market size reached USD 4.04 billion in 2025 and is expected to attain USD 6.02 billion by 2030, advancing at an 8.28% CAGR. Demand expands as adenosine-triphosphate tests become indispensable for high-throughput drug screening, rapid contamination checks, and point-of-care clinical diagnostics. Pharmaceutical and biotechnology companies integrate luminometry into automated discovery platforms, while hospitals deploy handheld meters to verify instrument reprocessing, cutting infection-control turnaround times to minutes. Instrument makers continue to improve photon-detection efficiency, and reagent suppliers launch room-temperature-stable kits that simplify workflows. North America leads revenue because of robust life-science funding and strict quality regulations, but Asia-Pacific delivers the sharpest growth as governments scale biomanufacturing capacity and healthcare infrastructure.
Key Report Takeaways
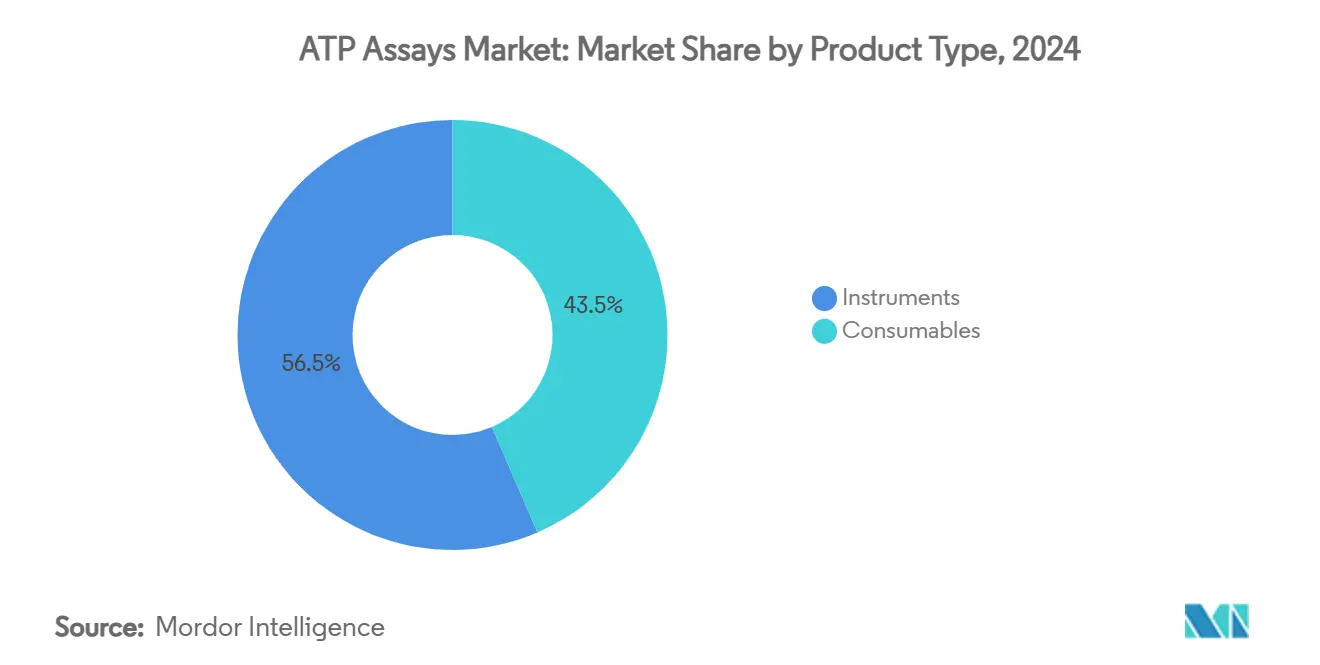
- By product type, instruments held 56.5% of the ATP assays market share in 2024; consumables are forecast to expand at a 12.3% CAGR through 2030.
- By technique, luciferase-based bioluminescence captured 78.4% of the ATP assays market share in 2024; fluorometric methods are projected to grow at an 11.8% CAGR to 2030.
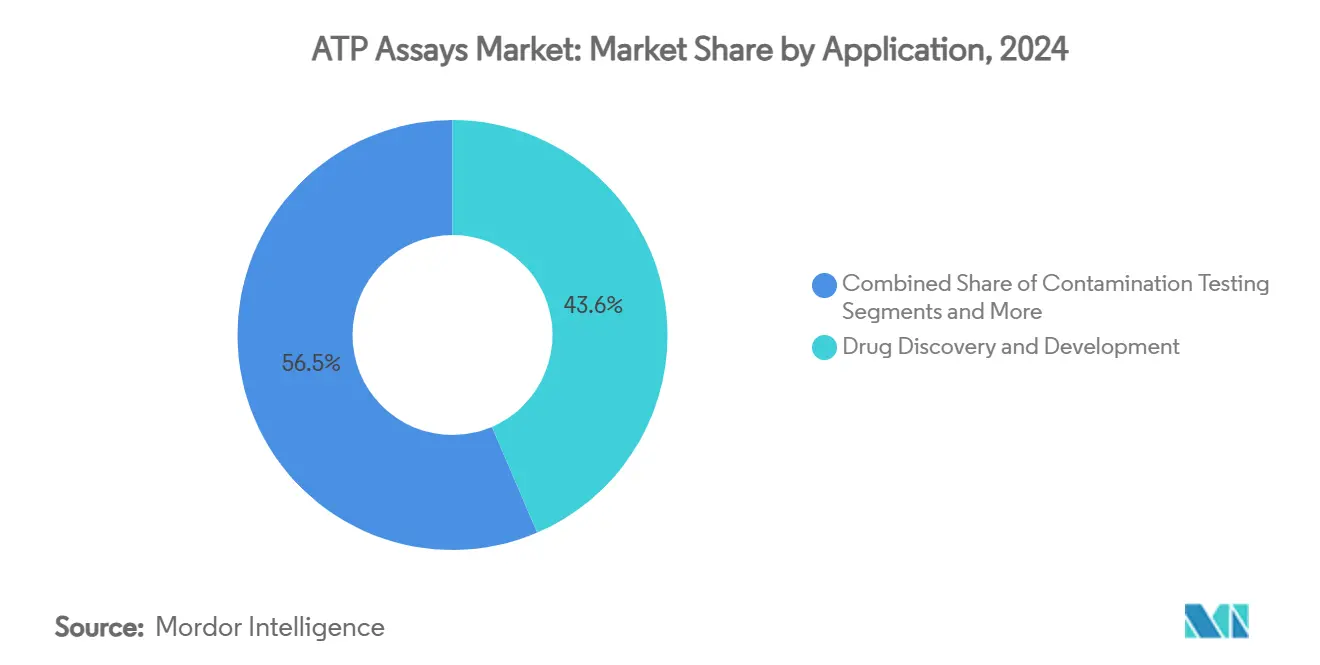
- By application, drug discovery accounted for 43.6% of the ATP assays market size in 2024; clinical diagnostics is expected to advance at an 11.7% CAGR between 2025 and 2030.
- By end user, pharmaceutical and biotechnology companies commanded 51.5% of the ATP assays market share in 2024; hospitals and diagnostic laboratories are rising at a 10.8% CAGR through 2030.
- By geography, North America led with 36.4% of the ATP assays market share in 2024; Asia-Pacific is anticipated to post a 10.4% CAGR over the forecast period.
Global ATP Assays Market Trends and Insights
Drivers Impact Analysis*
| Driver | (~) % Impact on CAGR Forecast | Geographic Relevance | Impact Timeline |
|---|---|---|---|
| Rising R&D Spending In Pharma & Biotech | +1.8% | Global, concentrated in North America & Europe | Medium term (2-4 years) |
| Growing Demand For Rapid Contamination Testing | +1.5% | Global, particularly APAC food & beverage sector | Short term (≤ 2 years) |
| Increasing Chronic-Disease Driven Diagnostics Adoption | +1.3% | Global, with emphasis on aging populations in developed markets | Long term (≥ 4 years) |
| Microfluidics-Enabled Single-Cell ATP Profiling | +1.0% | North America & Europe research institutions | Medium term (2-4 years) |
| Space-Biology Demand For Ultra-Sensitive ATP Detection | +0.7% | North America, with spillover to international space agencies | Long term (≥ 4 years) |
| AI-Optimised Low-Reagent ATP Assay Workflows | +0.9% | Global, led by technology-advanced markets | Medium term (2-4 years) |
| Source: Mordor Intelligence | |||
Rising R&D spending in pharma & biotech
Drug developers require reliable high-throughput assays to triage thousands of compounds, and the ATP-based tumor chemosensitivity assay delivers 85-90% positive predictive value while using only 1 × 10⁶ tumor cells per panel.[1]Christian Kurbacher, Ian Cree, “Chemosensitivity Testing Using Microplate Adenosine Triphosphate-Based Luminescence Measurements,” Springer, springer.com Artificial-intelligence platforms such as INS018-055, the first AI-generated drug to enter Phase 2 trials, further multiply screening volumes and cement luminometers at the center of discovery pipelines. Japan’s venture-capital incentives and tax breaks now target next-generation biologics, stimulating fresh orders for automated reader–reagent bundles. Instrument advances such as silicon-photon-multiplier arrays capture weaker bioluminescent events, and reagent kits with longer signal half-lives improve throughput. As a result, the ATP assays market supports faster lead-optimization cycles and reduces late-stage failures.
Growing demand for rapid contamination tests
Food processors apply ATP swabs to verify sanitation because results arrive in under a minute, far faster than culture plates that need days. Hygiena’s UltraSnap and SuperSnap systems produce real-time pass-fail thresholds that align with hazard-analysis programs. Practical audits show 75–93% reductions in ATP counts after cleaning, confirming the method’s field reliability. Water-utility engineers likewise replace heterotrophic plate counts with ATP monitoring, which correlates more closely with residual chlorine levels in low-bioload mains.[2]William S. Chen, “Evaluating ATP Testing for Distribution System Monitoring: Comparison to HPC, Impact of Chlorine Quenching, and Hold Time Dependency,” Journal of Biological Engineering, jb ioleng.biomedcentral.comThe momentum spreads across beverage plants, dairy lines, and cold-chain warehouses, each seeking verifiable hygiene. As regulations tighten, the ATP assays market provides an economical route to continuous contamination surveillance.
Chronic-disease-driven diagnostics adoption
Hospitals fight procedure-related infections by testing cleaned endoscopes and surgical tools with luminometers that flag residual bioburden above 200 RLU.[3]Ada S. F. Chan, “Effectiveness of Adenosine Triphosphate to Monitor Manual Cleaning and Disinfection Efficacy of Flexible Endoscopes in Hong Kong,” Journal of Gastroenterology and Hepatology, wiley.comHandheld devices priced near USD 700 reach sub-attomole sensitivity and allow point-of-care use in wards, outpatient centers, and emergency rooms. ATP readouts couple with flow-cytometry sorting and qPCR, shortening Legionella detection from several days to 6 hours. Rapid confirmation speeds treatment decisions and protects immunocompromised patients. Consequently, hospitals adopt ATP luminometry as a routine quality-assurance checkpoint, expanding the ATP assays market footprint in clinical diagnostics.
Microfluidics-enabled single-cell profiling
Lab-on-a-chip devices now measure ATP in as few as 100 cells per well, delivering sensitivity comparable to capillary electrophoresis without cumbersome sample prep. Super-stable metal-organic-framework paper sensors detect 7 × 10⁻¹² moles of ATP and store at room temperature, removing refrigeration costs in field studies. Scientists combine these microfluidics platforms with CRISPR screens to profile metabolic heterogeneity across tumor biopsies. As personalized-medicine programs expand, demand for compact, low-volume assays strengthens, adding momentum to the ATP assays market.
Restraints Impact Analysis*
| Restraint | (~) % Impact on CAGR Forecast | Geographic Relevance | Impact Timeline |
|---|---|---|---|
| High Cost Of High-Sensitivity Luminometers | -1.2% | Global, particularly impacting emerging markets | Short term (≤ 2 years) |
| Sample-Matrix Interference / False Positives | -0.8% | Global, with higher impact in complex sample applications | Medium term (2-4 years) |
| Regulatory Ambiguity In Water-Reuse Standards | -0.6% | Regional, primarily affecting water utilities sector | Long term (≥ 4 years) |
| Supply-Chain Risk For Luciferase Enzyme | -0.9% | Global, with concentration risk in specialized suppliers | Medium term (2-4 years) |
| Source: Mordor Intelligence | |||
High cost of high-sensitivity luminometers
Entry-level handheld meters cost USD 700, yet benchtop instruments tuned for single-cell research exceed USD 20,000, squeezing budgets in low-resource labs. SystemSURE Plus positions itself as a maintenance-free alternative, but users sacrifice signal-to-noise ratios when chasing deep detection limits. High acquisition prices slow penetration into public hospitals and university departments in emerging economies, tempering ATP assays market acceleration despite long-term value.
Sample-matrix interference / false signals
Residual disinfectants, organic acids, and dissolved metals can produce non-specific luminescence that masks true ATP levels. Water-quality studies reveal different correction factors for surface, rain, and tap water, forcing laboratories to validate each protocol separately. Additional filtration steps raise reagent consumption and labor, offsetting the rapid-testing advantage. Until universal quenching chemistries emerge, sample-specific interference remains a headwind for the ATP assays market.
*Our forecasts treat driver/restraint impacts as directional, not additive. The impact forecasts reflect baseline growth, mix effects, and variable interactions.
Segment Analysis
By Product Type: Consumables Drive Recurring Revenue Growth
Instruments represented 56.46% of the ATP assays market in 2024, reflecting significant capital expenditure for luminometers and reader platforms. Consumables, however, are expanding at a 12.33% CAGR as high-throughput workflows trigger frequent reagent re-orders and shift revenue toward subscription-style models. Promega’s CellTiter-Glo 2.0 kit retains luminescent activity at room temperature, slashing cold-storage costs and enhancing laboratory efficiency. Biosynth’s X-Shining reagents incorporate patented stabilizers that lengthen shelf life and streamline assay setup. The ATP assays market size for consumables therefore grows in tandem with the push for leaner, faster analytical cycles.
Laboratories also gravitate toward compact luminometers featuring interchangeable sensor modules and cloud-based diagnostics that cut downtime. Lower maintenance encourages smaller clinics to adopt on-site contamination checks, further boosting consumable demand. As vendors bundle calibration swabs and quality-control vials with luminometers, reagent sales evolve into annuity streams that underpin sustainable ATP assays market expansion.


By Technique: Luciferase Dominance Faces Fluorometric Challenge
Luciferase-driven bioluminescence held 78.36% market share in 2024, thanks to picomolar sensitivity and minimal background noise. Artificial luciferase variants with extended glow times and resistance to product inhibition broaden dynamic range and reduce reagent volumes. Consequently, high-precision oncology screens and environmental assays keep bioluminescence at the forefront of the ATP assays market.
Fluorometric assays grow at 11.78% CAGR because they use standard plate readers already present in many labs. Although less sensitive, they suit routine quality-control checks where cost and simplicity outweigh ultra-low detection thresholds. Colorimetric kits occupy a small but stable niche, favored in educational settings and micro-breweries. The coexistence of these methods shows the ATP assays market adapting technique choices to application objectives and budget constraints.
By Application: Clinical Diagnostics Accelerates Beyond Drug Discovery
Drug discovery tasks held 43.55% ATP assays market share in 2024, as cytotoxicity screens, viral replication assays, and metabolic profiling rely on fast ATP output for compound ranking. Yet clinical diagnostics is rising fastest at 11.69% CAGR, driven by hospital adoption of luminometry for infection-control audits and rapid pathogen detection. Point-of-care readers now integrate with electronic medical records, automatically logging test outcomes.
Food-and-beverage contamination checks leverage ATP swabs and surface readers to validate sanitation between shifts, slashing downtime and product recall risk. Municipal waterworks employ ATP assays as early-warning biomarkers for microbial bloom, replacing slow heterotrophic counts. Emerging research spans aerospace life-detection missions, where NASA uses ultrasensitive ATP platforms to monitor spacecraft sterility. Together, these use cases diversify revenue and strengthen the ATP assays market.

By End User: Hospitals Emerge as Growth Catalyst
Pharmaceutical and biotech organizations retained 51.47% ATP assays market share in 2024 because luminometry remains embedded across discovery, process development, and lot-release testing. Hospitals and diagnostic laboratories, though smaller in absolute terms, expand at 10.83% CAGR as handheld luminometers verify reprocessing efficacy of reusable devices and help track waterborne pathogens.
Academic institutes deploy single-cell ATP chips to explore metabolic heterogeneity in tumor biopsies. Food and beverage companies integrate luminometers on production lines to ensure hygiene, while water and environmental utilities incorporate ATP protocols in distribution and treatment facilities. This multi-sector pull underpins a resilient ATP assays market, buffering suppliers from cyclic spending in any single segment.
Geography Analysis
North America controlled 36.44% of ATP assays market revenue in 2024, propelled by deep pharmaceutical pipelines, NASA’s stringent planetary-protection requirements, and tight FDA contamination thresholds. U.S. instrument makers Thermo Fisher and Promega anchor supply chains, while Canadian utilities pilot ATP sensors in drinking-water networks. Academic grants support microfluidic innovations and artificial luciferase research. These factors sustain a mature yet steadily growing ATP assays market.
Asia-Pacific records the highest 10.43% CAGR through 2030. Japan’s roadmap to triple its biotech output to JPY 15 trillion sparks procurement of high-throughput luminometers for antibody and gene-therapy facilities. China’s biopharmaceutical revenue is projected to climb from CNY 565.3 billion in 2022 to CNY 1.4 trillion by 2029, driving demand for sterility-assurance reagents in large-scale cell-culture plants. India benefits from the 2024 U.S. Biosecure Act, which redirects contract development projects away from Chinese suppliers, leading domestic CDMOs to upgrade QC labs with ATP hygiene meters. Southeast Asian food exporters adopt ATP checks to meet international safety codes, adding incremental volume to the ATP assays market.
Europe delivers stable growth as pharmaceutical R&D and stringent environmental regulations maintain steady demand. EU drinking-water directives encourage utilities to incorporate ATP measuring systems for real-time microbial alerts. Academic consortia funded by Horizon Europe investigate next-generation artificial luciferases, expanding the technique portfolio. Middle East and Africa, and South America, though smaller, show rising interest as hospital construction and food-processing investments create new avenues for ATP-based monitoring. Lightweight handheld readers appeal to clinics in resource-constrained settings, broadening the global ATP assays market footprint.

Competitive Landscape
The ATP assays market remains moderately fragmented. Thermo Fisher Scientific, Merck KGaA, and Promega lead through expansive kit portfolios, integrated luminometers, and global distribution. Each invests heavily in R&D to refine signal stability and reduce reagent volumes. Agilent’s USD 925 million purchase of BioVectra in 2024 expanded its position in oligonucleotide manufacturing and strengthened its process-analytics offering, including ATP-based QC solutions.
Middle-tier players target white-space applications such as space biology, single-cell immunometabolism, and environmental monitoring. Start-ups develop freeze-dried luciferase paper strips that survive ambient shipping. Hardware teams incorporate silicon-photomultiplier chips for higher quantum efficiency at lower voltage, while software firms bundle cloud dashboards that log ATP readings across multi-site operations. Collaborations among reagent makers, instrument firms, and contract research organizations grow as buyers prefer turnkey platforms. Competitive intensity drives continuous innovation, yet technical differentiation keeps pricing rational, supporting healthy margins across the ATP assays market.
ATP Assays Industry Leaders
Thermo Fisher Scientific Inc.
Merck KGaA
Promega Corporation
Agilent Technologies Inc.
Danaher Corp.
- *Disclaimer: Major Players sorted in no particular order

Recent Industry Developments
- March 2025: Biotium released the Steady-ATP HTS Viability Assay Kit, delivering extended luminescent signals for high-throughput screening.
- April 2024: Reaction Biology debuted the HotSpot ATP-Max KinomeScreen platform at AACR 2024, expanding comprehensive kinase profiling capabilities.


Global ATP Assays Market Report Scope
| Consumables (Kits, Reagents, Microplates) |
| Instruments (Luminometers, Readers) |
| Luciferase-based Bioluminescence |
| Colorimetric ATP Assays |
| Fluorometric ATP Assays |
| Drug Discovery & Development | |
| Contamination Testing | Food & Beverage |
| Water Utilities | |
| Disease Testing / Clinical Diagnostics | |
| Other Research Applications |
| Pharmaceutical & Biotechnology Companies |
| Academic & Research Institutes |
| Food & Beverage Companies |
| Hospitals & Diagnostic Labs |
| Water & Environmental Utilities |
| North America | United States |
| Canada | |
| Mexico | |
| Europe | Germany |
| United Kingdom | |
| France | |
| Italy | |
| Spain | |
| Rest of Europe | |
| Asia-Pacific | China |
| Japan | |
| India | |
| Australia | |
| South Korea | |
| Rest of Asia-Pacific | |
| Middle East and Africa | GCC |
| South Africa | |
| Rest of Middle East and Africa | |
| South America | Brazil |
| Argentina | |
| Rest of South America |
| By Product Type | Consumables (Kits, Reagents, Microplates) | |
| Instruments (Luminometers, Readers) | ||
| By Technique | Luciferase-based Bioluminescence | |
| Colorimetric ATP Assays | ||
| Fluorometric ATP Assays | ||
| By Application | Drug Discovery & Development | |
| Contamination Testing | Food & Beverage | |
| Water Utilities | ||
| Disease Testing / Clinical Diagnostics | ||
| Other Research Applications | ||
| By End User | Pharmaceutical & Biotechnology Companies | |
| Academic & Research Institutes | ||
| Food & Beverage Companies | ||
| Hospitals & Diagnostic Labs | ||
| Water & Environmental Utilities | ||
| By Geography | North America | United States |
| Canada | ||
| Mexico | ||
| Europe | Germany | |
| United Kingdom | ||
| France | ||
| Italy | ||
| Spain | ||
| Rest of Europe | ||
| Asia-Pacific | China | |
| Japan | ||
| India | ||
| Australia | ||
| South Korea | ||
| Rest of Asia-Pacific | ||
| Middle East and Africa | GCC | |
| South Africa | ||
| Rest of Middle East and Africa | ||
| South America | Brazil | |
| Argentina | ||
| Rest of South America | ||


Key Questions Answered in the Report
1. What is the projected value of the ATP assays market by 2030?
The ATP assays market is forecast to reach USD 6.02 billion by 2030, growing at an 8.28% CAGR.
2. Which product category is expanding fastest?
Consumables such as kits and reagents are advancing at a 12.33% CAGR as high-throughput workflows lift repeat purchases
3. Why are hospitals adopting ATP luminometry?
Hospitals use handheld readers to confirm instrument reprocessing and surface hygiene within minutes, improving infection-control efficiency.
4. Which region will contribute the most incremental growth?
Asia-Pacific leads with a 10.43% CAGR, driven by expanding biotech hubs in Japan, China, and India.
5. How sensitive are modern ATP detection systems?
Current handheld meters detect ATP at sub-attomole levels, while benchtop units reach single-cell resolution for advanced research.
Page last updated on:


