Apoptosis Assay Market Size and Share
Market Overview
| Study Period | 2020 - 2031 |
|---|---|
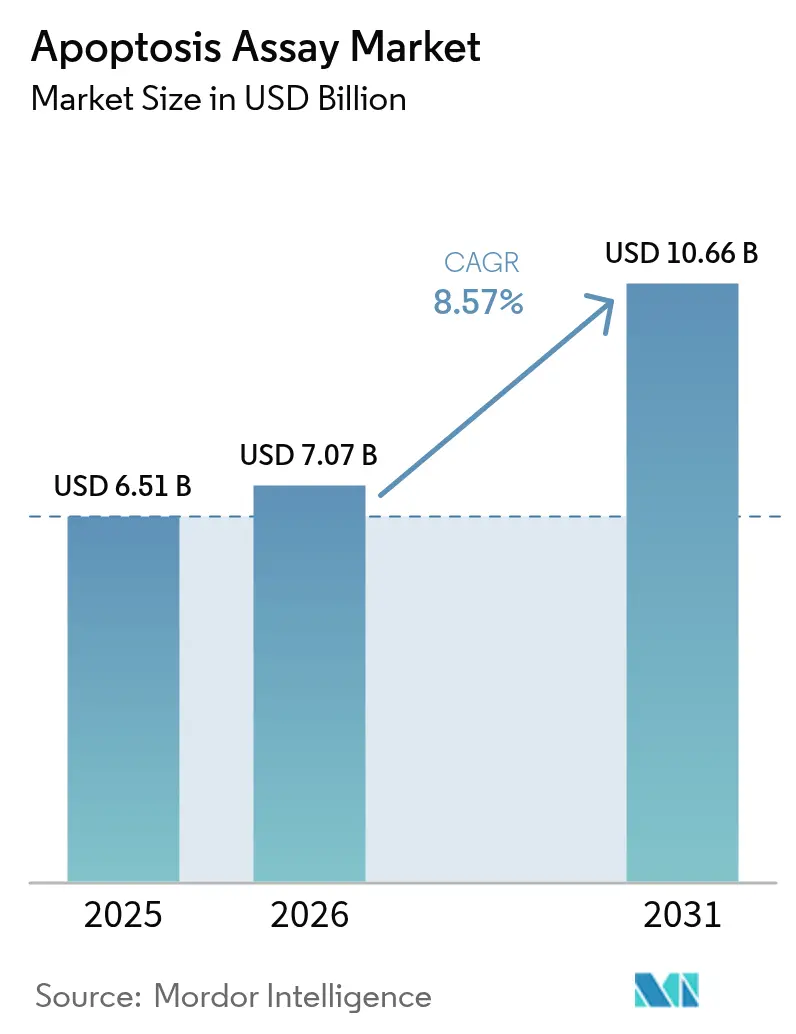
| Market Size (2026) | USD 7.07 Billion |
| Market Size (2031) | USD 10.66 Billion |
| Growth Rate (2026 - 2031) | 8.57% CAGR |
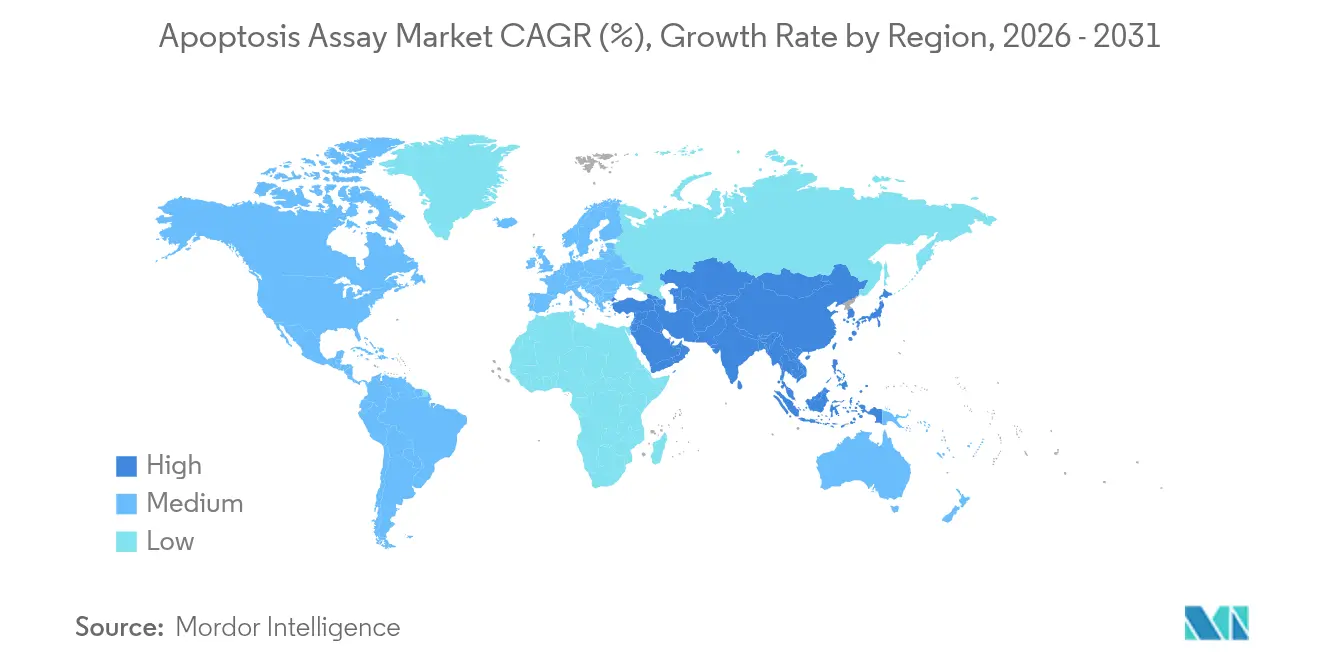
| Fastest Growing Market | Asia Pacific |
| Largest Market | North America |
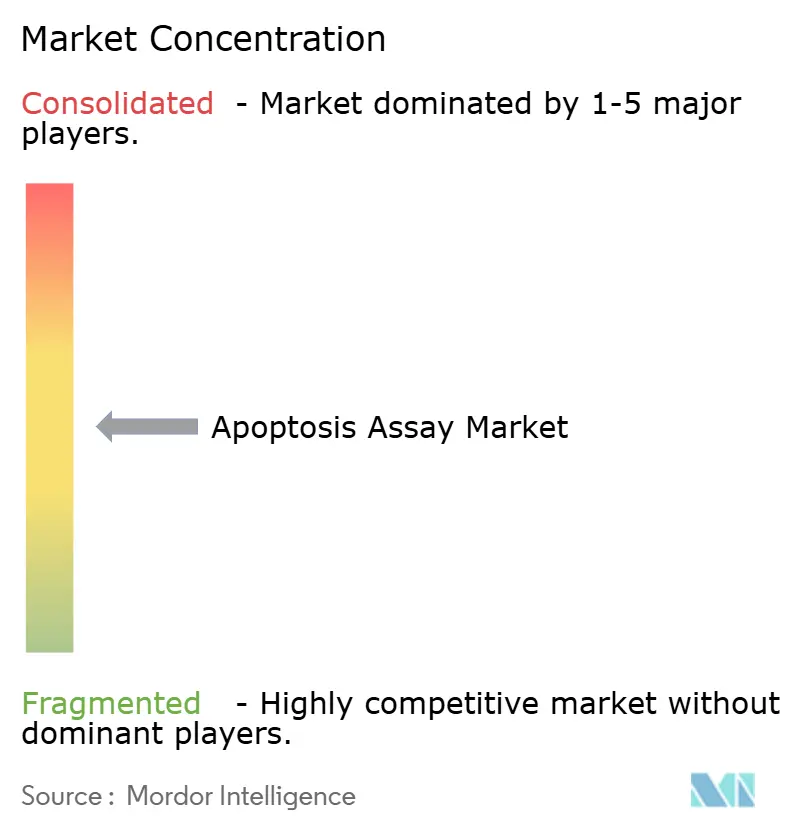
| Market Concentration | Medium |
Major Players *Disclaimer: Major Players sorted in no particular order Image © Mordor Intelligence. Reuse requires attribution under CC BY 4.0. | |
Apoptosis Assay Market Analysis by Mordor Intelligence
The Apoptosis Assay market size is expected to grow from USD 6.51 billion in 2025 to USD 7.07 billion in 2026 and is forecast to reach USD 10.66 billion by 2031 at 8.57% CAGR over 2026-2031.
This wide growth arc underlines the central role of quantitative cell-death analytics in precision oncology, immunology and regenerative medicine. Uptake accelerates as 3D organoid models gain traction, artificial‐intelligence platforms raise screening throughput and regulators harmonize laboratory-developed-test requirements. Demand also benefits from rising chronic-disease prevalence and sustained federal funding for cell-based R&D. Leading suppliers respond with integrated workflow solutions that combine high-content imaging, single-cell multi-omics and cloud analytics, creating higher switching costs and reinforcing the intellectual-property moat around next-generation detection methods.
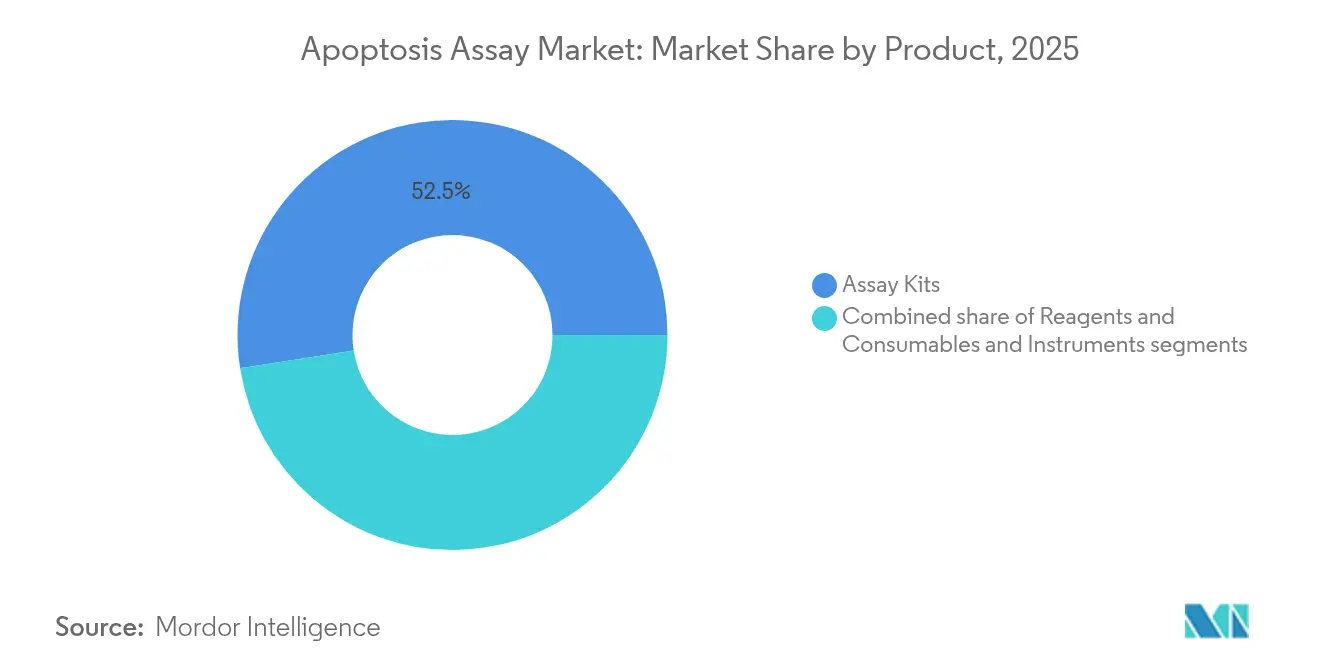
- By product category, assay kits led with 52.48% of apoptosis assay market share in 2025, while reagents and consumables are projected to expand at a 9.54% CAGR through 2031.
- By detection technology, flow cytometry held 39.10% revenue share in 2025; spectrophotometry is forecast to grow at a 9.98% CAGR to 2031.
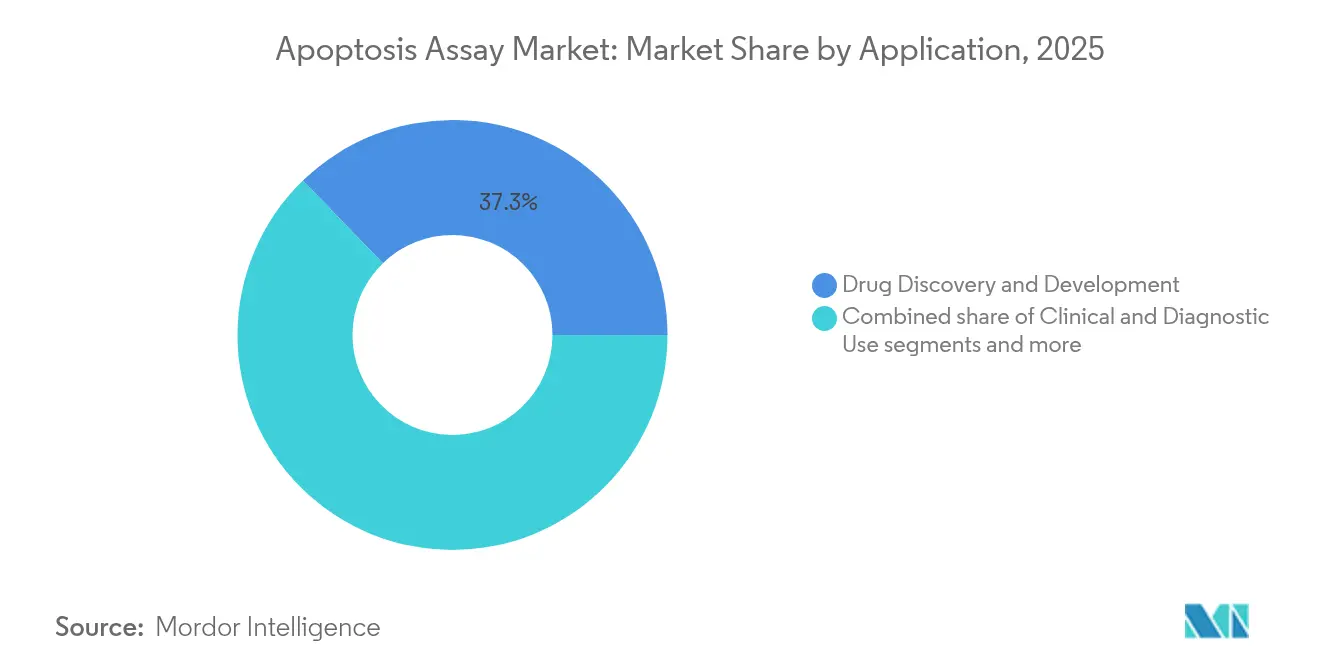
- By application, drug discovery and development accounted for a 37.25% share of the apoptosis assay market size in 2025, yet stem-cell and regenerative-medicine research is advancing at a 9.5% CAGR through 2031.
- By end user, pharmaceutical and biotechnology companies commanded 53.62% of the apoptosis assay market size in 2025, while hospitals and clinical laboratories record the fastest CAGR at 10.18%.
- By geography, North America contributed 47.42% revenue share in 2025; Asia Pacific is the fastest-growing region at a 9.91% CAGR through 2031.
Note: Market size and forecast figures in this report are generated using Mordor Intelligence’s proprietary estimation framework, updated with the latest available data and insights as of 2026.
Global Apoptosis Assay Market Trends and Insights
Drivers Impact Analysis*
| Driver | (~) % Impact on CAGR Forecast | Geographic Relevance | Impact Timeline |
|---|---|---|---|
| Rising incidence of chronic & autoimmune diseases | 1.8% | Global, with concentration in North America & Europe | Medium term (2-4 years) |
| Advancements in apoptosis-modulating therapeutics | 2.1% | Global, led by North America & Asia Pacific | Long term (≥ 4 years) |
| Expanding funding for cell-based R&D & precision medicine | 1.5% | North America & Europe, expanding to Asia Pacific | Medium term (2-4 years) |
| Mainstream adoption of high-throughput screening platforms | 1.2% | Global, with early adoption in developed markets | Short term (≤ 2 years) |
| Emergence of single-cell multi-omics workflows needing apoptosis quantification | 0.8% | North America & Europe, emerging in Asia Pacific | Long term (≥ 4 years) |
| Shift to 3-D organoid models requiring imaging-compatible assays | 0.9% | Global, with concentration in research-intensive regions | Medium term (2-4 years) |
| Source: Mordor Intelligence | |||
Rising Incidence of Chronic & Autoimmune Diseases
Chronic-disease prevalence reshapes demand curves for apoptosis quantification. National Cancer Institute grants such as the USD 4.9 million RNA Modifications Driving Oncogenesis initiative prioritize apoptosis pathway mapping to decode translational reprogramming in tumors. Autoimmune disorders add further momentum because dysregulated cell death sustains inflammatory cascades. Research into apoptotic extracellular vesicles shows potential for immune modulation across cancer, ischemic injury and inflammatory diseases. With aging populations, laboratories now deploy multiplex panels that read caspase activity, mitochondrial depolarization and phosphatidylserine exposure in parallel, aligning assay workflows with the multifactorial biology of chronic illness.
Advancements in Apoptosis-Modulating Therapeutics
Clinical pipelines that target BCL-2, IAP and MDM2-p53 regulators require precise, pathway-specific analytics. Ascentage Pharma runs active trials across all three classes, illustrating the commercial stake in accurate apoptosis measurement. Beyond oncology, navitoclax demonstrates host-directed action in tuberculosis by accelerating infected-cell clearance when paired with antibiotics. Drug developers therefore seek assays that capture early-stage mitochondrial events, caspase cascades and late DNA fragmentation within a single workflow, driving purchases of high-content imaging platforms and machine-learning analytics.
Expanding Funding for Cell-Based R&D & Precision Medicine
Federal initiatives such as the Innovative Research in Cancer Nanotechnology program allocate USD 475,000 annually for apoptosis-centric nanomedicine projects.[1]Source: National Institutes of Health, “Innovative Research in Cancer Nanotechnology,” grants.nih.gov Precision-medicine consortia further boost demand by profiling patient-specific cell death signatures to guide therapy choice. Venture funding flows into AI-driven stem-cell research, creating fresh use-cases for apoptosis monitoring in cardiomyocyte and neural differentiation studies. Licensing deals between universities and life-science suppliers accelerate time-to-market for novel fluorogenic substrates and microfluidic chips.
Mainstream Adoption of High-Throughput Screening Platforms
Automation reshapes operational economics. BD’s collaboration with Biosero integrates robots with flow cytometers, enabling unattended processing of multiple microplates and shortening screening cycles for pharmaceutical clients. AI-enhanced systems such as HCS-3DX deliver single-cell analytics in 3D tumor spheroids at scale. Drug-discovery groups now select platforms based on integration depth with laboratory-information-management systems and compatibility with multi-omics data ingestion.
Restraints Impact Analysis*
| Restraint | (~) % Impact on CAGR Forecast | Geographic Relevance | Impact Timeline |
|---|---|---|---|
| Stringent multi-jurisdictional regulatory requirements | -1.4% | Global, particularly North America & Europe | Medium term (2-4 years) |
| High capital & operating cost of advanced detection instruments | -0.9% | Global, with greater impact in emerging markets | Short term (≤ 2 years) |
| Reproducibility & standardisation challenges across assay kits | -0.7% | Global, with emphasis on research applications | Medium term (2-4 years) |
| Phototoxicity artefacts in live-cell imaging limiting data reliability | -0.5% | Global, affecting advanced imaging applications | Short term (≤ 2 years) |
| Source: Mordor Intelligence | |||
Stringent Multi-Jurisdictional Regulatory Requirements
The FDA’s final rule for laboratory-developed tests applies a five-stage phased-enforcement plan, adding compliance costs between USD 566 million and USD 3.56 billion each year. European ATMP guidelines impose parallel GMP obligations for cell-therapy analytics. Vendors must therefore design validation packages that meet divergent documentary standards, slowing product launches and nudging smaller developers toward licensing rather than direct commercialization.
High Capital & Operating Cost of Advanced Detection Instruments
Cutting-edge flow cytometers and 3D imaging systems cost above USD 500,000, with service contracts adding 10-15% annually. Single-cell multi-omics rigs also demand specialist staff and bioinformatics pipelines, stretching budgets at mid-tier biotech firms.[2]Source: Bolin Li, “Single-Cell Sequencing to Multi-Omics: Technologies and Applications,” Biomarker Research, biomarkerres.biomedcentral.com Rapid obsolescence risk further dampens purchase decisions in price-sensitive markets, slowing penetration despite recognized performance advantages.
*Our forecasts treat driver/restraint impacts as directional, not additive. The impact forecasts reflect baseline growth, mix effects, and variable interactions.
Segment Analysis
By Product: Kits Lead Despite Consumables Acceleration
Assay kits generated 52.48% of apoptosis assay market revenue in 2025, underscoring the appeal of turnkey protocols that bundle buffers, conjugates and controls. Reagents and consumables, though smaller, are on track for a 9.54% CAGR because high-throughput platforms consume large reagent volumes and allow laboratories to tailor protocols. Instruments post moderate growth as capital cycles align with AI upgrades and optical-resolution gains.
Spending shifts toward individual dyes, fluorogenic substrates and customized buffer sets indicate process maturity. Annexin V-FITC and APC conjugates remain mainstays, while second-generation caspase-3/7 substrates gain drug-screening traction.


By Detection Technology: Flow Cytometry Dominance Challenged by Spectrophotometry Growth
Flow cytometry captured 39.10% apoptosis assay market share in 2025 through its single-cell clarity and multi-parameter capability. Spectrophotometry, valued for plate-level speed, is advancing at a 9.98% CAGR. High-content imaging and 3D holotomography occupy the premium end, serving organoid research and AI analytics.
Flow cytometers apply dual-stain Annexin V/propidium-iodide protocols to resolve early versus late apoptosis. Spectrophotometric caspase assays can screen 384-well plates within 90 minutes. Advanced imaging systems are incorporating artificial intelligence algorithms to automate apoptosis quantification in 3D organoid models, addressing the complexity of analyzing cell death in physiologically relevant systems. The integration of holotomography with organoid culture systems enables real-time observation of apoptotic processes without fluorescent staining, representing a significant technological advancement.
By Application: Drug Discovery Leadership with Regenerative Medicine Momentum
Drug discovery and development contributed 37.25% of 2025 revenue, cementing its role as the largest buyer group. Regenerative-medicine research is the pace setter at 9.5% CAGR, reflecting stem-cell therapy expansion. Clinical diagnostics show stable adoption as apoptosis biomarkers enter oncology and cardiology pathways.
Stem-cell investigators track apoptosis to refine differentiation protocols and evaluate therapeutic potency. Research demonstrates that anti-apoptotic mechanisms are more crucial than angiogenesis in mesenchymal stem cell therapy for acute myocardial infarction, highlighting the importance of apoptosis monitoring in therapeutic optimization. The integration of nanotechnology with stem cell medicine is creating new applications for apoptosis assays in targeted drug delivery and cell tracking applications.
By End User: Pharma Dominance with Clinical Lab Acceleration
Pharmaceutical and biotechnology firms accounted for 53.62% of 2025 sales, anchored by high compound-screening demand. Hospitals and clinical labs are climbing at a 10.18% CAGR, catalyzed by precision-medicine diagnostics. Academic institutes remain crucial innovators but exhibit steadier spending trajectories.
Clinical labs deploy standardized Annexin V and cleaved-caspase-3 assays to monitor tumor-cell response during treatment cycles. Point-of-care devices on microfluidic chips are under development for rapid bedside viability checks, potentially democratising apoptosis analytics in oncology wards.
Geography Analysis
North America held 47.42% of 2025 revenue as NIH grants and robust venture capital support continuous adoption of advanced platforms. The FDA’s laboratory-developed-test rule, offering USD 3.51 billion in annualized benefits, fosters uniform quality expectations that incentivize investment. Canada’s biotech corridor and Mexico’s contract-manufacturing hubs add incremental growth.
Asia Pacific is the fastest growing region at 9.91% CAGR through 2031. Japan scales its biotech revival strategy with direct funding for drug discovery programs that require apoptosis monitoring. South Korea and Australia expand clinical-trial infrastructure, while India leverages contract research depth to supply reagents and data services.
Europe maintains balanced growth, driven by pharmaceutical heavyweights and pan-EU research networks. The EMA’s approval of Fruzaqla for metastatic colorectal cancer underscores the region’s focus on advanced therapeutics that demand robust biomarker surveillance. The European Commission’s biotechnology strategy further supports local production and translational research.

Competitive Landscape
The apoptosis assay market features moderate fragmentation. Global leaders combine assay kits, instruments and cloud analytics into integrated portfolios, raising entry barriers. Thermo Fisher strengthened proteomics depth by buying Olink for USD 3.1 billion to expand apoptosis-related biomarker panels.
Niche firms exploit white-space niches such as organoid-compatible dyes, label-free holotomography and AI pattern recognition. Microfluidics start-ups integrate apoptosis and transcriptomic readouts within single chips, appealing to researchers who need minimal sample input. Competitive positioning now hinges on cloud-native analytics, regulatory-grade validation and microservice APIs that plug data directly into electronic-lab-notebook stacks.
Customers gravitate toward vendors offering turnkey support for FDA and EMA filings. As regulatory scrutiny rises, suppliers with in-house quality-systems consulting gain advantage. Market dynamics suggest continuing acquisitive moves as cash-rich conglomerates snap up software or reagent specialists to round out end-to-end solutions.
Apoptosis Assay Industry Leaders
Thermo Fisher Scientific
Merck KGaA
Bio-Rad Laboratories
Becton, Dickinson & Co.
Danaher Corp. (Beckman Coulter, Molecular Devices)
- *Disclaimer: Major Players sorted in no particular order

Recent Industry Developments
- January 2025: Cytek Biosciences introduced the Cytek Muse Micro cell analyzer, bringing affordability and expanded assay capability to apoptosis, cellular stress and immune-cell monitoring.
- August 2024: Bio-Rad Laboratories launched eight StarBright Dye conjugates of annexin V for early-apoptosis detection by flow cytometry.
- June 2023: Nanolive released the LIVE Cytotoxicity Assay, an automated, label-free platform tracking cell health, apoptosis and necrosis in real time.


Research Methodology Framework and Report Scope
Market Definitions and Key Coverage
Our study defines the apoptosis assay market as the revenue generated from commercial kits, reagents, consumables, and purpose-built instruments that detect and quantify programmed cell death events in human or animal cell samples through flow cytometry, spectrophotometry, high-content imaging, and related technologies.
Scope Exclusion: Services that only provide contract research testing or software-only image analysis without an accompanying assay reagent pack are not counted in the revenue base.
Segmentation Overview
- By Product
- Assay Kits
- Annexin V‐based Assays
- Caspase activity Assays
- Mitochondrial membrane potential Assays
- DNA fragmentation Assays
- Reagents and Consumables
- Instruments
- Assay Kits
- By Detection Technology
- Flow Cytometry
- Spectrophotometry
- High-Content / 3-D Cell Imaging Systems
- Other Technologies
- By Application
- Drug Discovery and Development
- Clinical and Diagnostic Use
- Stem-cell and Regenerative Medicine Research
- Other Applications
- By End User
- Pharmaceutical and Biotechnology Companies
- Academic and Research Institutes
- Hospitals and Clinical Laboratories
- Other End Users
- By Geography
- North America
- United States
- Canada
- Mexico
- Europe
- Germany
- United Kingdom
- France
- Italy
- Spain
- Russia
- Rest of Europe
- Asia Pacific
- China
- Japan
- India
- South Korea
- Australia & New Zealand
- Rest of Asia Pacific
- Middle East and Africa
- GCC
- South Africa
- Rest of Middle East and Africa
- South America
- Brazil
- Argentina
- Rest of South America
- North America
Detailed Research Methodology and Data Validation
Primary Research
Mordor analysts interviewed laboratory leads in pharmaceutical and biotechnology firms across North America, Europe, and Asia Pacific, as well as hospital pathologists and university researchers. These discussions clarified prevailing kit pricing, failure rates, and regional adoption curves, which were critical when stress testing secondary numbers and normalizing margin assumptions.
Desk Research
We first mapped public domain indicators that anchor demand, such as global oncology incidence files from the WHO, NIH RePORTER grant flows, and import-export codes for flow cytometers and fluorescent dyes. Trade association briefs from bodies such as the International Society for Advancement of Cytometry, patent families retrieved through Questel, and SEC 10-K disclosures on in-house assay sales supplied further context. Subscription feeds from D&B Hoovers and Dow Jones Factiva helped size vendor level revenues that are not broken out elsewhere. The sources listed illustrate the breadth of material reviewed; many additional datasets were consulted to cross-check trends and fill gaps.
Market-Sizing & Forecasting
Our model uses a top-down demand pool built from cancer, neurodegenerative, and autoimmune research activity, which is then reconciled with sampled bottom-up estimates of kit shipments and average selling prices. Key variables include oncology clinical trial starts, the installed base of flow cytometers, average reagent pulls per test, public research funding, and kit price erosion. A multivariate regression establishes the relationship of these drivers with historical revenue; ARIMA smoothing handles short term volatility. Where supplier roll-ups uncovered material divergence, the gap was proportionally allocated to under-reported geographies before finalizing totals.
Data Validation & Update Cycle
Outputs pass two checkpoints: automated anomaly scans flag outliers, and then a senior analyst reviews variance against external signals. Reports refresh each year, with interim updates triggered by large acquisitions, technology shifts, or guideline changes. A final pre-publication sweep ensures clients receive the latest view.
Why Our Apoptosis Assay Baseline Commands Reliability
Published figures seldom align because publishers vary in how they treat ancillary consumables, animal-only studies, or bundled software, and they refresh models on different cadences.
Key gap drivers include broader product baskets, aggressive price inflation, or the use of single-region samples extrapolated worldwide. Mordor Intelligence limits scope to assay-specific revenues, applies region-weighted price deflators, and updates annually, which curbs overstatement while still capturing new spending waves tied to immuno-oncology pipelines.
Benchmark comparison
| Market Size | Anonymized source | Primary gap driver |
|---|---|---|
| USD 6.51 B (2025) | Mordor Intelligence | |
| USD 6.98 B (2025) | Global Consultancy A | Includes contract testing revenues and software-only analytics |
| USD 6.50 B (2024) | Trade Journal B | Relies on regional sample pricing and five-year refresh cadence |
Across publishers, the spread underscores that scope breadth, base year, and validation depth matter. Our disciplined variable selection and yearly refresh give decision-makers a balanced, transparent baseline they can confidently reference.


Key Questions Answered in the Report
How is artificial intelligence reshaping apoptosis assay workflows?
AI-driven image analysis and robotic plate handling now let laboratories quantify cell-death markers in high-content screens with minimal human intervention, accelerating target validation and lead optimization.
What role do 3D organoid models play in modern apoptosis testing?
Organoid cultures replicate native tissue architecture, so assays optimized for these models provide more predictive readouts of therapeutic efficacy and toxicity than traditional 2D cultures.
Why are hospitals and clinical laboratories expanding their use of apoptosis assays?
Clinicians increasingly rely on apoptosis biomarkers to monitor treatment response in oncology and immune disorders, driving demand for standardized, rapid-turnaround tests that fit routine laboratory workflows.
How are regulatory developments influencing assay design priorities?
Stricter validation requirements for laboratory-developed tests push developers to include built-in controls, automated data capture and traceable quality documentation from the outset of product development.
What is driving the surge in demand for standalone reagents and consumables?
High-throughput platforms consume large volumes of dyes, substrates and buffers, prompting experienced labs to purchase individual components rather than turnkey kits to fine-tune protocols and manage costs.
How are leading suppliers differentiating themselves in a moderately fragmented market?
Vendors integrate instruments, software and cloud analytics into seamless ecosystems, offering end-to-end support that simplifies compliance and locks in long-term customer relationships.
Page last updated on:


