Bioburden Testing Market Size and Share
Market Overview
| Study Period | 2020 - 2031 |
|---|---|
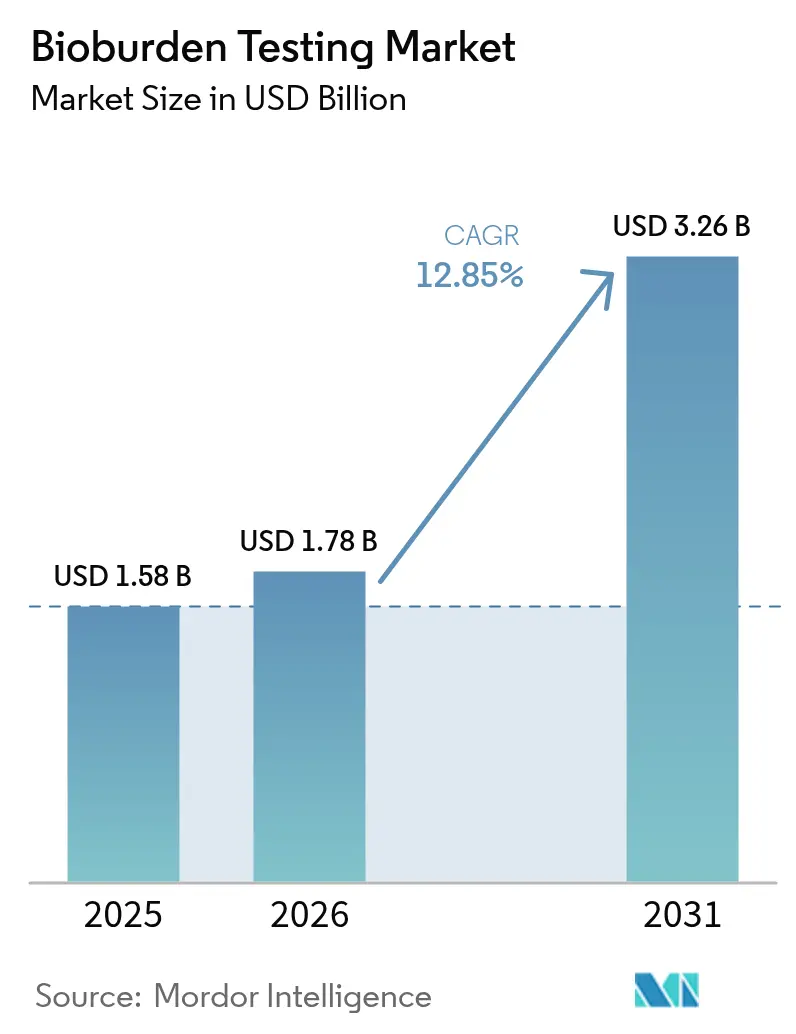
| Market Size (2026) | USD 1.78 Billion |
| Market Size (2031) | USD 3.26 Billion |
| Growth Rate (2026 - 2031) | 12.85% CAGR |
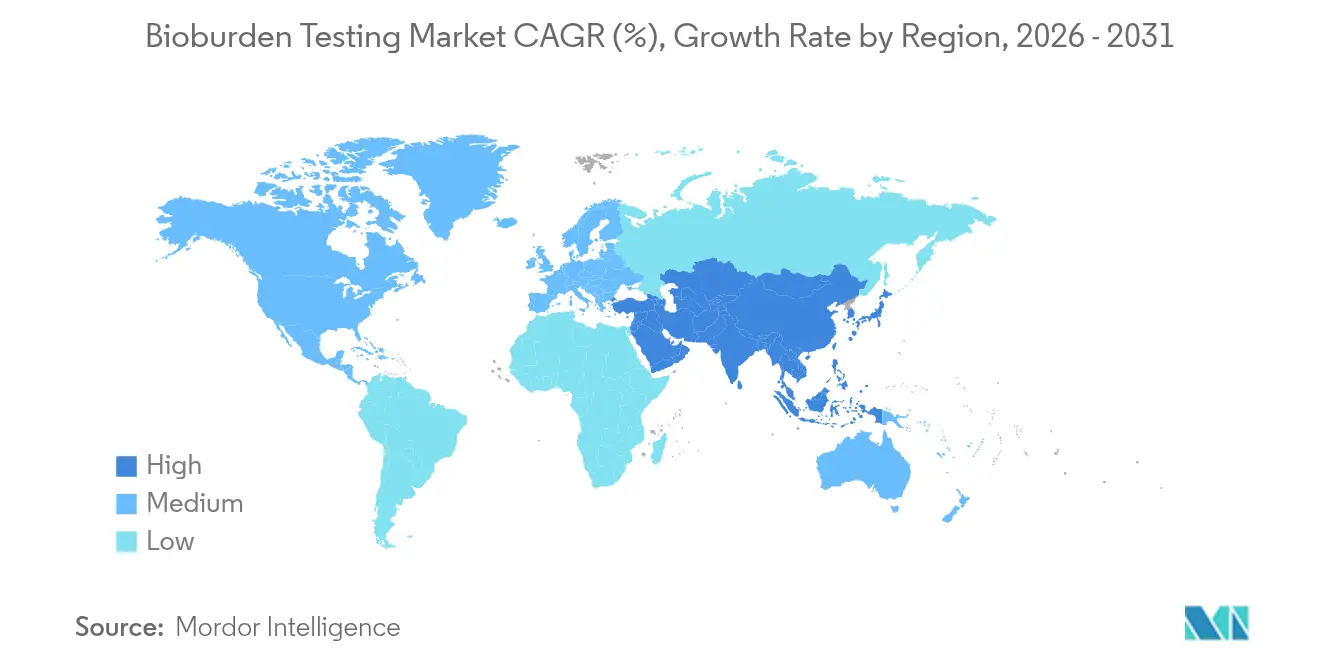
| Fastest Growing Market | Asia-Pacific |
| Largest Market | North America |
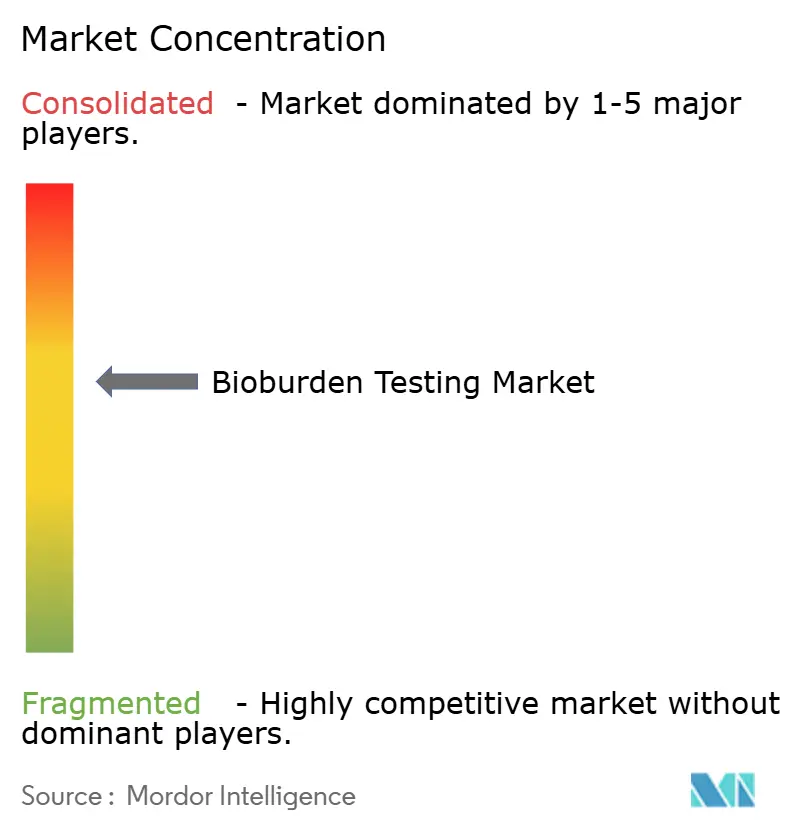
| Market Concentration | Medium |
Major Players *Disclaimer: Major Players sorted in no particular order Image © Mordor Intelligence. Reuse requires attribution under CC BY 4.0. | |
Bioburden Testing Market Analysis by Mordor Intelligence
The Bioburden Testing Market size was valued at USD 1.58 billion in 2025 and estimated to grow from USD 1.78 billion in 2026 to reach USD 3.26 billion by 2031, at a CAGR of 12.85% during the forecast period (2026-2031). Demand accelerates as cell and gene therapy pipelines expand, single-use bioprocessing systems proliferate, and regulators intensify real-time sterility oversight. Manufacturers now favor automated, PCR-enabled instruments that shorten detection windows while pairing them with disposable consumables that curb cross-batch risks. Rapid enumeration technologies further strengthen the bioburden testing market by compressing sample-to-result timelines, a necessity for continuous manufacturing lines. Contract development and manufacturing organizations (CDMOs) deepen adoption as outsourcing grows, while persistent shortages of trained microbiologists spur interest in AI-assisted colony counting.
Key Report Takeaways
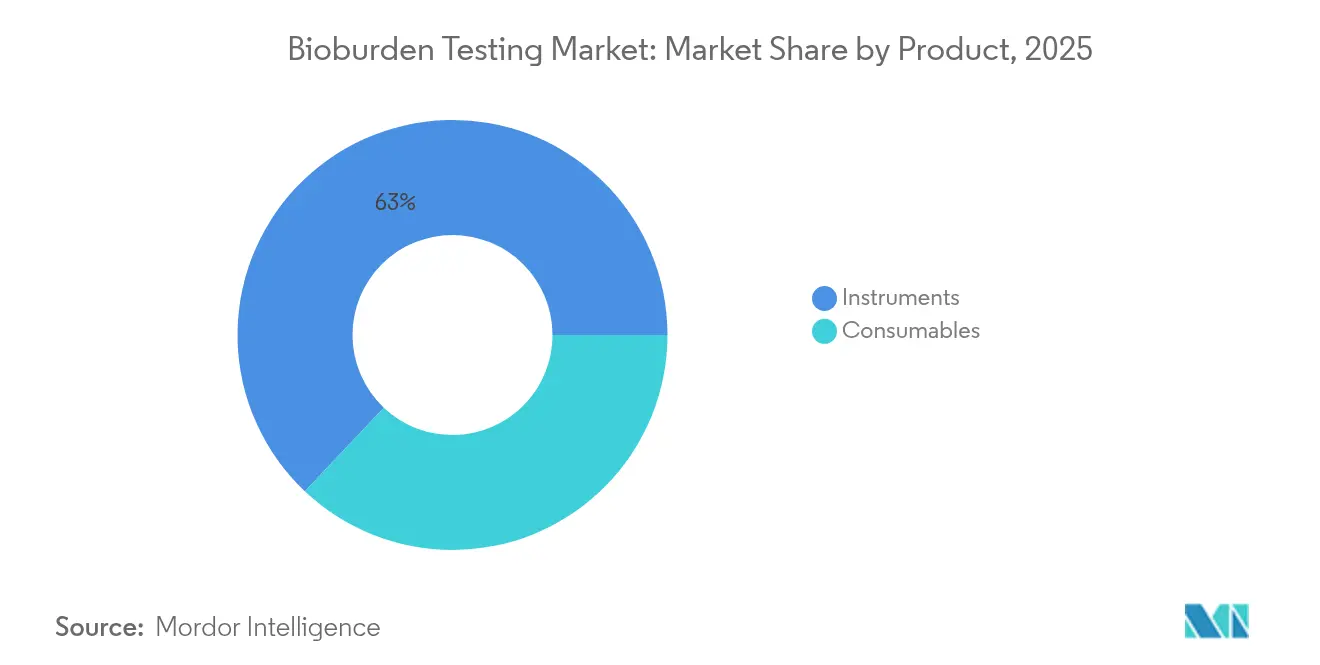
- By product type, instruments led with a 62.95% revenue share of the bioburden testing market in 2025; consumables are expected to rise at a 15.61% CAGR through 2031.
- By enumeration method, plate count techniques held 39.22% of bioburden testing market share in 2025, while rapid and alternative methods are set to expand at a 13.89% CAGR to 2031.
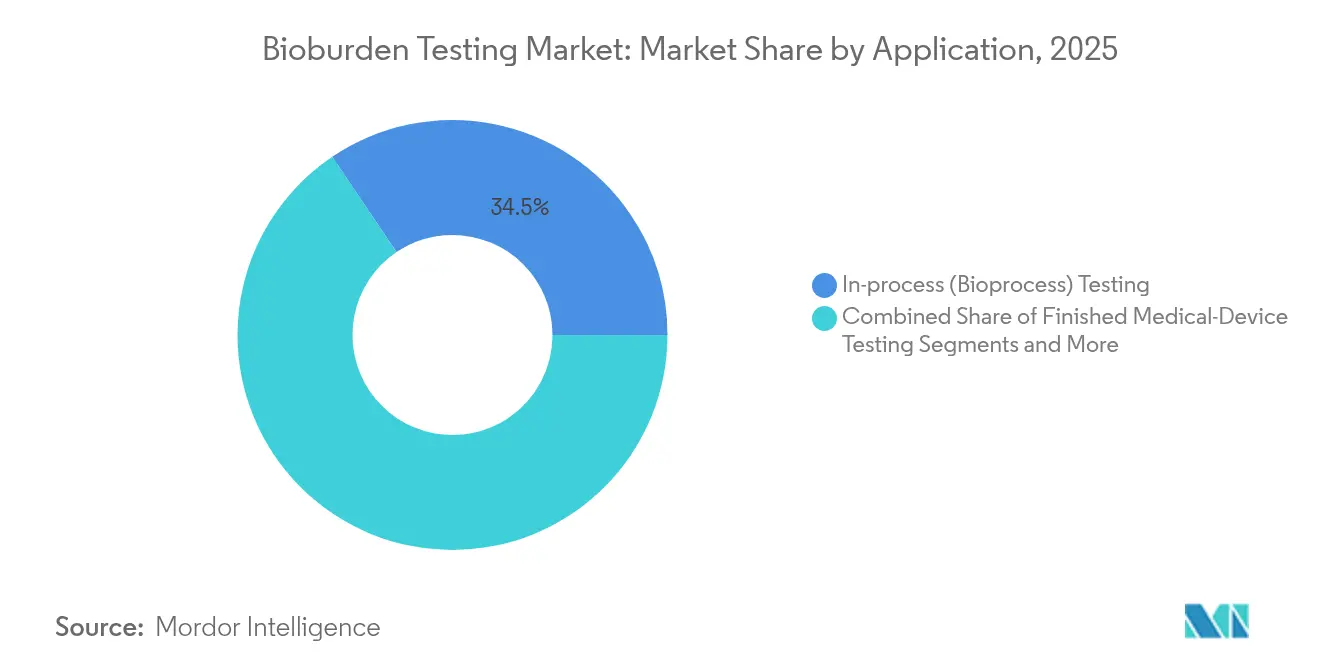
- By application, in-process bioprocess testing accounted for 34.45% of bioburden testing market size in 2025, yet environmental monitoring is forecast to accelerate at a 14.12% CAGR.
- By end-user, pharmaceutical and biopharmaceutical manufacturers commanded 49.12% of demand in 2025; CROs and CMOs are poised to grow at 15.19% CAGR.
- By geography, North America dominated with a 38.18% revenue share in 2025, whereas Asia-Pacific is projected to post a 14.2% CAGR through 2031.
Note: Market size and forecast figures in this report are generated using Mordor Intelligence’s proprietary estimation framework, updated with the latest available data and insights as of 2026.
Global Bioburden Testing Market Trends and Insights
Drivers Impact Analysis*
| Driver | (~) % Impact on CAGR Forecast | Geographic Relevance | Impact Timeline |
|---|---|---|---|
| High frequency of product recalls in rapid-release supply chains | +2.1% | North America, EU | Short term (≤ 2 years) |
| Stringent cGMP and ISO 13485 audits for sterility compliance | +1.8% | APAC, global | Medium term (2-4 years) |
| Shift toward single-use bioprocessing equipment | +1.6% | North America, EU, APAC | Medium term (2-4 years) |
| Rising bioreactor contamination events in cell & gene therapy facilities | +1.4% | North America, EU | Short term (≤ 2 years) |
| Microbiome-based therapeutics requiring ultra-low detection thresholds | +1.2% | North America, EU | Long term (≥ 4 years) |
| Adoption of continuous manufacturing | +1.0% | Global | Long term (≥ 4 years) |
| Source: Mordor Intelligence | |||
High Frequency of Product Recalls Driven by Rapid-Release Supply Chains
Recurring recalls underscore how speed-focused logistics can let contaminants slip through routine checks. FDA notices in 2024 for sulfamethoxazole/trimethoprim tablets and atovaquone suspensions illustrated the costly fallout of microbial lapses.[1]U.S. Food and Drug Administration, “Bionpharma Inc. Voluntary Recall of Atovaquone Oral Suspension,” fda.govManufacturers now view preventive testing as cheaper than multi-month shutdowns and brand damage. Generic drug makers with tight margins feel this pressure most, which lifts routine sampling volumes and positions the bioburden testing market as an essential quality gate.
Stringent cGMP & ISO 13485 Audits for Sterility Compliance
The 2024 US Quality Management System Regulation aligned domestic rules with ISO 13485, raising the bar for documentation and real-time monitoring.[2]U.S. Food and Drug Administration, “Quality Management System Regulation: Final Rule Amending the Quality System Regulation – Frequently Asked Questions,” fda.gov PIC/S Annex 1 revisions require continuous oversight rather than periodic checks. When Sanofi’s Massachusetts plant logged 20% rejected runs, regulators highlighted historic contamination rates, prompting peers to adopt automated alerts and audit-ready data trails. Such mandates expand instrument sales and software subscriptions across the bioburden testing market.
Shift Toward Single-Use Bioprocessing Equipment Boosting Test Volumes
Disposable bioreactors, filters, and connectors avoid the cleaning validations demanded by stainless-steel systems yet compel sterility proof for each lot. Thermo Fisher and Sartorius reported rising orders for single-use assemblies bundled with rapid detection kits. Every campaign therefore triggers additional lot-release tests, swelling consumable demand within the bioburden testing market.
Rising Bioreactor Contamination Events in Cell & Gene Therapy Facilities
Cell therapy batches worth millions can be lost to a single microbial intrusion that standard culture assays may not flag. Updated FDA viral-safety guidance stresses in-process checks and raw-material screening. Facilities now install continuous sensors that detect viable but non-culturable organisms, driving purchases of next-generation PCR and impedance platforms.
Restraints Impact Analysis*
| Restraint | (~) % Impact on CAGR Forecast | Geographic Relevance | Impact Timeline |
|---|---|---|---|
| High upfront cost of automated enumeration platforms | -1.5% | Emerging APAC, MEA | Short term (≤ 2 years) |
| Shortage of trained microbiologists | -1.2% | APAC, MEA | Medium term (2-4 years) |
| False-negative risk in rapid sterility assays | -0.9% | North America, EU | Medium term (2-4 years) |
| Supply bottlenecks for high-purity agar & reagents | -0.7% | Global | Short term (≤ 2 years) |
| Source: Mordor Intelligence | |||
High Upfront Cost of Automated Enumeration Platforms
Systems such as Rapid Micro Biosystems’ Growth Direct exceed USD 500,000, excluding validation outlays. Small generics plants struggle to amortize that spend, slowing instrument uptake despite clear efficiency gains. Financing hurdles are most acute in India, Indonesia, and parts of Africa where capital budgets remain tight.
Supply Bottlenecks for High-Purity Agar & Reagents
Shortfalls in BD BACTEC bottles and fetal bovine serum forced labs to ration consumables in 2024.[3]American Society for Microbiology, “Managing Blood Culture Bottle Shortages,” asm.org With few global agar suppliers, any disruption reverberates worldwide, lengthening lead times and elevating costs.
*Our forecasts treat driver/restraint impacts as directional, not additive. The impact forecasts reflect baseline growth, mix effects, and variable interactions.
Segment Analysis
By Product: Automation Drives Consumables Growth
Consumables posted the quickest revenue expansion, advancing at a 15.61% CAGR even though instruments still captured 62.95% of the bioburden testing market in 2025. Growth in single-use manufacturing pushes fresh culture media, filters, and rapid test kits into every production cycle, lifting volume demand. Automated identification instruments benefit from high-throughput cell and gene therapy pipelines that require swift, accurate readouts.
Disposable items now anchor contamination-prevention strategies because they eliminate cross-batch residue. Manufacturers intensify supplier audits to secure uninterrupted consumables flow, offsetting reagent bottlenecks. Meanwhile, AI-enabled imaging microscopes and PCR modules remain capital priorities for large plants aiming to reduce analyst touch time and boost data integrity across the bioburden testing market.


By Enumeration Method: Rapid Technologies Challenge Traditional Approaches
Plate count assays retained 39.22% of bioburden testing market share in 2025, yet rapid techniques are climbing at 13.89% CAGR on the back of real-time manufacturing needs. Flow cytometry and ATP bioluminescence deliver answers in hours, not days, aiding facilities that have adopted continuous lines.
Hybrid testing regimes now merge legacy culture plates for regulatory familiarity with fluorescence-based counts for speed. AI colony counters cut read time to 30 seconds while holding 95% accuracy. These efficiencies slash analyst bottlenecks and reinforce the bioburden testing market size outlook through 2031.
By Application: Environmental Monitoring Gains Regulatory Emphasis
In-process testing was the largest slice of bioburden testing market size at 34.45% during 2025. Nonetheless, environmental monitoring is on track for the fastest gains at 14.12% CAGR following the EU’s Annex 1 revisions.
Manufacturers extend air and surface sampling beyond cleanrooms into gowning, warehousing, and personnel zones. The bioMérieux 3P ENTERPRISE platform integrates automated sample capture with cloud analytics, offering audit-ready dashboards. Such end-to-end visibility strengthens contamination control and underpins long-term expansion for the bioburden testing market.
By End-User: CROs and CMOs Drive Outsourcing Trend
Pharma and biotech firms generated 49.12% of 2025 demand, yet outsourcing momentum positions CROs and CMOs for 15.19% CAGR growth through 2031. Cell therapy sponsors in particular lean on CDMOs to supply dedicated suites that meet ultra-low bioburden thresholds without incurring direct capital expense.
Academic labs assist in early-stage assay innovation, while medical-device makers request tailored protocols for implantables that cannot undergo terminal sterilization. Heightened specialization enlarges service backlogs, fueling sustained gains for the broader bioburden testing market.
Geography Analysis
North America led with 38.18% of global revenues in 2025 as FDA rule harmonization and a dense network of high-value biologics plants favored advanced detection investments. Canada and Mexico strengthen regional totals by upgrading facilities to US compliance levels, broadening customer bases for rapid enumeration suppliers.
Asia-Pacific is forecast to grow at 14.2% CAGR, propelled by China, India, South Korea, and Singapore. Rising GMP adherence and greater biologics capacity spark bulk orders for automated incubators, PCR kits, and disposable media packs. Public-private training initiatives aim to close microbiologist gaps, yet demand still outpaces talent supply across much of Southeast Asia, magnifying prospects for AI-assisted testing modules within the bioburden testing market.
Europe sustains expansion through strict Annex 1 enforcement that compels continuous facility monitoring. Germany, the United Kingdom, and France approve sizeable capital budgets for inline sensors and cloud data-management suites. Meanwhile, Middle East, Africa, and South America register incremental gains as generic-driven manufacturing hubs invest in basic plate-count capacity and gradually transition toward quicker molecular assays.

Competitive Landscape
The sector remains moderately fragmented. Becton Dickinson, Sartorius, Thermo Fisher Scientific, and bioMérieux offer integrated ecosystems that bundle instruments, media, and analytics, capturing about 42% of worldwide revenue. Rapid Micro Biosystems disrupts the field with fully automated culture detection that halves release times without altering compendial methods.
Strategic moves emphasize AI and machine learning. BD’s plan to spin off its Biosciences and Diagnostic Solutions arm into a USD 3.4 billion pure-play entity underscores focus on growth niches. Sartorius launched the Octet R8e system in May 2025, raising sensitivity benchmarks for real-time biomolecular interaction analysis.
White-space opportunities cluster around live biotherapeutic product assays, continuous manufacturing integrations, and underserved emerging markets. Suppliers that can deliver both hardware and validation consulting hold a competitive edge because end-users increasingly seek turnkey contamination-control programs rather than standalone tools. Market consolidation is expected as mid-tier players acquire niche software firms to bolster data integrity offerings.
Bioburden Testing Industry Leaders
Becton, Dickinson and Company
Charles River Laboratories Inc.
Merck KGaA
Thermo Fisher Scientific
bioMérieux SA
- *Disclaimer: Major Players sorted in no particular order

Recent Industry Developments
- May 2025: Sartorius introduced the Octet R8e biolayer interferometry system, providing high-sensitivity, real-time interaction analysis for cell and gene therapy QC.
- February 2025: BD announced plans to separate its Biosciences and Diagnostic Solutions business into an independent life-sciences company with USD 3.4 billion revenue.
- November 2024: bioMérieux released the 3P ENTERPRISE environmental monitoring suite, merging automated sampling with cloud-based incubation management.
- October 2024: Mérieux NutriSciences acquired Bureau Veritas’ food testing division for EUR 360 million, doubling its presences in Canada and Asia-Pacific and strengthening microbiological service depth.


Research Methodology Framework and Report Scope
Market Definitions and Key Coverage
Our study defines the bioburden testing market as the value generated by instruments and consumables that enumerate viable aerobic microorganisms present on raw materials, in-process samples, finished medical devices, and the surrounding clean-room environment before final sterilization. According to Mordor Intelligence, tests based on membrane filtration, plate count, rapid ATP or flow-cytometry, and most-probable-number techniques are included, whereas purely viral or endotoxin assays are excluded.
Scope exclusion: viral load, endotoxin, and pyrogen testing fall outside this study's boundaries.
Segmentation Overview
- By Product
- Instruments
- Automated Microbial Identification Systems
- Polymerase Chain Reaction (PCR) Systems
- Microscopes
- Other Instruments
- Consumables
- Culture Media & Reagents
- Other Consumables
- Instruments
- By Enumeration Method
- Membrane Filtration
- Plate Count Method
- Most Probable Number (MPN)
- Rapid/Alternative Methods (flow-cytometry, ATP)
- By Application
- Raw-Material Testing
- In-process (Bioprocess) Testing
- Finished Medical-Device Testing
- Equipment-Cleaning Validation
- Environmental Monitoring Swabs & RODAC plates
- By End-User
- Pharmaceutical & Biopharmaceutical Manufacturers
- Medical-Device Manufacturers
- Contract Research & Manufacturing Organizations (CROs/CMOs)
- Academic & Research Laboratories
- By Geography
- North America
- United States
- Canada
- Mexico
- Europe
- Germany
- United Kingdom
- France
- Italy
- Spain
- Rest of Europe
- Asia-Pacific
- China
- Japan
- India
- Australia
- South Korea
- Rest of Asia-Pacific
- Middle East and Africa
- GCC
- South Africa
- Rest of Middle East and Africa
- South America
- Brazil
- Argentina
- Rest of South America
- North America
Detailed Research Methodology and Data Validation
Primary Research
Interviews with quality-assurance directors, contract microbiology labs, and clean-room consultants across North America, Europe, and Asia helped us validate batch-level test penetration, method shift toward rapid kits, and average lot sizes. Online surveys of infection-control professionals supplemented pricing curves and consumable replenishment ratios, ensuring that assumptions mirror field realities.
Desk Research
We began with open regulatory repositories such as the US FDA Code of Federal Regulations, ISO 11737 parts 1 and 2, and EMA sterilization guidance, which clarify mandatory test frequencies and detection limits. Trade bodies like the Parenteral Drug Association and the Advanced Medical Technology Association supply adoption rates for rapid alternative methods. Statistical portals from the US Census Bureau, Eurostat, and Japan's METI provide production volumes for pharmaceuticals and single-use devices that anchor demand pools. Company 10-K filings, investor decks, and peer-reviewed papers indexed on PubMed enrich pricing and failure-rate assumptions. Select modules of D&B Hoovers and Dow Jones Factiva assisted us in verifying revenue splits for listed suppliers. This list is illustrative; several additional public and subscription sources were tapped for data checks and context enhancement.
Market-Sizing & Forecasting
A top-down and bottom-up blended model was adopted. Production and trade data for sterile injectables, implantable devices, and single-use bioprocess bags were converted into likely test volumes through penetration multipliers gathered during interviews, then multiplied by region-specific average selling prices. Supplier roll-ups and channel checks served as bottom-up reasonableness tests, with gaps bridged by midpoint adjustments. Key variables like annual sterile manufacturing output, regulatory recall rate, shift toward continuous bioprocessing, clean-room expansion square footage, and rapid-method adoption percentage drive the base year. A multivariate regression combined with scenario analysis projects 2025-2030 values, using GDP-linked healthcare spending and R&D intensity as leading indicators.
Data Validation & Update Cycle
Outputs pass three-layer scrutiny: automated variance scans, peer analyst review, and senior lead approval. Outliers trigger follow-back calls. Reports refresh each year, and material events such as major recalls prompt interim amendments so clients always receive the latest calibrated view.
Why Mordor's Bioburden Testing Baseline Commands Reliability
Published estimates often differ because each firm frames the market through its own lens and refreshes data on distinct schedules. Users can struggle to reconcile the spread without clarity on scope, variables, and currency treatment.
Key gap drivers arise when some publishers fold food pathogen kits into totals, apply uniform test counts per batch regardless of device class, or rely on historical exchange rates that inflate figures. Mordor's disciplined segmentation, annual currency rebasing, and interview-verified penetration ratios minimize such distortions.
Benchmark comparison
| Market Size | Anonymized source | Primary gap driver |
|---|---|---|
| USD 1.58 B (2025) | Mordor Intelligence | - |
| USD 1.64 B (2025) | Global Consultancy A | Includes food and beverage microbial kits and contract testing revenue, uses static 2022 FX rates |
| USD 0.89 B (2023) | Industry Tracker B | Excludes consumables, focuses on emerging markets only, conservative adoption multipliers |
The comparison shows that when scope overreaches or skews conservative, headline numbers swing widely. By anchoring volumes to audited production statistics and cross-checking with field experts, Mordor Intelligence delivers a balanced, transparent baseline that decision-makers can trace back to clear variables and repeatable steps.


Key Questions Answered in the Report
What is the current value of the bioburden testing market?
The market generated USD 1.78 billion in 2026 and is forecast to reach USD 3.26 billion by 2031.
Which segment contributes most to bioburden testing market size today?
Instruments account for 62.95% of 2025 revenue, reflecting sustained investment in automated identification and PCR platforms.
Why are rapid enumeration methods gaining popularity?
They shorten result times from days to hours, a critical need for continuous manufacturing lines that cannot afford lengthy hold periods.
Which region is expanding fastest in the bioburden testing market?
Asia-Pacific is projected to grow at a 14.2% CAGR through 2031 due to increased GMP compliance and biologics capacity.
Page last updated on:


