
Market Overview
| Study Period | 2022 - 2031 |
|---|---|
| Forecast Data Period | 2026 - 2031 |
| Historical Data Period | 2022 - 2024 |
| Growth Rate | 10.29 % |
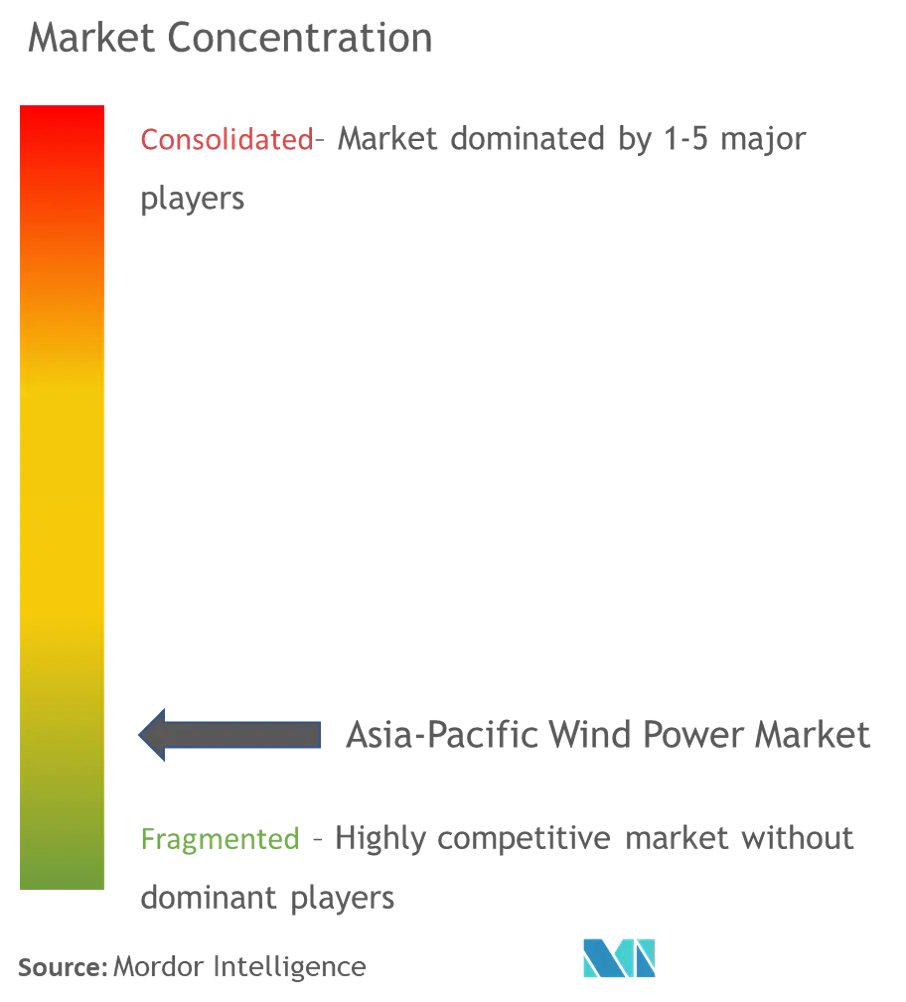
| Market Concentration | Low |
Major Players *Disclaimer: Major Players sorted in no particular order Image © Mordor Intelligence. Reuse requires attribution under CC BY 4.0. | |
Asia-Pacific Wind Power Market Analysis by Mordor Intelligence
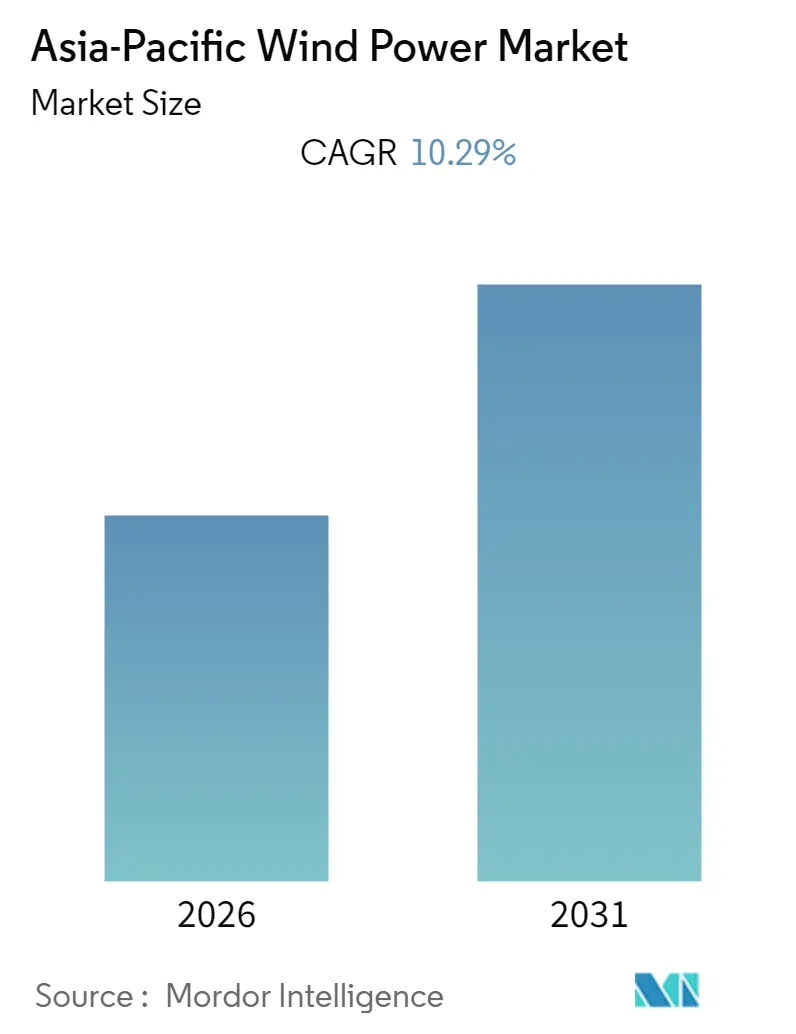
The Asia-Pacific Wind Power Market size is expected to register a CAGR of 10.29% during the forecast period.
The market didn't have any significant impact due to COVID-19 in 2020. Presently the market has now reached pre-pandemic levels.
- Over the long term, major factors attributing to the growth include favorable government policies, the increasing investment in wind power projects, and the reduced cost of wind energy, which led to increased adoption of wind energy, thereby positively contributing to the demand for wind energy.
- On the other note, the increasing adoption of alternate energy sources, such as gas-based power and solar power, is likely to hinder market growth.
- The technological advancements in efficiency and decrease in the production cost of offshore wind turbines are expected to create ample opportunity for the market players in Asia-Pacific.
- China dominates the wind power market and remains the largest onshore market with 21.2 GW of new capacity additions. The government policy and incentives made China a favorable hotspot for investment; therefore, the wind power market is expected to flourish in the coming years.
Note: Market size and forecast figures in this report are generated using Mordor Intelligence’s proprietary estimation framework, updated with the latest available data and insights as of 2026.
Asia-Pacific Wind Power Market Trends and Insights
Onshore Segment to Dominate the Market
- Over the last five years, onshore wind power generation technology evolved to maximize electricity produced per megawatt capacity installed to cover more sites with lower wind speeds. Besides this, in recent years, wind turbines have become larger with taller hub heights, broader diameters, and larger wind turbine blades.
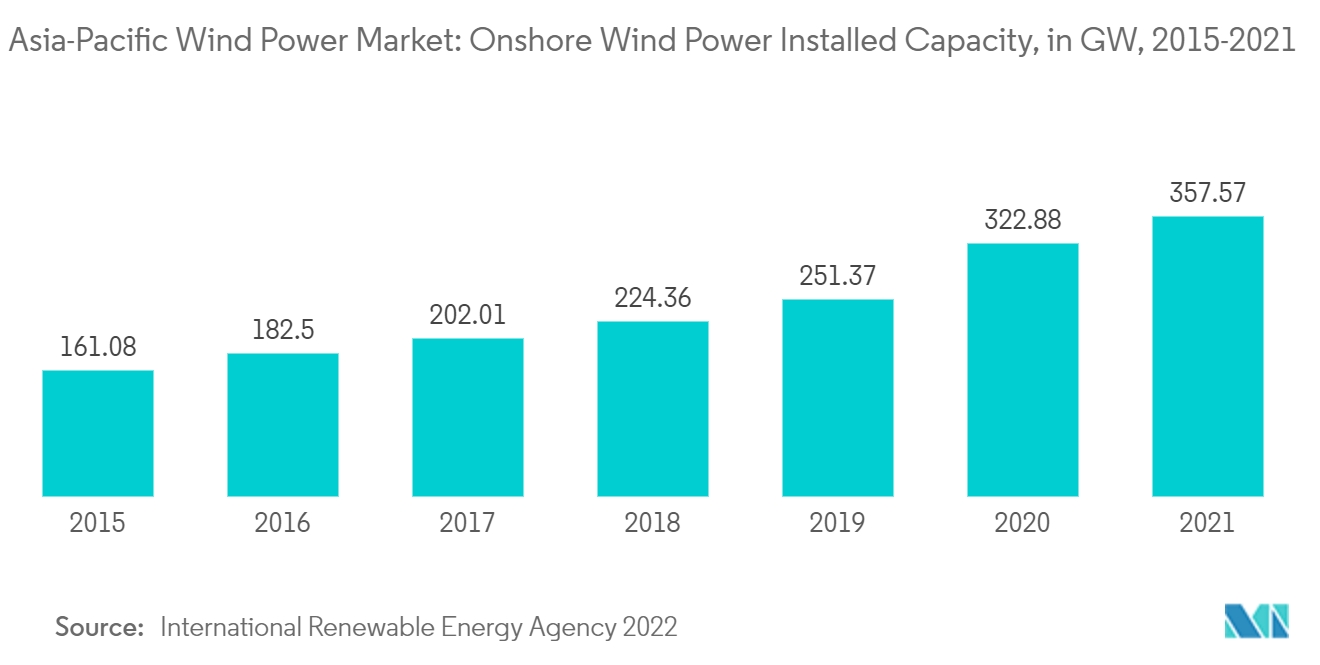
- In 2021, Asia reached 357.574 GW of onshore wind energy installations. New installations in Asia are likely to exceed 10 GW in 2026 and reach nearly 15 GW by 2030. By 2050, Asia is projected to increase new wind power installations by nine folds, totaling 613 GW of offshore and 2,646 GW of onshore wind power.
- Going ahead, China's northern regions have abundant onshore wind potential. The provinces of Qinghai, Xinjiang, Inner Mongolia, and the country's northeast have the highest power density (average values between 400 and 600 watts per square meter (W/ m²)), and most new onshore installations are expected to be deployed in these areas.
- Moreover, in November 2022, Vestas Wind Systems A/S won a 21 MW order with wpd AG in Taiwan that includes the supply of five V117-4.2 MW wind turbines with 91.5m towers in two wind projects. The order also includes a long-term service agreement for the wind farms to ensure optimized performance.
- Furthermore, in December 2022, TagEnergy, and Vestas has announced a partnership for delivering Engineering Procurement and Construction services for the first stage of Golden Plains Wind Power Plant, a 756 Megawatt project in Victoria, Australia. Upon completion, Vestas will deliver a 30-year service and maintenance agreement to optimize the project's energy production.
- From all these factors, it can be concluded that the onshore segment is expected to gain significant traction in the market in the coming years and is expected to be the fastest-growing segment.
China to Dominate the Market
- In China, nearly 70% of the electricity produced is from thermal sources of energy. Owing to the increasing pollution from thermal sources, the country has been making efforts to increase the share of cleaner and renewable sources in power generation.
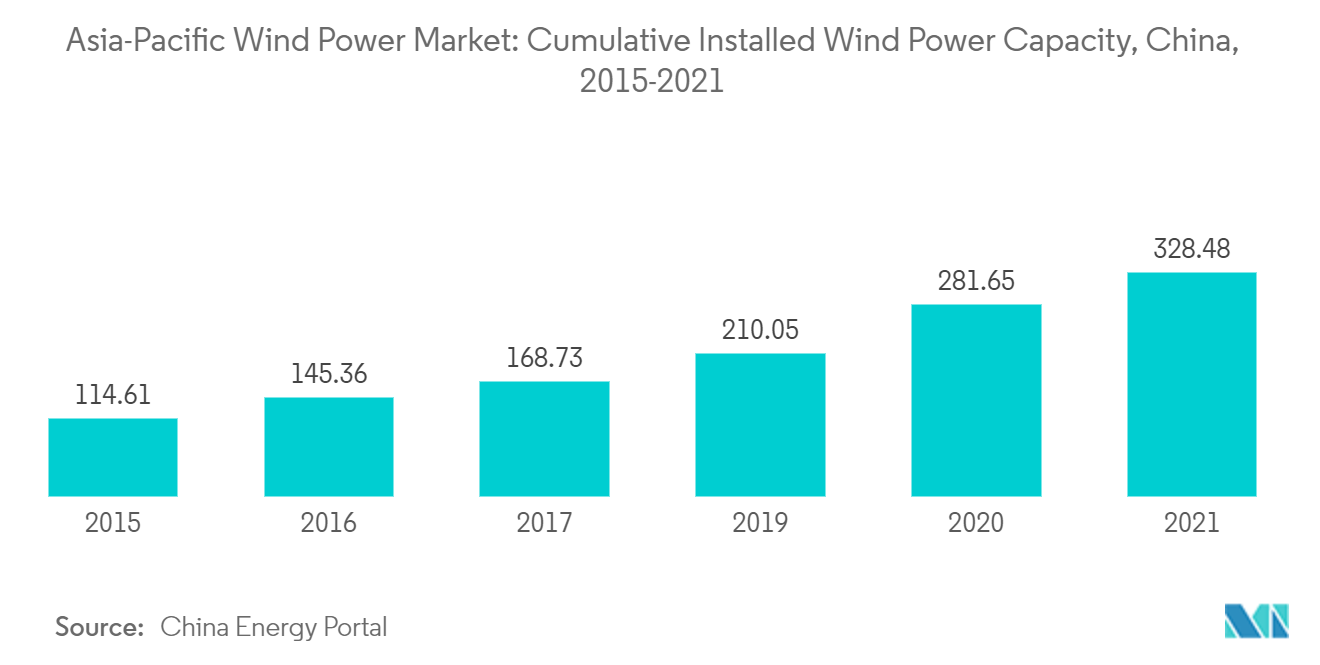
- According to China Energy Portal, during 2014-2021, China's total installed wind capacity registered a CAGR of 15.71%. As part of its 14th five-year plan (2021-2025), the country aims to supply 33% of national power consumption by 2025 and for non-hydro renewables to contribute 18%. Additionally, the country aims to increase renewable energy generation to 3,300 TWh by 2030.
- As of 2021, China had an installed wind power capacity of 328.48 gigawatts. Though the wind farms are in the country's wind-rich northern and western provinces, delays in grid connection and improper grid management continue to be the major issues.
- Moreover, in October 2022, the government of China announced its plan to construct the world's largest wind farm, a facility that could power the whole of Norway. Chaozhou - a city in China's Guangdong province, has revealed ambitious plans for a 43.3-gigawatt facility in the Taiwan Strait.
- Furthermore, In May 2022, China National Offshore Oil Corporation (CNOC) started construction of the offshore floating wind power platform at the construction site of CNOOC Qingdao in Hainan Province, China. The project will be developed by CNOOC Rongfeng Energy Co. Ltd, affiliated with the new energy branch of CNOOC Beijing, China.
- Owing to the above points, China is expected to dominate the Asia-Pacific Wind Energy Market during the forecast period.
Regulatory Landscape
Across Asia-Pacific, wind power regulation is increasingly focused on competitive procurement, clearer tariff-setting methods, and tighter grid-code compliance. Taiwan launched Round 3.3 of its offshore wind auction in April 2026, offering up to 3.6 GW, which reinforces the regionwide shift from legacy feed-in approaches toward auction-led capacity allocation and bankable offtake structures.
Regulators are also updating rules that affect project viability and grid integration. Japan revised its offshore wind Promotion Zone Designation Guideline, effective April 1, 2026. India entered a new control period under the Central Electricity Regulatory Commission (CERC) Renewable Energy Tariff Regulations 2024 (July 2024 to March 31, 2027), which sets out a framework for tariff determination. In Vietnam, the Ministry of Industry and Trade issued Circular 20/2026/TT-BCT (effective June 2, 2026) on avoided-cost tariff methodologies for small renewable plants and Circular 30/2026/TT-BCT (effective July 28, 2026) for price determination for BOT generation projects. Technical compliance is reinforced through standards such as China GB/T 19963.1-2021 for onshore wind farm grid connection, alongside IEC testing specifications used for grid-code assessment and performance measurement.
Value Chain Analysis
The Asia-Pacific wind value chain spans upstream raw materials (steel, resins, rare-earth permanent magnets), component manufacturing (blades, nacelles, gearboxes, generators, converters, towers, foundations), and midstream engineering and logistics (EPC, heavy transport, ports, installation vessels and cranes). Downstream work includes grid connection, commissioning, operations and maintenance, and end-of-life services. Offshore projects add specialized elements such as substations, submarine export and inter-array cables, and marine construction, where port readiness and installation capacity can become schedule-defining constraints.
Regional execution also points to both capability build-out and bottlenecks. Japan reached a milestone in March 2026 when J-POWER announced commercial operation of the 220 MW Kitakyushu Hibikinada Offshore Wind Farm, and Taiwan advanced the 1,022 MW Hai Long 3 project with first turbine installation in March 2026. At the same time, GWEC highlights concentration risk in 2024, with China accounting for 89% of onshore and 91% of offshore demand, and flags power converter supply as a tightening constraint for markets outside China starting in 2025 for onshore and immediately for offshore. These dynamics raise the value of localized manufacturing and services for converters, submarine cables, floating substructures, and nacelle assembly, while also increasing the focus on ports and grid-connection works to reduce reliance on cross-border supply chains.
Competitive Landscape
The Asia-Pacific Wind Power Market is moderately fragmented. Some of the key players (not in particular order) include Acciona Energia SA, Orsted AS, EDF SA, General Electric Company, and Siemens Gamesa Renewable Energy.
Asia-Pacific Wind Power Industry Leaders
-
Acciona Energia SA
-
Orsted AS
-
EDF SA
-
General Electric Company
-
Siemens Gamesa Renewable Energy
- *Disclaimer: Major Players sorted in no particular order
Market Opportunities and Future Outlook
Near-term opportunity in Asia-Pacific wind centers on turning policy frameworks and permitted pipelines into buildable projects by reducing execution friction in grid, ports, and local supply chains. Taiwan provides a procurement anchor through the Round 3.3 offshore wind auction launched in April 2026 (up to 3.6 GW), and the March 2026 first-turbine milestone at the 1,022 MW Hai Long 3 offshore wind project shows how pipeline approvals are moving into installation. Japan is also adjusting its offshore wind auction framework to place greater weight on sustainability and capability rather than pure lowest-price outcomes, which aligns procurement design with delivery needs.
A second opportunity involves scaling hybrid wind-plus-storage and large onshore parks as developers work around congestion and system balancing needs. TotalEnergies took final investment decision in April 2026 for the 1 GW Mirny onshore wind project in Kazakhstan that includes a 600 MWh BESS, highlighting commercial relevance of pairing wind with storage in the region. In Australia, utility-scale projects continue to progress through environmental and federal approval pathways, including state environmental approval in May 2026 for WestWind Energy's 1.5 GW Warracknabeal Energy Park in Victoria and federal approval in July 2026 for RWE's 1.1 GW Theodore Wind Farm in Queensland under the EPBC Act. Across emerging and established markets, supply chain localization gaps identified by GWEC and Carbon Trust, notably converters, cables, and offshore structures, create whitespace for component manufacturing, port services, and O&M platforms that can support higher installation rates and improved availability.
Recent Industry Developments
- June 2026: GE Vernova signed an agreement with Powerica Limited to supply 28 of its 3.8 MW-154m onshore wind turbines for the 100 MW Botad Wind Farm in Gujarat, India. The deal supports new onshore builds in a key state market and reflects an OEM focus on securing orders aligned with local certification and supply readiness.
- January 2026: Orsted completed installation of all 66 wind turbines for its 920 MW Greater Changhua 2b and 4 offshore wind project in Taiwan. The work moves the project from installation into commissioning and grid integration, reinforcing Taiwan's offshore execution track record and maintaining progress toward commercial operation.
- July 2024: India’s Central Electricity Regulatory Commission initiated the control period for the Renewable Energy Tariff Regulations 2024, applicable through March 31, 2027. The framework formalizes tariff-setting approaches for renewables including wind, improving bankability and procurement consistency for projects tied to regulated tariff determination.
Research Methodology Framework and Report Scope
Market Definition and Coverage
This market is defined as wind power capacity additions and installed base across Asia-Pacific, tracked in gigawatts, covering onshore and offshore wind projects that are grid-connected.
Scope exclusions: Captive off-grid micro-wind systems, electricity price and revenue from power sales, and unrelated renewable assets (such as solar and hydro) are excluded from sizing.
Segmentation Overview
- Location
- Onshore
- Offshore
- Geography
- China
- India
- Japan
- South Korea
- Australia
- Rest of Asia-Pacific
Data Sources, Market Sizing, and Validation
Desk Research
Desk research was used to set the factual base for capacity trends, policy context, and build schedules across Asia-Pacific. We mainly relied on public energy statistics and program documents, such as IRENA renewable capacity data, IEA country power and renewables indicators, national energy ministry and regulator dashboards, grid operator connection and dispatch updates, and customs trade statistics for wind-related equipment movements.
To make the dataset usable in a market model, project announcements and commissioning notes were cross-checked using company annual reports, investor presentations, and credible press coverage. In addition, a paid subscription database for company financials and a separate patent database were used selectively to validate supplier presence, manufacturing footprints, and technology direction without over-depending on any single source. These desk research sources are illustrative, and many other public references were reviewed for data collection, validation, and clarification.
Primary Interviews and Surveys
Primary work focused on validating what gets commissioned versus announced, and how quickly projects move from permitting to grid connection. We spoke with developers, turbine and component suppliers, EPC firms, and grid and policy stakeholders across key Asia-Pacific markets so that country-level assumptions could be confirmed, and remaining gaps could be closed with practical checks on build timing and connection readiness.
Distribution of primary research fieldwork respondents
| Company type | Respondent position |
|---|---|
| Top tier: 26% | CXOs: 14% |
| Mid tier: 56% | Functional/Unit leaders: 42% |
| Smaller Players: 18% | Managers: 44% |
Market-Sizing & Forecasting
Sizing is built using a top-down method where country capacity additions are reconstructed from published installation, permitting, and grid-connection series, and then rolled up to an Asia-Pacific total in GW. To keep the totals realistic, results are corroborated with selective bottom-up approximations, including sampled project pipelines converted to expected commissioning, supplier shipment direction checks, and average turbine MW rating by country to translate unit activity into GW.
Key inputs used in the model include annual new installations, cumulative installed capacity, announced offshore auction volumes, typical lead times from award to commissioning, average turbine MW rating trends, and curtailment or grid readiness signals that can delay commissioning. Forecasting is done using scenario analysis supported by regression checks on variables like policy targets, tender calendars, and historical build rates, then adjusted through expert consensus gathered in interviews. When bottom-up signals are incomplete for smaller countries, the gap is handled using proxy indicators like tender volumes and historical share-of-region patterns, followed by a reasonableness check against known grid expansion plans.
Data Validation & Update Cycle
Validation is done by checking the modeled GW totals against independent signals like regional renewable capacity totals, country commissioning trackers, and known auction schedules that imply near-term build. Any outliers are reviewed, and we re-check assumptions when a country shows sudden jumps that do not match permitting or grid connection progress.
Before sign-off, the model and narrative go through multi-step analyst reviews, including variance checks across years and consistency checks between onshore and offshore totals. Reports are refreshed annually, and interim updates are triggered when material events occur, such as large auction policy changes, grid constraints, or major project delays. Before delivery, a final pass is completed so clients receive the most recent view available.
Mordor Intelligence's Asia Pacific Wind Power Market Size Versus Other Published Estimates
Published market sizes for Asia-Pacific wind power can look far apart because some sources talk in USD value terms, and others report the market as installed capacity, which changes what gets counted and how growth is described. Differences also come from whether the number is tied to new installations for a year, total installed base, or a mix of development, construction, and operations activity.
A common gap driver is scope, since some estimates fold in project capex and service spending and then apply assumed cost curves and currency timing across many countries. Those broader USD totals can move quickly when turbine pricing or offshore capex shifts, but the Mordor Intelligence figure is expressed as gigawatts of installed capacity, limited to onshore and offshore wind and anchored on commissioning and grid-connection evidence.
Benchmark comparison
| Source | Market Size | Gaps in Research Methodology |
|---|---|---|
| Mordor Intelligence | USD 0.00 B (2024) | |
| Regional Consultancy A | USD 46.50 B (2024) | Uses a USD spend-based definition that can include project development, installation, and operations activity, so totals rise or fall with capex assumptions and currency conversion timing rather than only commissioned capacity. |
| Industry Publisher B | USD 35.37 B (2024) | Focuses on wind turbines as products, which can capture equipment sales value but may exclude balance-of-plant and may not align to the same commissioning calendar used for capacity tracking. |
The comparison shows that the spread is mainly created by what is being measured, with capacity in GW on one side and revenue in USD on the other side. When the goal is to understand build momentum and country contribution, the capacity-based view stays traceable to installations, project timelines, and grid connection checks, which also makes year-to-year validation simpler for users.
Key Questions Answered in the Report
What is the current Asia-Pacific Wind Power Market size?
The Asia-Pacific Wind Power Market is projected to register a CAGR of 10.29% during the forecast period (2026-2031)
Who are the key players in Asia-Pacific Wind Power Market?
Acciona Energia SA, Orsted AS, EDF SA, General Electric Company and Siemens Gamesa Renewable Energy are the major companies operating in the Asia-Pacific Wind Power Market.
What years does this Asia-Pacific Wind Power Market cover?
The report covers the Asia-Pacific Wind Power Market historical market size for years: 2021, 2022, 2023, 2024 and 2025. The report also forecasts the Asia-Pacific Wind Power Market size for years: 2026, 2027, 2028, 2029, 2030 and 2031.