
Market Overview
| Study Period | 2021 - 2031 |
|---|---|
| Forecast Data Period | 2026 - 2031 |
| Base Year Market Size (2025) | 1.60 gigawatt |
| Market Volume (2026) | 1.71 gigawatt |
| Market Volume (2031) | 2.37 gigawatt |
| Growth Rate (2026 - 2031) | 6.82 % |
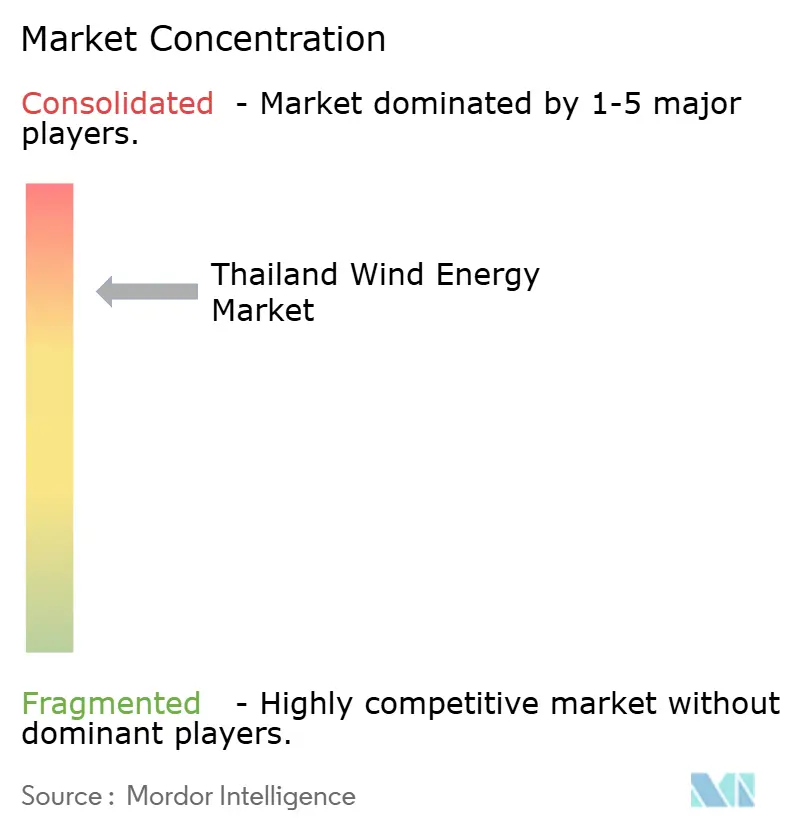
| Market Concentration | High |
Major Players
*Disclaimer: Major Players sorted in no particular order Image © Mordor Intelligence. Reuse requires attribution under CC BY 4.0. |
|
Thailand Wind Energy Market Analysis by Mordor Intelligence
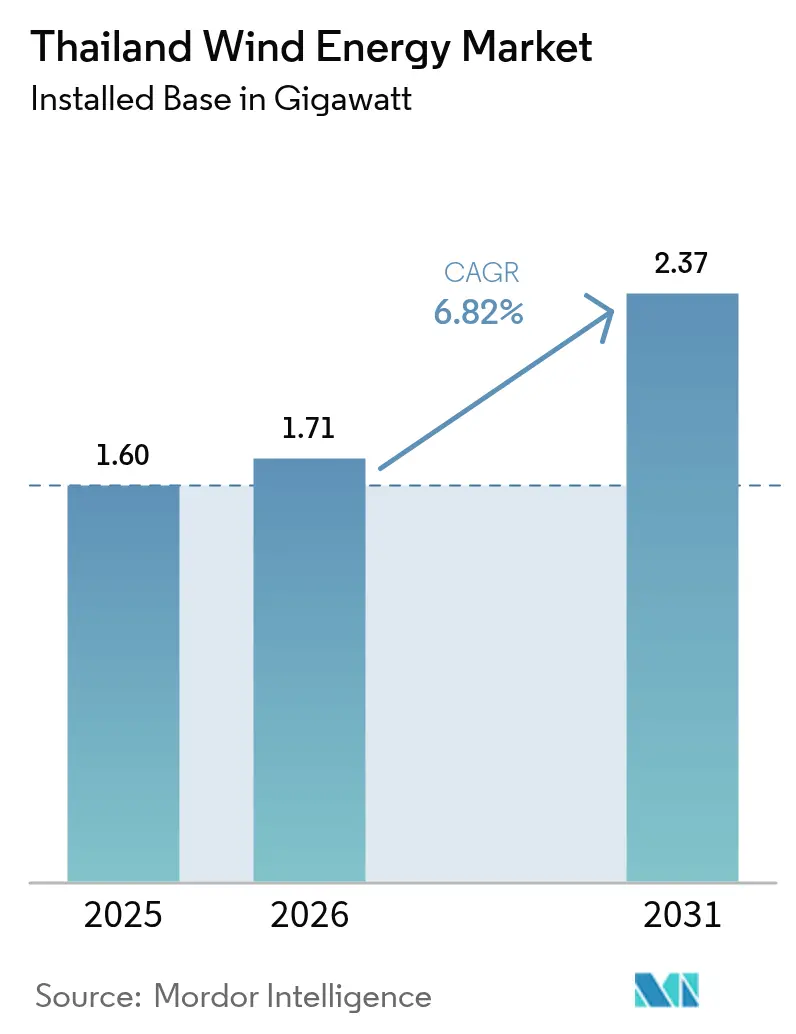
The Thailand Wind Energy Market size is expected to grow from 1.60 gigawatt in 2025 to 1.71 gigawatt in 2026 and is forecast to reach 2.37 gigawatt by 2031 at 6.82% CAGR over 2026-2031.
Growth is policy-led rather than resource-rich because national average wind speeds remain low, yet the Power Development Plan 2024 obliges utilities to lift renewable electricity to 51% by 2037. Feed-in tariffs of THB 3.10 per kWh for 25 years, together with a phase-two auction that earmarks 600 MW for wind, keep investor interest alive even though wind competes head-to-head with cheaper solar capacity. Independent power producers led by Energy Absolute, Gulf Energy, and BCPG dominate the pipeline but channel triple the capital toward solar, signaling that subsidy continuity and assured grid access will dictate wind additions. Chinese turbine suppliers such as Goldwind and Envision have swept recent orders, improving cost curves yet magnifying currency-risk exposure for Thai developers.
Key Report Takeaways
- By location, onshore installations retained a 100.00% Thailand wind energy market share in 2025; onshore capacity is forecast to compound at a 6.85% CAGR through 2031.
- By turbine capacity, units up to 3 MW captured 79.90% of Thailand's wind energy market size in 2025, while the 3-6 MW class is set to expand at a 14.21% CAGR to 2031.
- By application, utility-scale plants held 90.15% of the Thailand wind energy market share in 2025 and are advancing at a 9.25% CAGR over the same period.
- Northeastern provinces accounted for roughly 84.20% of total installations in 2025 and are expected to keep at least a 70.00% stake in cumulative additions to 2031.
- Five Thai conglomerates, Energy Absolute, Gulf Energy, EGCO, BCPG, and PTT, controlled more than 70% of operational and planned megawatts in 2024.
Note: Market size and forecast figures in this report are generated using Mordor Intelligence’s proprietary estimation framework, updated with the latest available data and insights as of 2026.
Thailand Wind Energy Market Trends and Insights
Drivers Impact Analysis*
| Driver | (~) % Impact on CAGR Forecast | Geographic Relevance | Impact Timeline |
|---|---|---|---|
| Government renewable capacity targets to 2036 | +1.5% | Nationwide, concentrated in northeastern provinces | Long term (≥ 4 years) |
| Competitive FiT and auction schemes | +1.2% | Nationwide | Medium term (2-4 years) |
| Falling LCOE from larger turbines | +0.8% | Nationwide, repowering sites in the northeast | Medium term (2-4 years) |
| Corporate REC demand and green PPAs | +0.7% | Industrial clusters in Rayong, Chonburi, Samut Prakan | Short term (≤ 2 years) |
| Offshore resource mapping | +0.3% | Northern and southern Gulf of Thailand | Long term (≥ 4 years) |
| EGAT wind-hydrogen hybrid pilots | +0.2% | Pilot sites in Nakhon Ratchasima, wider northeast | Long term (≥ 4 years) |
| Source: Mordor Intelligence | |||
Government Renewable Capacity Targets to 2036
The Power Development Plan 2024 mandates 5.345 GW of cumulative wind additions by 2037, tripling the present fleet and positioning wind behind solar as the grid’s second-largest renewable source.[1]Ministry of Energy Thailand, “Power Development Plan 2024,” energy.go.th Reducing dependence on imported liquefied natural gas underpins the policy, yet average site wind speeds of 2.8–4.0 m/s at 10 m hub heights demand tall turbines, inflating capex. Maintaining the THB 3.10 tariff through 2030 shields returns, and the September 2024 auction drew 12 bidders chasing 600 MW, underscoring confidence despite sub-30% capacity factors. Streamlined environmental reviews now close within 12 months for ≤90 MW projects, helping developers halve pre-construction time. The International Energy Agency lifted Thailand’s renewable forecast by 26% in 2024, chiefly on stronger wind delivery signals.
Competitive FiT / Auction Schemes Attracting IPP Capital
A two-track incentive, feed-in tariffs for sub-10 MW plants and auctions for larger arrays, mobilized THB 80 billion in committed wind outlays since 2022. The 25-year tariff stands 40% above wholesale prices, enabling IPPs to secure low-cost multilateral debt; for instance, the Asian Development Bank syndicated USD 820 million to Gulf Energy in November 2024.[2]Asian Development Bank, “Thailand Wind Atlas,” adb.org Auction caps of 90 MW curb market dominance, yet joint ventures allow scale, as shown by Gulf’s 208 MW tie-up with Alpha Energy announced in September 2025. Non-firm dispatch clauses clip realized tariffs during solar midday peaks, trimming payouts by nearly 15 %. Ongoing litigation over bid scoring indicates investor sensitivity to transparent oversight.
Falling LCOE from Larger Turbines & Supply-Chain Scale
Levelized cost dropped from USD 0.095 /kWh in 2020 to USD 0.070 /kWh in 2024 for projects employing 3-6 MW machines at 80 m hub heights. Goldwind’s 286 MW order at roughly USD 0.85 million per MW underscores how Chinese makers underprice European rivals by 20 %. A 5 MW turbine with a 160 m rotor yields 35 % more annual energy than a 2.5 MW unit at identical sites, cutting cost per megawatt-hour by one-quarter.[3]International Renewable Energy Agency, “Renewable Cost Database 2024,” irena.org Acciona Energía’s 436 MW pipeline indicates that international developers accept Thailand’s resource if towers top 100 m. Importing 120 m towers from Vietnam or China adds about 12 % to logistics bills, limiting further cost relief.
Corporate REC Demand & Green-PPA Boom
The Third Party Access framework, launched in March 2025, opened 2 GW for direct corporate PPAs, driving demand from export-oriented manufacturers in the Eastern Economic Corridor.[4]Energy Regulatory Commission, “Renewable Auction Rules,” erc.or.th Wheeling charges of THB 1.07 per kWh inflate delivered tariffs, yet firms such as PTT Global Chemical accept 10-year contracts at THB 3.50 per kWh to secure renewable-energy certificates. Wind’s evening output profile balances solar, letting plants meet night-shift sustainability targets. Energy Absolute’s 50 MW bilateral deal in 2024 proved tariff headroom despite the wheeling premium. Mandatory 30% renewable procurement for state-owned entities by 2030 could triple REC demand within five years.
Restraints Impact Analysis*
| Restraint | (~) % Impact on CAGR Forecast | Geographic Relevance | Impact Timeline |
|---|---|---|---|
| Low average on-shore wind speed zones | -1.2% | Central Plains, Southern coast | Long term (≥ 4 years) |
| Rural grid bottlenecks and curtailment risk | -0.8% | Nakhon Ratchasima, Chaiyaphum, Khon Kaen | Medium term (2-4 years) |
| Community land-use opposition | -0.5% | Chaiyaphum, Nakhon Ratchasima, Nakhon Si Thammarat | Short term (≤ 2 years) |
| Thin local component base | -0.4% | Nationwide | Medium term (2-4 years) |
| Source: Mordor Intelligence | |||
Low Average On-Shore Wind Speed Zones
National mean winds of 2.8–4.0 m/s at 10 m classify most sites as Wind Class 1, forcing 100 m hub heights and lifting capex by nearly 18% versus Class 3 sites in Vietnam. Capacity factors averaged 28 % in 2024, roughly 1,400 full-load hours below the global norm; hence, the Thailand wind energy market relies on tariffs 30 % above peers to attain 10–11 % equity returns. Central and southern zones exhibit sub-5 m/s winds even at 80 m, explaining why 85 % of projects cluster in the northeast. Ember’s 2024 review noted wind’s LCOE still trails solar’s by at least 25 % under Thai conditions.
Rural Grid Bottlenecks & Curtailment Risk
Northeastern 115 kV substations hit evening limits in 2024, curbing about 12 % of potential wind output. A THB 50 billion upgrade plan runs to 2029, leaving a near-term dispatch squeeze.[5]Provincial Electricity Authority, “Grid Status Report 2024,” pea.co.th Non-firm PPAs empower EGAT to curtail wind during solar peaks without compensation, cutting realized tariffs to THB 2.65 /kWh. Storage uptake is scant, with <200 MWh installed nationally, magnifying curtailment risk.
*Our forecasts treat driver/restraint impacts as directional, not additive. The impact forecasts reflect baseline growth, mix effects, and variable interactions.
Segment Analysis
By Location: Onshore Monopoly Persists as Offshore Awaits Economics
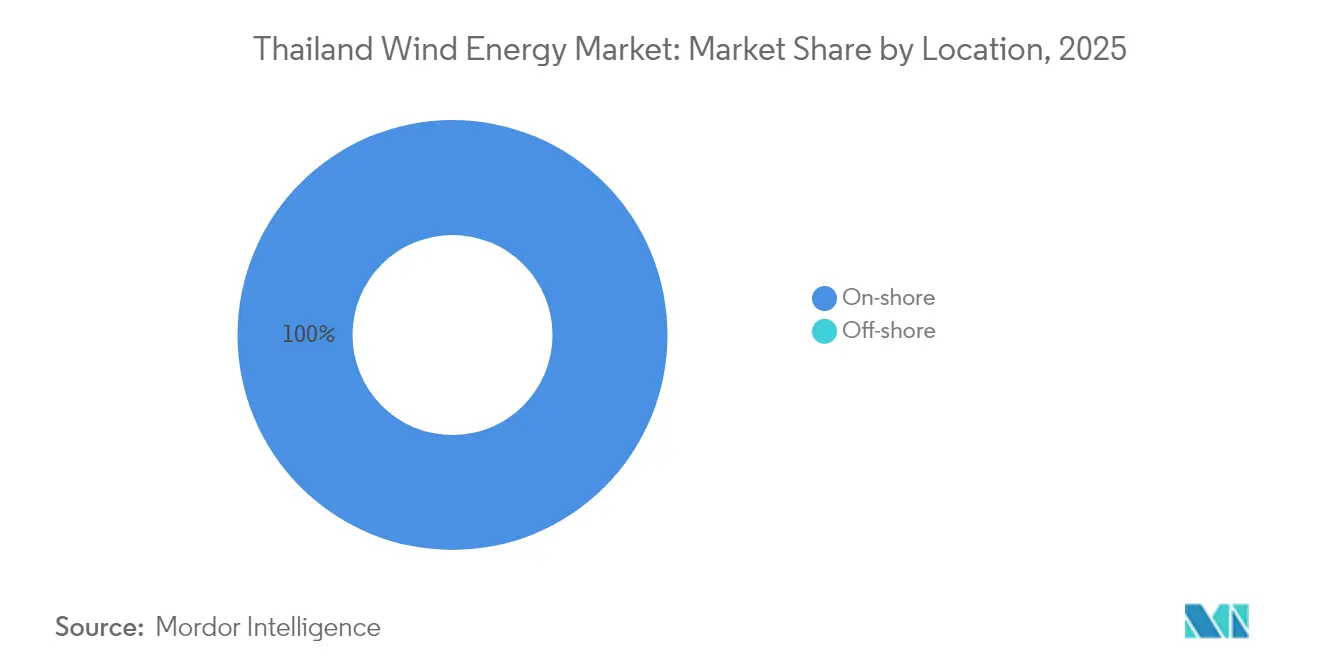
Onshore assets represented the entire Thailand wind energy market size of 1.60 GW in 2025, and onshore additions are slated to grow 6.85% CAGR to 2031 under the 600 MW second-phase auction. Offshore resource studies show 5.5–6.0 m/s winds in 50–80 m waters, but breakeven tariffs exceed THB 5.00 /kWh, well above current policy support. Northeastern onshore sites lie near 115 kV lines, keeping grid-tie costs at THB 8 million /MW compared with THB 25 million /MW for subsea cables. Acciona Energía’s 436 MW commitment underscores sustained developer preference for land-based projects that clear USD 0.070 /kWh LCOE at 80 m hub heights.
Developers anticipate a 200 MW offshore pilot in 2027, yet commercial deployment will likely trail the forecast window because floating foundations add USD 1.2 million /MW. Consequently, onshore capacity should still control at least a 94.75% Thailand wind energy market share by 2031 while offshore remains a policy aspiration.



By Turbine Capacity: Repowering Wave Shifts Fleet to Mid-Range Machines
Units ≤3 MW held 79.90% of Thailand's wind energy market share in 2025, reflecting early-2010s builds constrained by 90 MW contract caps. The 3-6 MW class is poised for 14.21% CAGR because larger rotors improve energy capture in 6 m/s wind regimes, driving LCOE down to roughly USD 0.070 /kWh. Goldwind's 286 MW supply deal confirms Chinese OEM pricing at 0.85 million USD /MW, 20 % below European quotes.
Turbines above 6 MW face logistical limits because blade lengths above 75 m exceed rural-road clearances, and 90 MW PPA caps curb unit counts, trimming economies of scale. Until rules evolve, mid-range machines will dominate new-build decisions, pushing the ≤3 MW fleet toward 59.25% of cumulative installed base by 2031 as repowering progresses.
By Application: Utility-Scale Dominance Reflects PPA Certainty
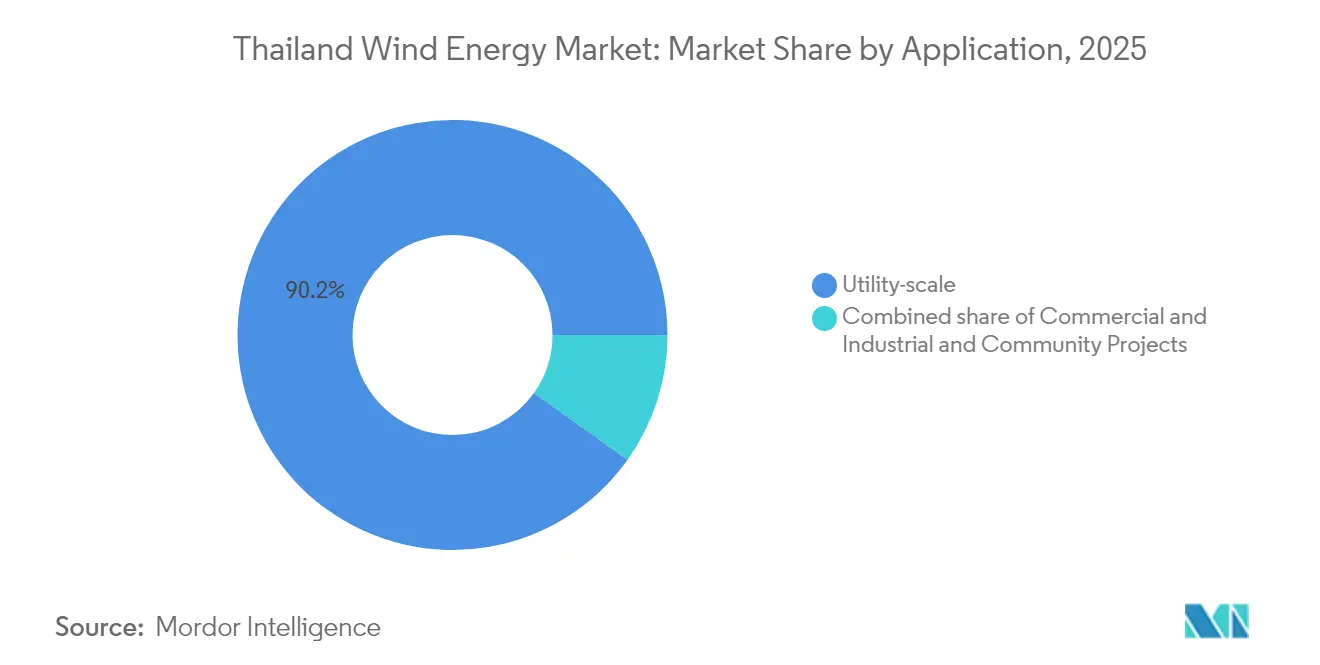
Utility-scale plants accounted for 90.15% of the Thailand wind energy market size in 2025, protected by 25-year EGAT PPAs that lock 4.5–5.5 % debt costs. Commercial–industrial projects formed about 8.35 % and battle wheeling fees of THB 1.07 /kWh, inflating delivered power by 35%. Community ventures remain niche at <20 MW, hamstrung by funding gaps despite a proposed THB 5 billion loan facility.
Utility-scale additions will keep a 9.25% CAGR through 2031 on the back of the 600 MW auction, whereas commercial buyers will selectively sign PPAs where evening wind output dovetails with production shifts. Community capacity could rise toward 86 MW by 2031, but will stay below 2.90 % Thailand's wind energy market share.
Geography Analysis
Wind development is heaviest in the northeastern provinces of Nakhon Ratchasima and Chaiyaphum, where average hub-height winds exceed 6 m/s and accessible ridgelines simplify crane operations. These two provinces alone host most commissioned capacity and pending licenses, underscoring their strategic significance within the Thailand wind energy market. Streamlined zoning and established service roads shorten construction cycles, although recent court-mandated reviews of agricultural-land leases create procedural delays.
Southern coastal provinces such as Nakhon Si Thammarat and Songkhla present the next frontier, with lidar studies confirming 1,374 MW of technical on-shore potential. Their proximity to petrochemical clusters offers embedded demand and short delivery corridors, which support offtake agreements with refinery and export-manufacturing tenants. Transmission expansion plans scheduled for completion by 2028 will allow bulk power transfers northward, extending market reach beyond provincial boundaries.
Central and western regions exhibit weaker wind regimes, generally below 5 m/s at 80 meters, limiting immediate commercial viability. Land-use conflicts also arise from dense agriculture and urban growth, prompting many developers to pivot toward rooftop solar in those zones. Nevertheless, industrial buyers around Bangkok still contract wind output aggregated from distant provinces through the emerging direct-purchase framework. This virtual offtake mechanism means all regions ultimately influence energy flows and price discovery across the Thailand wind energy market.
Regulatory Landscape
Thailand's wind power development is governed by the Energy Regulatory Commission (ERC) under the Energy Industry Act B.E. 2550 (2007), covering generation licensing, tariff administration, and power purchasing rules. The Power Development Plan 2024 (PDP 2024), led by the Ministry of Energy and EPPO, sets a system-level direction to raise renewables to 51% of electricity generation by 2037 and allocates 5,345 MW of new wind capacity through 2037, reinforcing the policy-led nature of the market despite modest wind resources.
Procurement continues to run through the 2022-2030 feed-in tariff (FiT) framework for non-fuel-based renewables, combining FiT support and competitive selection for larger projects. On 6 May 2025, the National Energy Policy Council (NEPC) directed the ERC and state utilities to negotiate terms for 3,668.5 MW of additional renewable capacity, and the ERC updated PPA execution timelines (effective 2025) to help projects meet 2026 scheduled COD windows. In parallel, Thailand's taxonomy criteria now include wind electricity generation (ISIC 3510), providing a clearer classification for sustainable finance screening tied to national climate mitigation objectives.
Competitive Landscape
Project ownership remains highly concentrated. Wind Energy Holdings controls more than 92% of operating capacity after assembling early concessions, providing it with sizeable economies of scale in procurement and maintenance. The company secures multi-year turbine supply and service packages with leading OEMs, locking in favorable pricing and technical support that smaller entrants struggle to match.
Competition intensifies as diversified Thai utilities and international developers vie for upcoming auction blocks. Firms such as EGCO, Gulf Energy Development, and BCPG leverage multi-technology portfolios to bid competitively, blending wind with solar or storage for grid-service premiums. Foreign groups, notably BayWa r.e., apply global balance-sheet strength and advanced resource modeling to secure Very Small Power Producer licenses, injecting fresh engineering standards into the Thailand wind energy industry.
Technology partnerships form a second arena of rivalry. OEMs, including Vestas, Siemens Gamesa, and GE Vernova, compete on availability guarantees, component localization, and digital monitoring platforms. Developers increasingly weigh total system cost over headline turbine price, valuing predictive maintenance and energy-yield analytics that lift lifecycle returns. As auctions turn on levelized cost metrics, these service-centric differentiators are likely to influence market share re-distribution after 2027, reshaping competitive dynamics within the Thailand wind energy market.
Thailand Wind Energy Industry Leaders
-
Energy Absolute PCL
-
Electricity Generating PCL
-
Wind Energy Holding Co Ltd
-
Gulf Energy Development PCL
-
BCPG PCL
- *Disclaimer: Major Players sorted in no particular order

Market Opportunities and Future Outlook
Policy execution under PDP 2024 creates clear whitespace for developers that can secure grid access in the northeast, where most buildable onshore wind sites and interconnection capacity constraints coincide. The government procurement stack (25-year PPAs and the 2022-2030 FiT framework at about THB 3.1014/kWh) supports bankable contracting structures, while ERC adjustments to PPA timelines for 2026 SCOD cohorts address one of the practical delivery bottlenecks that has slowed conversion from awards to COD.
Beyond utility procurement, direct corporate demand is a growing route to market where offtakers value non-solar generation profiles for evening and night operations, particularly in industrial clusters. The broader policy shift toward a longer-horizon planning framework, including the transition from the prior 20-year plan toward a 25-year roadmap (2026-2050) aligned with the Carbon Neutrality 2050 direction, strengthens the case for long-duration development pipelines and repowering strategies rather than single-project execution. With wind development concentrated in transmission-sensitive provinces, opportunities also extend to grid-constrained solutions and execution partners (engineering oversight, construction logistics, and performance optimization) that help projects clear interconnection queues and operate under non-firm dispatch conditions.
Recent Industry Developments
- June 2026: ERC released updated PPA execution timelines to streamline COD for 2026 cohorts, aligning with ongoing policy support to expand wind capacity within the FiT and auction frameworks.
- May 2026: AFRY appointed as owner's engineer for four onshore wind projects totaling 286 MW developed by Gulf Energy Development across Chumphon, Prachuap Khiri Khan, Mukdahan, and Chaiyaphum, signaling multi-site portfolio execution and risk mitigation through international engineering oversight.
- December 2024: Gunkul Engineering won 319 MW of new capacity awards, including four wind farms totaling 284 MW under FiT allocations, reinforcing pipeline visibility and competition for interconnection capacity in core provinces.


Research Methodology Framework and Report Scope
Market Definition and Coverage
For this methodology, the Thailand wind energy market is defined as installed wind power capacity that is commissioned and operating in Thailand, measured in gigawatts, across onshore and offshore projects and common turbine capacity bands.
Scope exclusions: We exclude pure wind resource mapping studies and policy targets that are not yet translated into commissioned capacity.
Segmentation Overview
-
By Location
- Onshore
- Offshore
-
By Turbine Capacity
- Up to 3 MW
- 3 to 6 MW
- Above 6 MW
-
By Application
- Utility-scale
- Commercial and Industrial
- Community Projects
-
By Component (Qualitative Analysis)
- Nacelle/Turbine
- Blade
- Tower
- Generator and Gearbox
- Balance-of-System
Data Sources, Market Sizing, and Validation
Desk Research
Desk research was used to map the operating asset base and the credible project pipeline, so the model begins with what is online and then extends using projects with clear milestones. We referenced public sources such as Thailand energy ministry and regulator releases, national utility and grid operator disclosures, and global energy agencies that track renewable capacity additions.
To keep assumptions grounded, we also reviewed sources such as International Renewable Energy Agency (IRENA) statistics, International Energy Agency electricity and renewables datasets, World Bank macro and electricity access indicators, and UN Comtrade customs trade data for major wind equipment categories. Academic and engineering journals were used to understand wind resource conditions, typical turbine sizing, and grid integration constraints in Thailand. We also checked company annual reports, investor presentations, and reputable press to validate commissioning dates and cancellations. For cross-checks, paid subscriptions for company financials and news intelligence, plus patent databases, were used selectively to confirm corporate activity and project timelines. These examples are not exhaustive and many other public sources were also used for collection, validation, and clarification.
Primary Interviews and Surveys
Primary work focused on developers, EPC and O&M participants, grid-facing stakeholders, and large power buyers, so timing and capacity assumptions could be checked against on-the-ground constraints. Interviews were also used to confirm turbine capacity trends, likely siting limits, and how permitting and grid connection conditions are affecting the pace of new wind capacity in Thailand.
Distribution of primary research fieldwork respondents
| Company type | Respondent position |
|---|---|
| Top tier: 35% | CXOs: 21% |
| Mid tier: 43% | Functional/Unit leaders: 25% |
| Smaller Players: 22% | Managers: 54% |
Market-Sizing & Forecasting
Sizing starts with a top-down reconstruction of Thailand wind installed capacity by year, built from commissioning records, official power sector disclosures, and publicly tracked project lists, and then adjusted for retirements and repowering where evidence exists. The totals are then corroborated with selective bottom-up approximations, such as rolling up a sample of operating projects and using typical turbine nameplate ratings to sanity check the national capacity line.
A few market fingerprints were treated as key inputs, including annual capacity additions (MW), expected commissioning dates for permitted projects, typical turbine capacity bands used in recent builds, grid connection readiness, and curtailment or resource-quality signals that can affect build pace. Forecasts were produced using scenario analysis, where the base case is anchored on projects already under development and then tuned with expert consensus on likely delays. Where project detail was incomplete, gaps were handled by applying conservative timing and sizing assumptions that are consistent with observed build patterns, and then rechecked through follow-up calls when needed.
Data Validation & Update Cycle
Outputs were checked against independent signals, such as whether implied annual additions align with known procurement rounds, grid connection readiness, and recent capacity history. Any sharp jumps were reviewed at the project level, and if the driver was not clear, we re-contacted sources to confirm commissioning changes.
Before sign-off, the model goes through multi-step reviews so unit consistency, definitions, and arithmetic checks are cleared. Reports refresh annually, with interim updates when material events occur, such as large auctions, project cancellations, or policy changes that affect wind additions. Right before delivery, an analyst performs a fresh pass so clients receive the latest updated view.
Mordor Intelligence's Thailand Wind Energy Market Size Measured Against Other Published Estimates
Published estimates for Thailand wind energy often diverge because the term market is used in different ways and the unit of measurement is not always consistent. Some sources publish installed capacity, others publish revenue across project development and equipment, and a few also mix in forward targets as if they are already realized.
Key gaps usually come from scope and timing details, like whether offshore is included in a market that is still mainly onshore, and whether delayed grid connections are treated as commissioned capacity. Differences can also show up from how currency conversion timing is applied and whether the latest year is refreshed after major project updates.
Benchmark comparison
| Source | Market Size | Gaps in Research Methodology |
|---|---|---|
| Mordor Intelligence | USD 1.60 B (2025) | |
| Industry Publisher A | USD 1.47 B (2026) | Reported in revenue terms and typically covers a wider activity set, including equipment and installation spending, which does not translate directly into installed capacity in a given year. |
| Trade Brief B | USD 1.50 B (2024) | Presented as current scale using public commentary on the operating wind fleet, but it can blend capacity references with generation-share narratives without a consistent year-end capacity reconciliation. |
The table shows that most of the gap is about what is counted and how the year is pinned to verified commissioning. Some estimates bundle project and equipment spend, then Mordor Intelligence counts only commissioned installed wind capacity in Thailand and confirms year-end totals using commissioning and retirement checks before forecasts are extended.


Key Questions Answered in the Report
How large is the Thailand wind energy market in 2026?
Installed capacity is 1.71 GW in 2026 and is on track for 2.37 GW by 2031 under current auction schedules.
What is the expected growth rate through 2031?
Capacity is set to grow at a 6.82% CAGR between 2026 and 2031, driven by policy targets and feed-in tariffs.
Which region hosts most wind farms?
The northeast region, particularly Nakhon Ratchasima and Chaiyaphum, accounts for about 84.20% of current capacity.
Who are the leading developers?
Energy Absolute, Gulf Energy, EGCO, BCPG, and PTT collectively manage about 70% of existing and planned projects.
What turbine sizes are gaining popularity?
The 3–6 MW class is expanding fastest because larger rotors cut levelized costs in Thailand’s low-wind conditions.
Are offshore wind projects likely before 2030?
A 200 MW pilot may enter auction in 2027, but meaningful offshore capacity is unlikely to be commercial before 2030.
Page last updated on:





