
Market Overview
| Study Period | 2021 - 2031 |
|---|---|
| Forecast Data Period | 2026 - 2031 |
| Base Year Market Size (2025) | 1.91 gigawatt |
| Market Volume (2026) | 2.46 gigawatt |
| Market Volume (2031) | 8.69 gigawatt |
| Growth Rate (2026 - 2031) | 28.74 % |
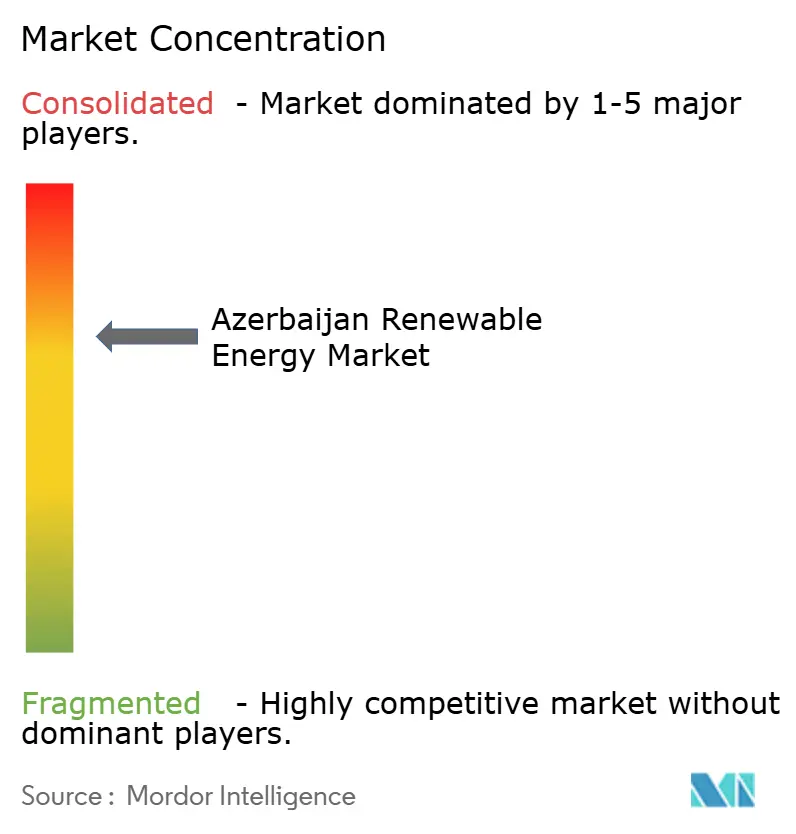
| Market Concentration | Medium |
Major Players *Disclaimer: Major Players sorted in no particular order Image © Mordor Intelligence. Reuse requires attribution under CC BY 4.0. | |
Azerbaijan Renewable Energy Market Analysis by Mordor Intelligence
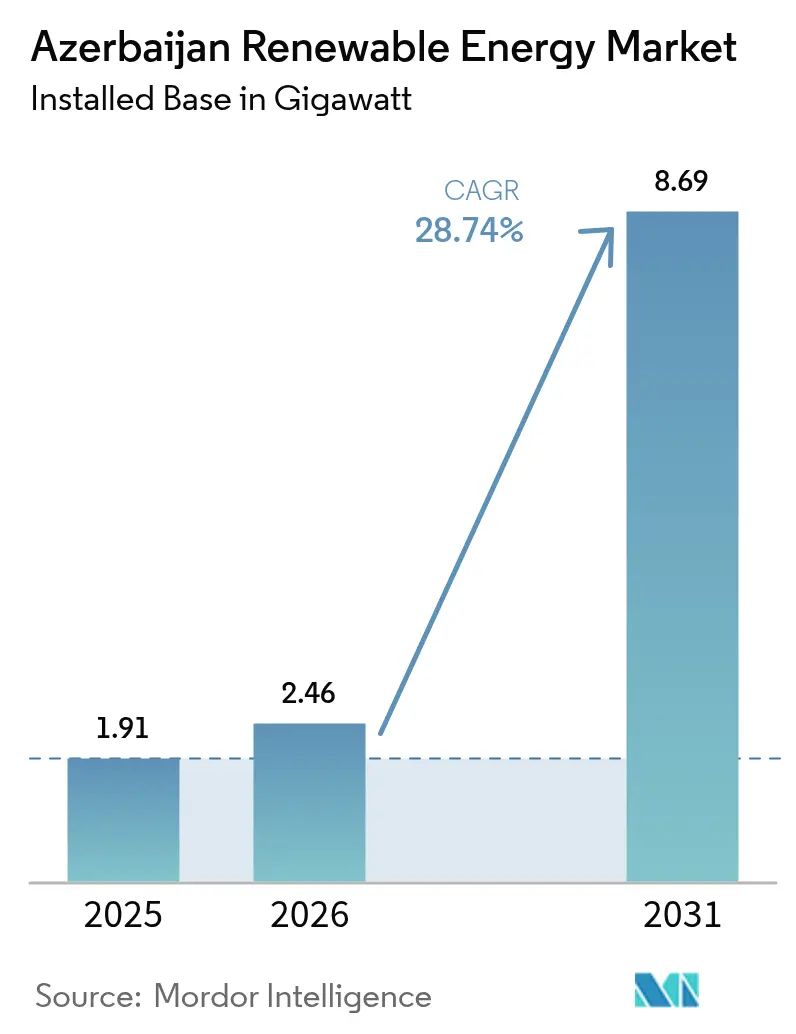
The Azerbaijan Renewable Energy Market size is expected to grow from 1.91 gigawatt in 2025 to 2.46 gigawatt in 2026 and is forecast to reach 8.69 gigawatt by 2031 at 28.74% CAGR over 2026-2031.
Abundant solar and wind resources, mounting foreign direct investment, and the government’s 30% renewable capacity target are accelerating deployment. Hosting COP29 in Baku in 2024 has also amplified global visibility and unlocked concessional finance. Major developers, including Masdar, ACWA Power, bp, and SOCAR Green, have committed more than USD 1 billion through 2025, signaling confidence in long-term power-purchase agreements (PPAs) backed by sovereign guarantees. Planned undersea high-voltage direct-current (HVDC) cables linking Caspian renewable generation to European grids promise an export avenue that mirrors the Southern Gas Corridor, supporting Azerbaijan’s dual strategy of freeing domestic gas for export and diversifying the national energy mix. However, ageing Soviet-era transmission assets, gas-price subsidies, and land-use conflicts in liberated Karabakh pose near-term execution risks.[1]
Key Report Takeaways
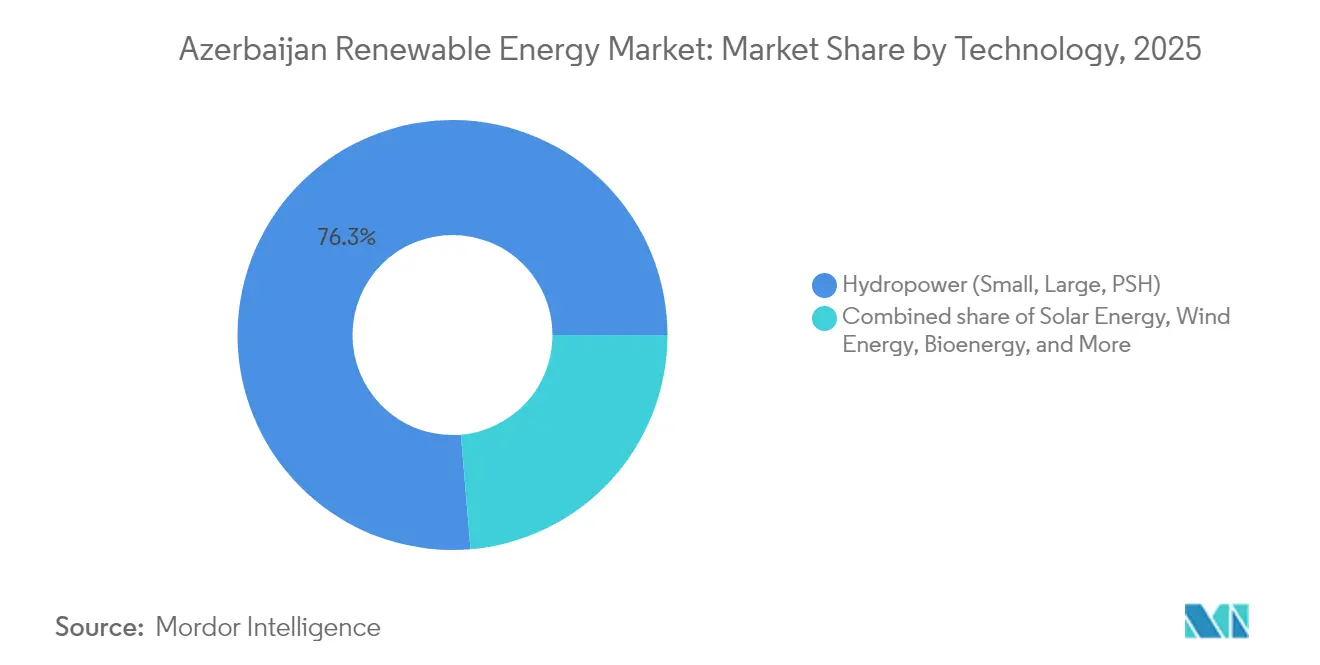
- By technology, hydropower led with a 76.34% share of the Azerbaijan renewable energy market in 2025, while solar is forecast to expand at a 62.4% CAGR through 2031.
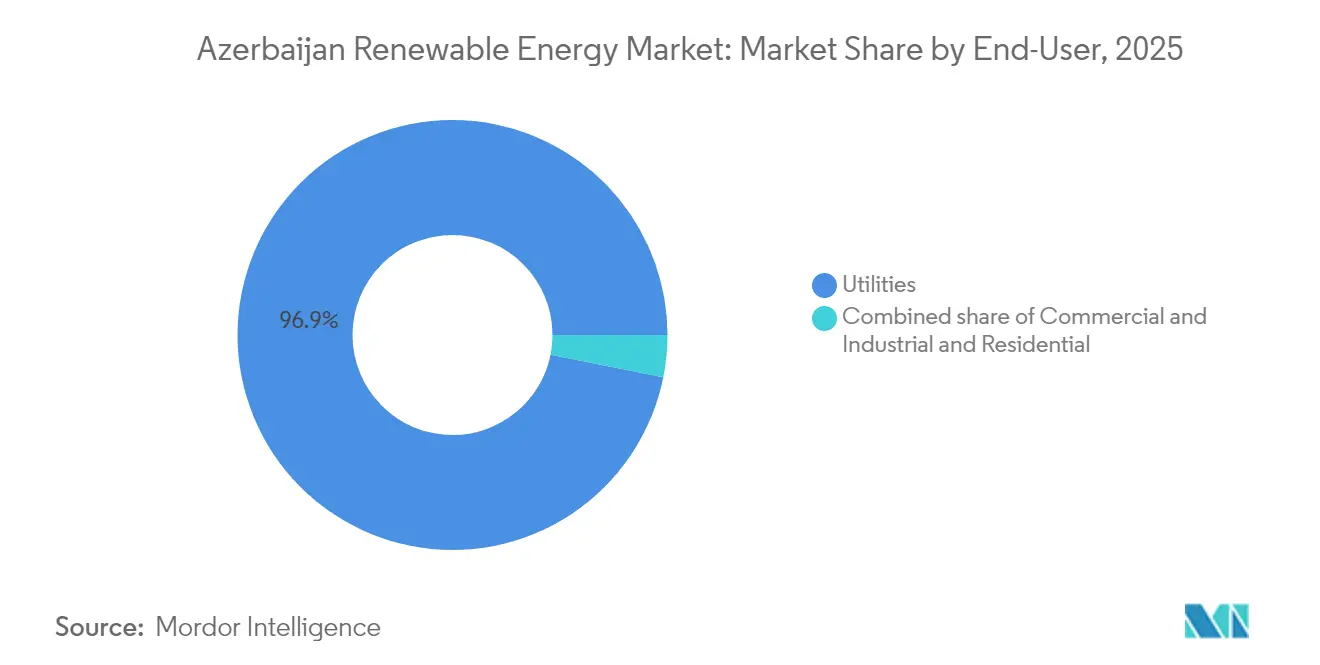
- By end-user, utilities held 96.85% of the Azerbaijan renewable energy market share in 2025, whereas residential capacity is projected to grow at a 38.9% CAGR to 2031.
Note: Market size and forecast figures in this report are generated using Mordor Intelligence’s proprietary estimation framework, updated with the latest available data and insights as of 2026.
Azerbaijan Renewable Energy Market Trends and Insights
Drivers Impact Analysis*
| Driver | (~) % Impact on CAGR Forecast | Geographic Relevance | Impact Timeline |
|---|---|---|---|
| 30% renewable-capacity target by 2030 | +8.00% | National, with priority zones in Absheron, Karabakh, Nakhchivan | Medium term (2-4 years) |
| Abundant solar & wind resources (135 GW onshore, 157 GW offshore) | +6.50% | National, offshore Caspian concentrated in shallow-water zones | Long term (≥ 4 years) |
| Foreign IPP inflows & long-term PPAs (Masdar, ACWA, bp) | +7.50% | National, early concentration in Absheron, Bilasuvar, Jabrayil | Short term (≤ 2 years) |
| EU-bound Green Energy Corridor export opportunity | +4.50% | National, with transmission infrastructure linking Caspian to Black Sea | Long term (≥ 4 years) |
| Hosting COP29 catalyzes climate finance access | +3.00% | National, with spillover to regional Caucasus initiatives | Short term (≤ 2 years) |
| Digital-oilfield know-how lowers RE O&M costs | +2.50% | National, leveraging SOCAR and bp operational expertise | Medium term (2-4 years) |
| Source: Mordor Intelligence | |||
30% Renewable-capacity Target by 2030
The target requires 1,500 MW of new builds beyond existing assets. Competitive auctions, fixed-price tariffs, and sovereign guarantees have de-risked financing, as evidenced by the 100 MW solar lot clearing at USD 0.0354 per kWh during COP29.[2] Presidential guidance states that 1,300 MW will be operating by 2027, accelerating deployment ahead of the statutory deadline. Developers value the law’s stability because it aligns with the period in which oil production enters decline. Multilateral agencies have since underwritten 1.2 GW of projects, signalling strong lender confidence. The framework, therefore, anchors predictable demand for equipment and services within the Azerbaijan renewable energy market.
Abundant Solar & Wind Resources
The country’s 292 GW total technical potential surpasses domestic demand by an order of magnitude. Insolation peaks at 1,600 to 2,000 kWh/m² annually on the Absheron Peninsula, supporting capacity factors near 20%. Offshore wind potential reaches 157 GW in shallow Caspian waters, which already host existing energy infrastructure, thereby lowering balance-of-plant costs through shared logistics. Meteorological data indicate complementary generation profiles between onshore wind and solar, enabling higher aggregate utilisation. These endowments underpin the long-range growth path of the Azerbaijan renewable energy market.
Foreign IPP Inflows & Long-term PPAs
Masdar, ACWA Power, and bp collectively pledged more than USD 5.3 billion for new plants during 2024.[3] Tenor-matched PPAs hedge currency risk, while virtual swaps allow bp to deliver power to its Sangachal terminal without building dedicated lines. Local manufacturing clauses foster job creation as Baker Hughes establishes a centre of excellence for renewable systems. Cost reductions arising from global procurement pipelines improve auction competitiveness and keep the Azerbaijan renewable energy market on its forecast trajectory.
EU-bound Green Energy Corridor export opportunity
A 1,200 km HVDC link is under feasibility review to send 1,000 MW of clean power through Georgia to Romania and Hungary. The corridor monetises offshore wind volumes that exceed local demand, diversifies export earnings beyond gas, and strengthens Azerbaijan’s role in European energy security. Anticipated wheeling revenues uplift project internal rates of return, incentivising earlier investment decisions for large-scale wind farms. Alignment with the EU’s REPowerEU agenda increases grant eligibility and reduces credit-spread premiums for corridor-tied projects.
Restraints Impact Analysis*
| Restraint | (~) % Impact on CAGR Forecast | Geographic Relevance | Impact Timeline |
|---|---|---|---|
| Ageing grid & limited inter-connector capacity | -5.00% | National, acute in Absheron and Karabakh transmission corridors | Short term (≤ 2 years) |
| Gas-price subsidies distort RE competitiveness | -3.50% | National, particularly affecting industrial and residential tariffs | Medium term (2-4 years) |
| Auction & permitting delays | -2.00% | National, concentrated in AREA and Ministry of Energy approval workflows | Short term (≤ 2 years) |
| Land-use conflicts in liberated Karabakh | -1.50% | Karabakh and East Zangezur regions | Medium term (2-4 years) |
| Source: Mordor Intelligence | |||
Ageing grid & limited inter-connector capacity
Soviet-era equipment hinders the integration of variable renewables, with line losses still exceeding 9%. Reconstructed substations in liberated districts lag demand growth, delaying plant energisation dates. International loans are funding digital substation rollouts that follow IEC 61850 standards, yet completion is expected to stretch past 2030. Insufficient cross-border transfer capacity also limits export of surplus generation, tempering the near-term scale-up of the Azerbaijan renewable energy market.
Gas-price Subsidies Distort Competitiveness
Natural-gas subsidies equalled almost 2% of GDP in 2018 and continue to cap retail tariffs.[4] Cheap gas electricity narrows the cost gap with renewables, complicating project bankability for distributed systems. The government aims for ga radual subsidy rollback to safeguard household budgets, but timing uncertainty still weighs on PPA negotiations. Clarity on subsidy reform is therefore essential for unlocking the full potential of the Azerbaijan renewable energy market.
*Our forecasts treat driver/restraint impacts as directional, not additive. The impact forecasts reflect baseline growth, mix effects, and variable interactions.
Segment Analysis
By Technology: Solar Ascendancy Amid Hydropower Legacy
Solar capacity is projected to climb from 0.39 GW in 2025 to 3.72 GW by 2031, a 62.4% CAGR that outpaces every other segment. Masdar's Bilasuvar and Neftchala parks are expected to increase the installed photovoltaics to nearly 15% of Azerbaijan's renewable energy market size by 2027. Hydropower's 1.46 GW base secures the largest share, yet its growth flattens as prime river sites are saturated. Pumped-storage feasibility work with PowerChina signals a shift toward flexibility assets, which are essential for higher solar penetration.
The Azerbaijan renewable energy market share for wind is expected to accelerate once ACWA Power's 240 MW onshore plant enters service in 2025, followed by Masdar's phased 2 GW offshore rollout. Offshore foundations, port logistics, and grid reinforcements will keep early-stage capacity modest, but floating-platform technology can unlock deep-water potential post-2028. Bioenergy remains dormant despite 380 MW of agricultural residue feedstock, reflecting the absence of feed-in tariffs and supply-chain fragmentation.

By End-User: Utility Monopoly Meets Residential Awakening
Utilities account for nearly the entire size of the Azerbaijan renewable energy market today, anchored by Azerenerji’s single-buyer model. In the long term, residential prosumers supported by net-metering pilots in Baku and Ganja are expected to chip away at the monopoly as rooftop system costs fall below USD 600/kW.
The Azerbaijan renewable energy market share for residential users is projected to reach 3.25% by 2031 under the World Bank’s high-deployment scenario. Commercial and industrial uptake will remain limited until gas subsidies are phased out or virtual PPA frameworks emerge that allow wheeling.
Geography Analysis
The Absheron Peninsula and the Baku-Sumgayit corridor are the primary locations for new builds, as grid capacity, load density, and brownfield land converge to offer low integration costs. The Caspian offshore zones hold a technical potential of 157 GW, and early seabed surveys inform the design of floating platforms. Western districts are leveraging proximity to Georgia for the planned EU Green Energy Corridor, which will open a 1,000 MW export route, thereby enhancing project cash flows.
The Nakhchivan Autonomous Republic operates an isolated grid but eyes cross-border swaps with Türkiye and Iran that would monetise solar peaks while improving local reliability. Liberated Karabakh receives Presidential backing as a designated green energy zone, with AZN 2.36 million earmarked for integrated master plans. The Smart Village in Zangilan demonstrates how hybrid microgrids can rebuild rural economies.
Mountainous north-west districts explore small hydro and biomass, creating a diversified regional resource mix. Coastal communities are investigating floating solar energy where land is scarce. This spatial spread distributes employment and supports nationwide uptake, reinforcing resilience across the Azerbaijan renewable energy market.
Regulatory Landscape
Azerbaijan regulates renewables primarily under the Law on the Use of Renewable Energy Sources in Electricity Generation (2021), complemented by the Law on Public-Private Partnership (2022), the Law on Electro Energetics (2023), and the Law on the Efficient Use of Energy Resources (2021). The Ministry of Energy sets sector policy, while the Azerbaijan Energy Regulatory Agency (AERA) oversees market compliance, tariff proposals, and dispute resolution. The Azerbaijan Renewable Energy Agency (AREA) coordinates renewable project promotion and auction processes, which have become a core route for utility-scale entry.
Renewable electricity tariffs are administered through the Tariff (Price) Council, with differentiated wholesale categories referenced for 2026 across small hydropower, wind, and solar/other. Investment incentives are supported by Azerbaijan 2030 National Priorities (including the Clean Environment and Green Growth pillar) and mechanisms such as Presidential Decree No. 2462 (February 1, 2024), which defines strategic investment project areas eligible for Investment Promotion Documents and includes renewable energy production among qualifying activities. This links project qualification to state-approved support pathways.
Competitive Landscape
The market remains moderately fragmented, with Masdar, ACWA Power, and bp leading utility pipelines while SOCAR and Azerenerji provide state backing. International firms supply technology and finance, and joint ventures ensure local capacity building. Developers differentiate themselves through digital asset management, as evidenced by Baker Hughes' installation of electric submersible pumps adapted for renewable water-pumping duties.
Cost curves decline as global module prices fall and lenders accept Azerbaijan's sovereign guarantees. Early movers secure prime sites near existing substations, creating barriers for late entrants. Technology suppliers, such as Siemens Gamesa and Vestas, position themselves for upcoming offshore wind rounds, while local steel fabricators target balance-of-plant work.
White-space niches appear in battery storage integration, demand-response software, and community solar services. Policy clarity on subsidy withdrawal and grid codes will influence relative advantage. Strategic partnerships continue to shape the Azerbaijan renewable energy market.
Azerbaijan Renewable Energy Industry Leaders
-
Azerenerji JSC
-
Abu Dhabi Future Energy Company PJSC (Masdar)
-
ACWA Power
-
bp Azerbaijan (Shafag Solar JV)
-
SOCAR Renewables
- *Disclaimer: Major Players sorted in no particular order
Market Opportunities and Future Outlook
Utility-scale buildout continues to be supported by sovereign-backed PPAs and structured procurement, with auctions and direct negotiations functioning as the two main entry mechanisms for developers. There is ongoing whitespace in grid-supporting solutions that reduce integration constraints, particularly battery energy storage systems and digital substation upgrades aligned with IEC 61850-type modernization programs, given reported grid losses above 9% and the need for stability as variable generation scales. The single-buyer structure centered on Azerenerji also creates a defined counterpart for bankable contracting models, including virtual transfer structures used to match generation with load without dedicated private lines.
The pipeline is also widening beyond ground-mounted PV and onshore wind, with offshore wind and floating solar initiatives adding a second track of development. A clear signal came from April 2025 signing of agreements with Chinese companies covering 260 MW of solar, a 100 MW floating solar plant, a 30 MW battery energy storage system, and an agreement to assess and develop a 2 GW offshore wind project. This supports Azerbaijan's stated resource base (135 GW onshore and 157 GW offshore technical potential) and its 30% renewable capacity target by 2030. In parallel, the Caspian-to-Europe Green Energy Corridor workstream, including ministerial-level engagement around Black Sea routing and implementation planning, keeps export-linked project design needs in focus, including transmission, balancing, and compliance-ready metering and settlement.
Recent Industry Developments
- May 2026: Azerbaijan's Ministry of Energy stated its aim to complete commissioning of 12 renewable energy projects under the national transition program. The announcement highlighted a shift from individual flagship plants to multi-project execution, increasing near-term demand for grid connection works, dispatch coordination, and commissioning services across regions.
- June 2025: bp Azerbaijan's Shafag Solar JV reached final investment decision on the 240 MW Shafag solar project in Jabrayil and progressed a virtual power transfer structure with Azerenerji. The model broadens how corporate and industrial loads can be matched with new renewable generation using national grid balancing, supporting additional offtake structures beyond standard utility PPAs.
- June 2024: The President of Azerbaijan inaugurated a set of renewable projects totaling 1 GW developed with Masdar and SOCAR, covering Bilasuvar Solar (445 MW), Neftchala Solar (315 MW), and the Absheron-Garadagh onshore wind project (240 MW). The portfolio launch strengthened the utility-scale pipeline and increased requirements for transmission reinforcement and system-operations capabilities to integrate larger blocks of variable renewable power.
Research Methodology Framework and Report Scope
Market Definition and Coverage
In this methodology, the Azerbaijan renewable energy market is defined as country-level installed renewable power capacity that is connected and operational, tracked in gigawatts across major renewable technologies and user categories.
Scope exclusions: We exclude fossil-based generation, conventional thermal capacity, and broader grid and transmission build-outs unless they are directly tied to renewable generation capacity additions.
Segmentation Overview
- By Technology
- Solar Energy (PV and CSP)
- Wind Energy (Onshore and Offshore)
- Hydropower (Small, Large, PSH)
- Bioenergy
- Geothermal
- Ocean Energy (Tidal and Wave)
- By End-User
- Utilities
- Commercial and Industrial
- Residential
Data Sources, Market Sizing, and Validation
Desk Research
We start by building the factual base of installed capacity, planned additions, and policy targets using public energy statistics and project disclosures. For Azerbaijan, sources such as IRENA country capacity series, IEA energy indicators, national energy ministry updates, and utility or system operator releases help us pin down what is commissioned versus still under development.
To translate capacity movements into a repeatable model, we also review regulatory documents, tender announcements, and major project milestones from investor presentations, audited filings, and credible press coverage. Patent databases are used selectively to sense technology direction, for example, grid integration needs or storage-linked renewables. Where equipment flows help explain near-term build timing, an import-export shipment-level database may be referenced. The desk research sources listed here are illustrative, and we use other public references for cross-checks and clarification during analysis.
Primary Interviews and Surveys
We use interviews and surveys in Azerbaijan with project developers, utilities, regulators, financiers, engineering specialists, and procurement teams. Their input tests project dates, capacity factors, auction pricing, grid access, and delays, helping us resolve gaps in public records and triangulate the final model.
Distribution of primary research fieldwork respondents
| Company type | Respondent position |
|---|---|
| Top tier: 25% | CXOs: 18% |
| Mid tier: 52% | Functional/Unit leaders: 32% |
| Smaller Players: 23% | Managers: 50% |
Market-Sizing & Forecasting
The core sizing is built using a top-down approach, where national installed renewable capacity is reconstructed year by year from commissioning schedules, official capacity registries, and project pipeline status updates. That total is then mapped into the technologies covered in the study. Once the total is formed, we corroborate it with selective bottom-up approximations, such as roll-ups of tracked utility-scale projects, sampled capacity additions by developers, and channel checks on typical project sizes, which we use to adjust timing when needed.
Key inputs used in the model include the visible pipeline by status (announced, permitted, under construction, commissioned), average construction-to-commission lead times, grid connection readiness signals, policy target dates and procurement cadence, and typical capacity factors by technology. These checks are used to confirm that the implied generation direction matches the sector narrative. For forecasting, scenario analysis is used so that delays in grid access or permitting can be separated from a faster execution case. The final trajectory is selected based on primary feedback on what is realistically financeable. Where project-level detail is incomplete, we fill gaps with conservative timing assumptions anchored to similar recent projects in the same country context, and then review those assumptions again during expert validation.
Data Validation & Update Cycle
Outputs are checked against independent signals, such as official installed capacity series, public commissioning announcements, and the consistency of year-on-year additions versus the known project pipeline. We run variance checks to catch step changes that do not align with construction timelines, then perform a second analyst review of inputs, formulas, and conversions before the numbers are signed off.
The report is refreshed on an annual cycle, and interim updates are triggered when there are material events, including large tender awards, major cancellations, or commissioning slippages, that would shift the near-term capacity curve. Before delivery, a final review pass is completed so clients receive the latest aligned view of capacity and forecast assumptions.
Mordor Intelligence's Azerbaijan Renewable Energy Market Size Versus Other Published Estimates
Published numbers for Azerbaijan renewable energy often do not match because some publishers size the market in installed capacity, while others convert it into revenue using their own price and utilization assumptions. Differences also come from whether only operational plants are counted, or whether early-stage announced projects are included as part of the market.
Commissioning trackers and official capacity series are the evidence points that keep the Mordor Intelligence estimate anchored to operational installed capacity (GW) for the stated years, rather than mixing in forecast pipeline value or equipment sales. The remaining spread typically comes from currency conversion timing, the treatment of small distributed projects, and whether pumped storage or other adjacent assets are bundled into the total.
Benchmark comparison
| Source | Market Size | Gaps in Research Methodology |
|---|---|---|
| Mordor Intelligence | USD 1.91 B (2025) | |
| Global Consultancy A | USD 1.40 B (2026) | Uses a revenue-based view, so market value depends on assumed capex and pricing cycles, and the forecast window and technology inclusions can shift totals even if capacity additions are similar. |
| Industry Portal B | USD 0.03 B (2024) | Appears to size a narrower revenue pool and may capture only a subset of renewable activity (for example, smaller contracts or limited technologies), which can understate the country-level installed capacity footprint. |
The table shows that the biggest driver is not only the year used, but also the unit and boundary used to define the market. By keeping the model tied to commissioned capacity, documented project status, and reviewed timing assumptions, the estimate stays traceable to clear inputs that a reader can follow and replicate.
Key Questions Answered in the Report
How large will installed renewables be in Azerbaijan by 2031?
Total capacity is forecast to reach 8.69 GW, up from 1.91 GW in 2025, underpinned by a 28.74% CAGR.
Which technology is growing fastest?
Solar is projected to expand at a 62.4% CAGR, driven by record-low module prices and bankable PPAs.
What role will offshore wind play?
Up to 2 GW is under feasibility study for shallow-water sites, with long-term potential of 157 GW across the Caspian Sea.
Why is the Green Energy Corridor important?
The corridor could export 5-10 GW of renewable electricity to Europe, diversifying revenue and supporting EU energy security.
What are the main barriers to investment?
Ageing grid infrastructure, gas-price subsidies, and permitting delays currently restrain deployment speed.
Who are the leading developers?
Masdar, ACWA Power, bp, and SOCAR Green hold the largest project pipelines and long-term PPAs.