Asia-Pacific Third-Party Logistics (3PL) Market Size and Share
Market Overview
| Study Period | 2020 - 2031 |
|---|---|
| Forecast Data Period | 2026 - 2031 |
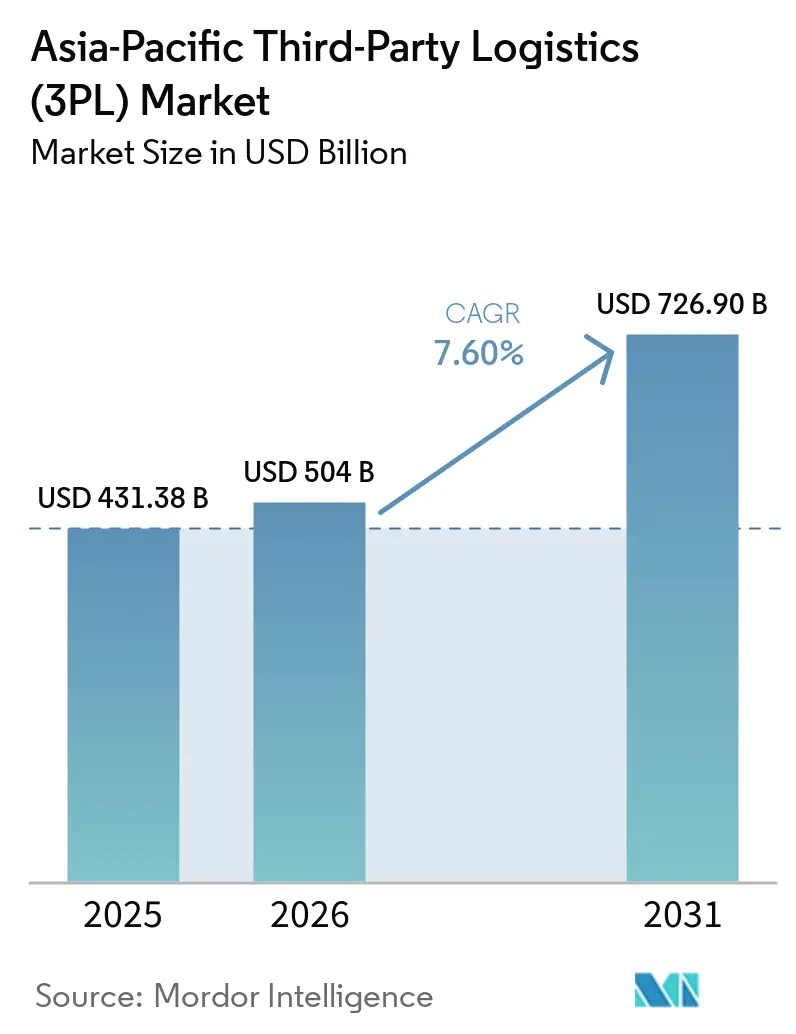
| Base Year Market Size (2025) | USD 431.38 Billion |
| Market Size (2026) | USD 504 Billion |
| Market Size (2031) | USD 726.90 Billion |
| Growth Rate (2026 - 2031) | 7.60% CAGR |
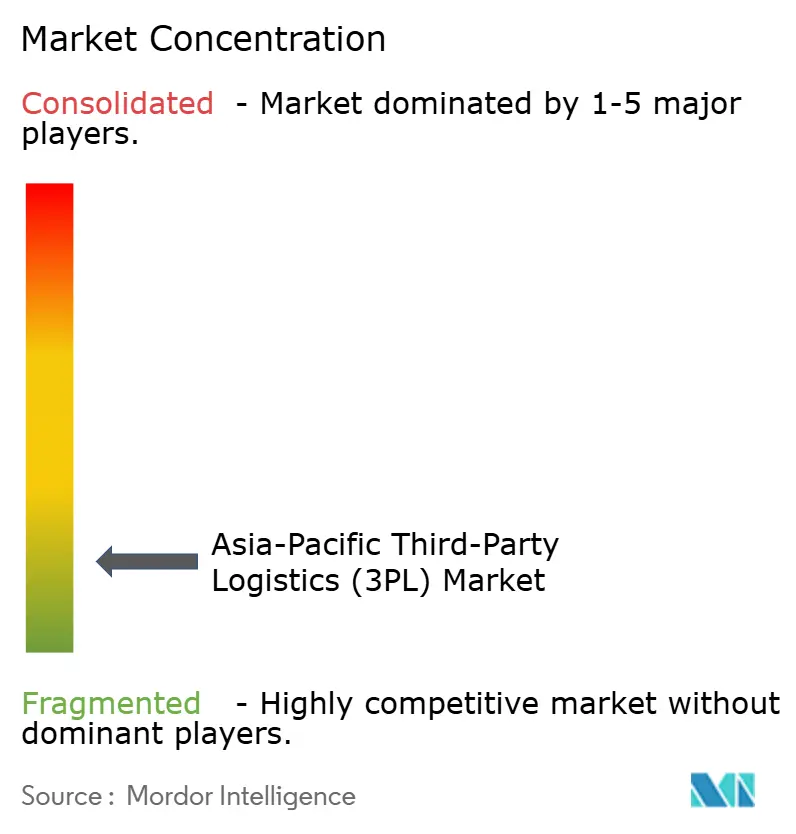
| Market Concentration | Low |
Major Players *Disclaimer: Major Players sorted in no particular order Image © Mordor Intelligence. Reuse requires attribution under CC BY 4.0. | |
Asia-Pacific Third-Party Logistics (3PL) Market Analysis by Mordor Intelligence
The Asia-Pacific Third-Party Logistics Market size is projected to expand from USD 431.38 billion in 2025 and USD 504 billion in 2026 to USD 726.90 billion by 2031, registering a CAGR of 7.60% between 2026 to 2031.
A sustained push from regional trade integration and e-commerce fulfillment is raising the strategic role of outsourced logistics across key corridors. The Asia-Pacific third-party logistics market benefits from lower trade friction under RCEP, which improves the business case for asset-light orchestration and cross-border consolidation. Large platform operators are investing in automation and multi-temperature networks, which raises service benchmarks that mid-sized providers then match to stay relevant. The Asia-Pacific third-party logistics market is also adapting to compliance intensity in pharmaceuticals and data stewardship, creating opportunities for accredited providers with auditable systems. Scale 3PLs that combine digital control towers with selective infrastructure control are positioned to capture more sticky contracts as the Asia-Pacific third-party logistics market matures.
Key Report Takeaways
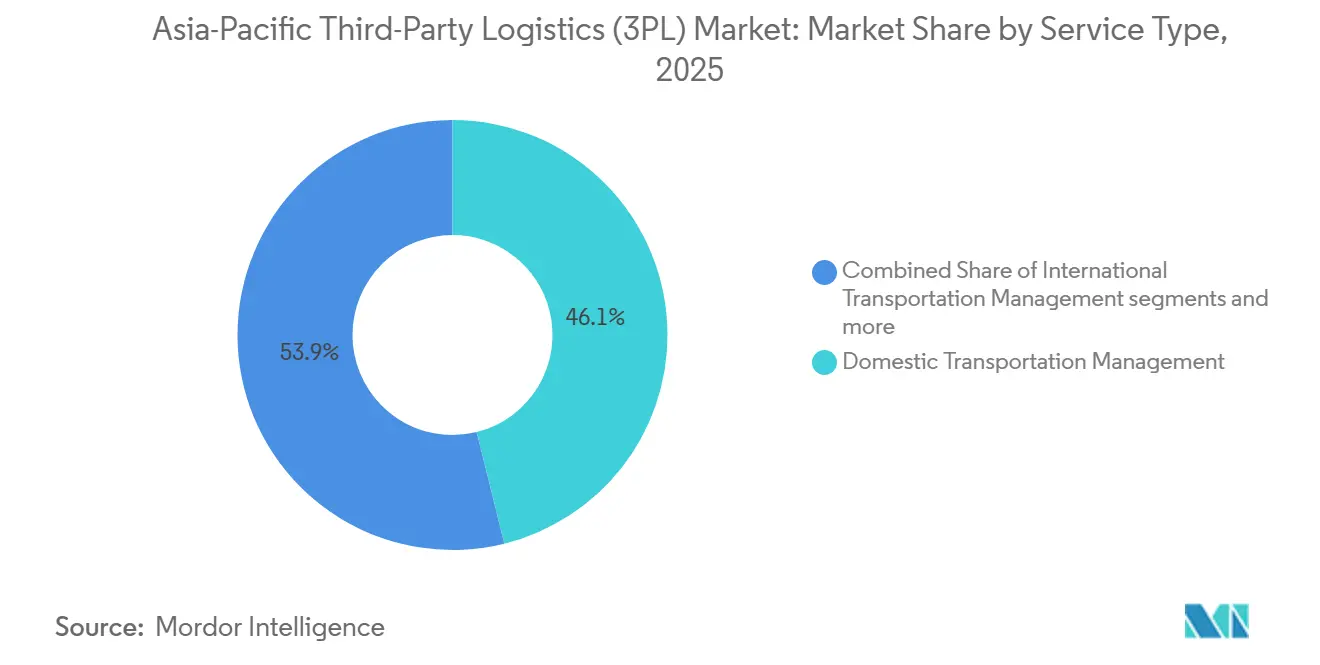
- By service, Domestic Transportation Management led with 46.12% of the Asia-Pacific third-party logistics (3PL) market share in 2025. Value-Added Warehousing and Distribution is projected to be the fastest-growing service at a 7.84% CAGR through 2031.
- By end-user industry, Retail and E-commerce accounted for 27.94% in the Asia-Pacific third-party logistics (3PL) market size in 2025. Life Sciences and Healthcare is projected to record the highest growth at an 8.21% CAGR to 2031.
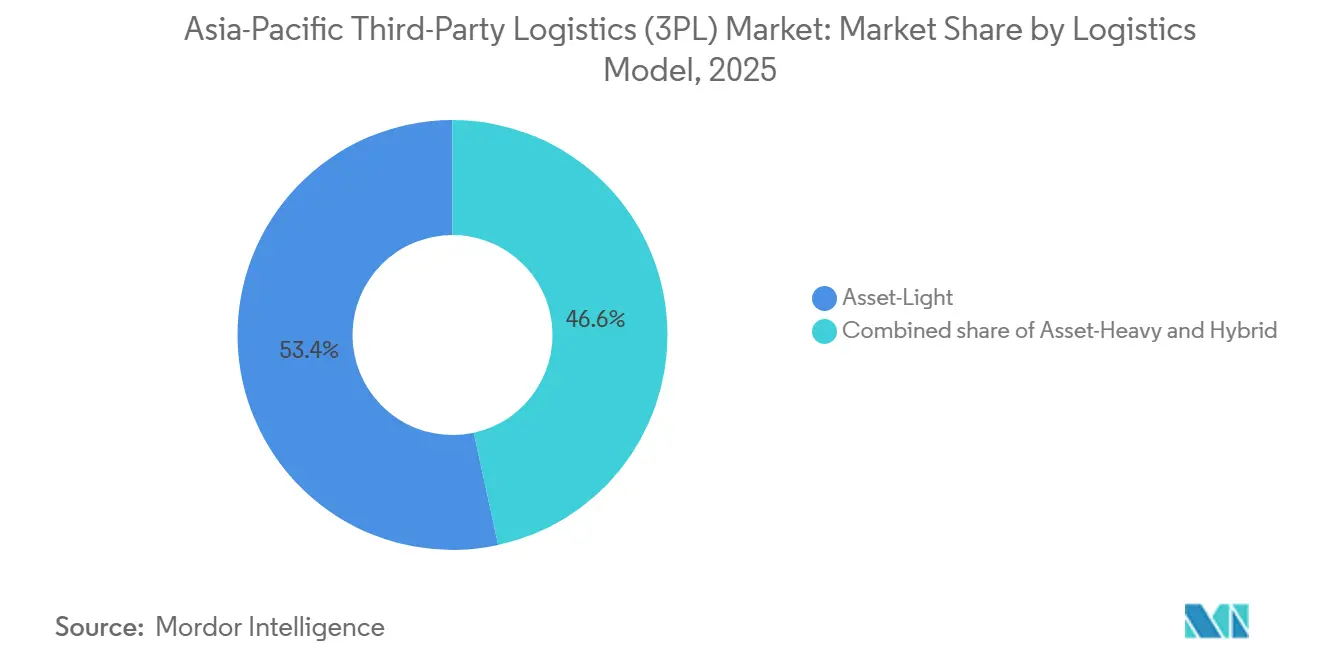
- By logistics model, Asset-Light operations held 53.41% in 2025. Hybrid approaches are projected to post the fastest growth at a 7.63% CAGR through 2031.
- By geography, China commanded 58.74% in 2025. India is projected to expand at an 8.62% CAGR through 2031.
Note: Market size and forecast figures in this report are generated using Mordor Intelligence’s proprietary estimation framework, updated with the latest available data and insights as of January 2026.
Asia-Pacific Third-Party Logistics (3PL) Market Trends and Insights
Drivers Impact Analysis*
| Driver | (~) % Impact on CAGR Forecast | Geographic Relevance | Impact Timeline |
|---|---|---|---|
| E-commerce Boom Across Region | +2.8% | Global, with concentration in China, India, Southeast Asia | Short term (≤ 2 years) |
| Regional Trade Agreement Implementation | +1.5% | RCEP member states (ASEAN+5), spill-over to South Asia | Medium term (2-4 years) |
| Digital Logistics Platform Proliferation | +1.1% | Urban centers in China, India, Singapore; expanding to Indonesia, Philippines | Short term (≤ 2 years) |
| Cold Chain Infrastructure Development | +0.9% | Vietnam, Thailand, Malaysia, Singapore; rising in India | Medium term (2-4 years) |
| Automotive and Electronics Manufacturing Growth | +0.8% | China, Vietnam, Thailand, India (EV corridors) | Long term (≥ 4 years) |
| Outsourcing Trend by SMEs | +0.5% | ASEAN markets, India; urban-to-rural expansion | Short to Medium term (1-3 years) |
| Source: Mordor Intelligence | |||
E-commerce boom fuelling same-day and last-mile fulfilment
Rising online order density is shifting 3PL activity from bulk movements to high-frequency fulfillment that relies on automated nodes. JD Logistics reported operating more than 20 automated LangzuTech warehouses across nearly 20 cities by late 2025, which signals how large shippers are leaning on advanced facilities to support delivery speed and order accuracy as volumes increase. The Asia-Pacific third-party logistics market uses such assets to absorb seasonal spikes that would overwhelm traditional networks. Automated sorting and goods-to-person systems compress cycle times for small parcels, which improves customer experience and expands the serviceable market for time-sensitive categories. The Asia-Pacific third-party logistics market is also shaped by platform-backed investments that raise the floor for fulfillment standards across major urban hubs. Providers that align automation with dense last-mile routing are better placed to hold margins as price transparency increases.
Regional Trade Agreement Implementation
RCEP continues to lower friction across a trade zone spanning 15 economies, which encourages shippers to consolidate cross-border logistics under fewer partners. China’s recorded goods trade with RCEP members reached RMB 9.63 trillion by Q3 2024, with year-over-year growth, and the China-Laos Railway has moved 11.58 million tons of cross-border cargo since late 2021, which underpins new multimodal solutions that 3PLs can package across borders. The Asia-Pacific third-party logistics market is already building combined road-rail-air offerings around these corridors. Document flow standardization through initiatives like the ASEAN Single Window has reduced paperwork time for participating members, which supports end-to-end visibility and more reliable transit planning. The Asia-Pacific third-party logistics market sees stronger appeal for cross-border trucking and rail alternatives when tariffs and procedures align. Providers with customs brokerage depth and origin-destination compliance teams gain an edge as tariff schedules phase down and certificates of origin integrate into digital workflows.
Digital Logistics Platform Proliferation
Cloud-native transportation and warehouse platforms are widening access to orchestration tools and analytics. Industry association reports operations across seven Asia-Pacific countries and supports a broad carrier network and shipment flow, which illustrates how API-first systems can lower onboarding costs for capacity partners and improve control tower visibility at scale. Shipsy highlights AI-based routing and multi-carrier management that handles high monthly shipment counts and embedded freight procurement, which simplifies complexity for shippers without deep internal tech teams. The Asia-Pacific third-party logistics market is adopting these systems to gain reliable carrier data, predictable ETAs, and faster tendering. India’s single window for customs integrates multiple agencies, lowers declaration time, and connects forwarders at a national scale, which shortens dwell time for compliant shipments and rewards tech-enabled 3PLs. Data protection rules are also reshaping system architecture for international operators in India, which pushes investments in local infrastructure and governance that accredited 3PLs can leverage for enterprise deals.
Cold Chain Infrastructure Development
Specialized pharma and premium food flows are expanding multi-temperature storage needs and validated distribution paths. DHL announced a EUR 2 billion global investment in Life Sciences and Healthcare capabilities by 2030, with EUR 500 million directed to Asia-Pacific for new GDP-certified hubs and multi-temperature fleet and IT upgrades, which signals sustained demand for rigorously controlled chains in the region. The Asia-Pacific third-party logistics market is evolving toward tighter temperature bands, comprehensive audit trails, and clinical trial logistics that combine speed with integrity. Pharma hubs in Singapore, Malaysia, and South Korea extend regional coverage while offering proximity to biopharma manufacturing and centralized quality teams.[1]DHL Group, “DHL Group to Invest EUR 500 Million in Asia Pacific by 2030 to Boost Globally Integrated Healthcare Solutions,” DHL, dhl.com The Asia-Pacific third-party logistics market also benefits from spillover into adjacent categories like fresh produce and specialty ingredients as large cold platforms scale. Providers with proven GDP processes and trained personnel can capture premium rates in lanes where uptime and compliance are critical.
Restraints Impact Analysis*
| Restraint | (~) % Impact on CAGR Forecast | Geographic Relevance | Impact Timeline |
|---|---|---|---|
| Infrastructure Gaps in Emerging Markets | -0.8% | Indonesia, Philippines, Cambodia, Laos; inland Southeast Asia | Long term (≥ 4 years) |
| Geopolitical Tensions and Trade Uncertainties | -0.7% | North Asia (China-Taiwan-U.S. corridor), Red Sea impact on APAC-Europe lanes | Short term (≤ 2 years) |
| Fragmented Regulatory Environment | -0.6% | ASEAN-wide (varying national standards), India (state-level complexity) | Medium term (2-4 years) |
| Shortage of Skilled Workforce | -0.4% | Japan, South Korea, Australia; emerging in Vietnam, Thailand | Short to Medium term (1-3 years) |
| Source: Mordor Intelligence | |||
Infrastructure Gaps in Emerging Markets
Transport networks in several economies remain road-heavy and underdeveloped relative to OECD benchmarks, which limits route flexibility and raises cost-to-serve for long inland moves. Asian Transport Observatory data shows regional infrastructure density and road-to-rail mix lagging developed norms, which constrains modal shift options during disruptions. In Thailand, agricultural freight remains predominantly road-based with minor rail share, which pushes costs above global medians and compresses margins for bulk and FMCG shippers. The Asia-Pacific third-party logistics market can route around bottlenecks with selective use of rail and coastal feeder services where they exist, but dense corridors still face peak congestion. Climate risk adds exposure for roads and rail assets across the region with high precipitation volatility and typhoon frequency, which increases downtime and recovery costs for operators.[2]Asian Transport Observatory, “Asia and the Pacific’s Transport Infrastructure and Investment Outlook 2035,” Asian Transport Observatory, asiantransportobservatory.org The Asia-Pacific third-party logistics market will likely bifurcate strategies between premium corridors with planned upgrades and secondary routes where road dependence persists, which affects achievable service levels.
Geopolitical Tensions and Trade Uncertainties
Geopolitical tensions and trade uncertainties have rerouted many Asia to Europe sailings around the Cape of Good Hope since 2024, adding 10 to 14 days to transit times and increasing bunker and insurance costs. These detours tightened time definite capacity and pushed air freight pricing higher on Asia to Europe and Transpacific lanes compared with late 2024. Leading operators also reported softer revenue in selected Asia units in 2025, underscoring how volatility weighed on express and supply chain flows. Route instability complicates inventory planning because longer and less predictable transits force higher safety stock or acceptance of stockout risk for fast moving categories. Policy shifts and chokepoint controls can trigger extra inspections and ad hoc restrictions that raise compliance workloads, and total landed cost for cross border shipments. Providers are responding with mode shifts, sea air transshipment, and insulated cold chain buffers, yet reliability remains exposed on North Asia corridors and Suez linked routes.
*Our forecasts treat driver/restraint impacts as directional, not additive. The impact forecasts reflect baseline growth, mix effects, and variable interactions.
Segment Analysis
By Service: Multi-Temperature Warehousing Drives Margins as Transport Commoditizes
Domestic Transportation Management accounted for 46.12% in 2025, which reflected the scale of intra-regional trade and the reliance on trucking for the first and last mile across dense city clusters. That share underlined how route tendering and dynamic capacity brokerage are core capabilities as the Asia-Pacific third-party logistics market diversifies load profiles across short-haul and regional lanes. Value-Added Warehousing and Distribution is the fastest-growing service at a 7.84% CAGR in the period to 2031 as shippers shift inventory closer to consumption and expand cold-ready storage for pharmaceuticals and premium foods. The Asia-Pacific third-party logistics market integrates near-customer storage with micro-fulfillment and controlled-temperature handling to raise throughput and preserve product integrity. Providers that offer calibrated environments and validated processes can sustain higher yields relative to ambient storage. Select integrators are pairing VAWD sites with contract logistics for managed replenishment and vendor-managed inventory to stabilize turns and improve working capital. The Asia-Pacific third-party logistics market is also using automated storage and retrieval, high-bay racking, and robot-assisted picking to manage multi-SKU complexity without expanding footprints.
International Transport Management is diversifying across ocean, air, and rail-led intermodal as cost and reliability cycles shift. Red Sea disruptions pushed carriers and shippers to extend routings, which increased cycle times and raised premiums for time-definite freight, a trend 3PLs addressed with refined air allocation and temperature-controlled buffers for sensitive products. On select corridors, rail segments are now linked more seamlessly to trucking and air uplift to meet delivery windows that the ocean could not meet during volatility, which strengthens the role of corridor-specialist 3PLs that orchestrate multimodal schedules. CEVA highlights the role of engineered transport and customs digitization in reducing dwell time and increasing speed to market on cross-border routes, which expands the use cases for intermodal even as ocean schedules normalize. The Asia-Pacific third-party logistics market increasingly prices services on outcomes that blend mode choice, risk buffers, and compliance rather than on single-lane tariffs alone. Domestic and international services are converging around unified control towers that reconcile bookings, visibility, and exceptions across modes and zones.
In this service mix, Domestic Transportation Management accounted for 46.12% of the Asia-Pacific third-party logistics market share in 2025. Value-Added Warehousing and Distribution within the Asia-Pacific third-party logistics market size is projected to grow at 7.84% through 2031 as multi-temperature capacity scales for time-critical loads.


By End-User Industry: Life Sciences Outpaces Retail Despite Smaller Base
Retail and E-commerce contributed 27.94% in 2025, supported by dense order flows that justified extensive automation. JD Logistics’ deployment of automated warehouses across many Chinese cities shows how platform-led investments have lifted service benchmarks that third-party providers mirror in adjacent lanes and cross-border extensions. The Asia-Pacific third-party logistics market uses plug-in fulfillment, returns handling, and post-purchase visibility tools to serve brands that sell through marketplaces and direct-to-consumer stores. The productive frontier in e-commerce logistics now favors providers that combine automated pick with smart batching and route planning for short delivery windows. At the same time, the share of captive fulfillment among platform leaders raises competition for independent 3PLs, which pivot toward cross-border brokerage, duty optimization, and localized last mile for international brands.
Life Sciences and Healthcare is projected to grow at 8.21% through 2031, which reflects rising biologics and clinical trial flows that demand rigorous GDP compliance and reliable cold capacity. DHL’s multi-year program in Asia-Pacific adds pharma hubs and new low and ultra-low range cooling infrastructure, plus upgraded IT for track-and-trace, which improves both throughput and audit readiness for regulated cargo. The Asia-Pacific third-party logistics market also benefits from the adjacent growth in medical devices and lab supplies that need controlled environments and time-specific delivery. Hazardous goods certification, validated packaging, and returns protocols for temperature excursions are becoming table stakes for LSH-focused operators. CEVA’s certifications for lithium battery handling support a broader consumer electronics and mobility value chain, which also needs careful compliance and engineered movements.
Life Sciences and Healthcare within the Asia-Pacific third-party logistics market size is projected to expand at 8.21% CAGR through 2031. Retail and E-commerce’s 27.94% share in 2025 continues to drive density that reinforces the automation curve across major demand hubs.
By Logistics Model: Hybrid Strategies Navigate Trade Volatility
Asset-Light models held 53.41% in 2025, which aligns with shippers’ need for variable cost structures and responsive capacity pooling. oTMS demonstrates how cloud TMS networks can orchestrate thousands of carriers and drivers across multiple markets and standardize tendering, which enables asset-light players to raise service reliability despite owning limited fleets. The Asia-Pacific third-party logistics market relies on lean API integrations with marketplaces and client ERPs to provide instant quotes, automated milestones, and consolidated billing. For SMEs, high-touch service and rapid exception handling can sustain loyalty even as digital price transparency increases, which underpins the asset-light value proposition. At the same time, Asset-Heavy operators are rebalancing networks toward multi-temperature nodes and automated facilities where utilization is defensible, and service premiums offset capital intensity. The Asia-Pacific third-party logistics market is therefore seeing a two-speed evolution in asset deployment and capital allocation.
Hybrid models are the fastest-growing at 7.63% as providers anchor capacity with dedicated fleets and long-term sites while flexing spot capacity to absorb peaks. Nippon Express established a new East Asia regional headquarters effective January 2026 to coordinate infrastructure and resource allocation across a multi-country footprint, which is consistent with a hybrid approach that blends owned and partner capacity. The same group integrated Indonesian ocean and air forwarding arms in March 2026 to streamline customer interfaces and improve service quality, which improves speed to quote and execution efficiency in a volatile market. The Asia-Pacific third-party logistics market is moving toward modular contracts where providers guarantee baseline capacity and performance while adding surge units or lanes on predefined terms. This approach reduces forecasting risk for shippers and improves asset turns for 3PLs. The Asia-Pacific third-party logistics market is also seeing greener fleet pilots and facility retrofits where supportive policy and customer mandates are strong, which slots naturally into hybrid operating models that can absorb range limits and charging cycles with partner carriers.
Hybrid strategies are projected to post a 7.63% CAGR within the Asia-Pacific third-party logistics market through 2031. Asset-Light models continue to command a 53.41% base of activity as orchestration and brokerage remain central to regional trade dynamics.
Geography Analysis
China held 58.74% of the Asia-Pacific third-party logistics market share in 2025, which reflects the scale of its manufacturing base, density of e-commerce fulfillment, and connectivity into regional corridors. DHL’s 2025 disclosures show revenue moderation in several Asia units, including Express and Supply Chain, as macro conditions adjusted, which has shifted some growth emphasis toward Southeast Asia and India in 2026. The Asia-Pacific third-party logistics market is still anchored by Chinese domestic flows that support high automation and large throughput. Providers that link those networks to cross-border lanes with proven customs routines and trackable service levels maintain pricing power. RCEP corridors that run through China and its neighbors are adding predictable rail and road options for categories that value time certainty.
India is the fastest-growing node at an 8.62% projected CAGR, which is supported by policy alignment and digital trade facilitation. India’s single window platform integrates numerous agencies and has reduced declaration times, which supports predictable lead times across import and export flows. The Asia-Pacific third-party logistics market is consequently seeing more providers expand express, B2B contract logistics, and cross-border trucking solutions to serve both Tier 1 and Tier 2 cities. Large integrators and local specialists are adding service centers and upgrading hubs at key airports and ports to meet rising throughput and reliability expectations. The Asia-Pacific third-party logistics market size for India is projected to expand steadily through 2031 as manufacturing-led corridors add new flows in electronics, automotive, and pharmaceuticals.
Southeast Asia remains a diversified growth tier that blends scale markets with rising specialization. The ASEAN Single Window has reduced documentation time for linked members, which benefits 3PLs that handle multi-country shipments and time-critical products.[3]ASEAN Secretariat, “Framework on ASEAN Supply Chain Efficiency and Resilience,” ASEAN, asean.org Thailand’s agricultural logistics remains heavily road-dependent and drives higher cost shares for select crops, which raises the value of route engineering and consolidation for shippers that serve both domestic and export channels. The Asia-Pacific third-party logistics market is also consolidating activity in Singapore, which continues to operate as the nerve center for transshipment and regional control towers in Southeast Asia. Providers use Singapore’s regulatory certainty and connectivity to route high-compliance cargo while positioning distribution centers in lower-cost neighbors for last-mile dispatch. The Asia-Pacific third-party logistics market continues to expand cross-border trucking and short-sea feeder networks across Indonesia, Vietnam, Malaysia, and the Philippines as demand scales.
Competitive Landscape
The market remains fragmented overall, although scale advantages, platform ecosystems, and compliance requirements are gradually concentrating high-value contracts among leading regional and global 3PL providers. The market features a mix of global integrators, large regional operators, and technology-led specialists that compete across service depth, compliance, and capital deployment. DHL’s programmatic investments in Life Sciences and Healthcare across Asia-Pacific illustrate how incumbents are deepening specialization where compliance and reliability extend contract duration and yield. Nippon Express reorganized its East Asia leadership and simplified Indonesian operations, which enhances network cohesion and management accountability across a large geographic theater. The Asia-Pacific third-party logistics market also sees deepening ties between freight forwarding and engineered transport for aerospace and project cargo, which relies on asset access and certifications. CEVA’s expanding aviation logistics relationships and regional distribution mandates align with that strategy and build sticky volumes around specialized verticals.
Technology remains a competitive wedge as control towers and optimization engines determine cost-to-serve at scale. oTMS and Shipsy show how regional SaaS platforms can standardize milestones, automate tendering, and route shipments under tight SLAs for customers that expect consumer-grade visibility. The Asia-Pacific third-party logistics market is tilting toward providers that integrate these layers with warehouse automation and audited processes for pharma and high-value electronics. Digital workflows also simplify cross-border documentation and speed customs clearance in markets where single window systems have matured, which strengthens differentiated propositions for time-sensitive goods. At the same time, the Asia-Pacific third-party logistics market confronts margin pressure in commoditized drayage and low-barrier routes, which pushes operators to climb the value stack or focus on route expertise where dense local knowledge is valuable.
Platform-backed ecosystems add a structural consideration as large marketplaces internalize more fulfillment and transport. JD Logistics’ sustained automation footprint shows how platform scale can lift service bars across key urban centers and alter capacity planning in adjacent third-party networks. Independent 3PLs in the Asia-Pacific third-party logistics market adjust by leaning into cross-border brokerage, heavy-compliance verticals, value-added services, and collaboration with marketplaces through APIs and service-level frameworks. The most resilient operators align selective asset control with partner-based expansion to balance utilization and responsiveness. The Asia-Pacific third-party logistics market is moving toward standardized performance dashboards, auditable compliance, and multi-mode orchestration that links origin to last mile through a unified engagement model. This convergence rewards providers that can document reliability and scale compliance across multiple jurisdictions.
Asia-Pacific Third-Party Logistics (3PL) Industry Leaders
DHL Supply Chain & Global Forwarding
Sinotrans Ltd.
Kintetsu World Express
Nippon Express Holdings
Yusen Logistics (NYK)
- *Disclaimer: Major Players sorted in no particular order

Recent Industry Developments
- March 2026: Nippon Express Holdings integrated its Indonesian business companies, unifying ocean and air freight forwarding to enhance customer value, improve service quality, and increase management efficiency under its One Indonesia strategy.
- February 2026: CEVA Logistics expanded its aviation logistics capabilities with a global air freight partnership and announced it will manage Airbus Helicopters’ Regional Distribution Platform in Asia-Pacific.
- January 2026: Nippon Express Holdings established Nippon Express East Asia Co., Ltd. as a regional headquarters in Shanghai to accelerate resource allocation and strengthen governance across East Asia.


Asia-Pacific Third-Party Logistics (3PL) Market Report Scope
The Asia-Pacific Third-Party Logistics Market Report is Segmented by Service (Domestic Transportation Management, International Transportation Management, Value-Added Warehousing and Distribution (VAWD)), by End-User Industry (Automotive, Energy and Utilities, Manufacturing, Life Sciences and Healthcare, Technology and Electronics, Retail and E-commerce, Consumer Goods and FMCG, Food and Beverages, and Others), by Logistics Model (Asset-Light (Management-Based), Asset-Heavy (Own Fleet and Warehouses), and Hybrid), and by Geography (China, India, Japan, South Korea, Singapore, Vietnam, Indonesia, Australia, and the Rest of Asia-Pacific). The Market Forecasts are Provided in Terms of Value (USD).
| Domestic Transportation Management | Road |
| Air | |
| Others | |
| International Transportation Management | Road |
| Air | |
| Sea | |
| Multimodal / Intermodal | |
| Value-Added Warehousing and Distribution (VAWD) |
| Automotive |
| Energy and Utilities |
| Manufacturing |
| Life Sciences and Healthcare |
| Technology and Electronics |
| Retail and E-commerce |
| Consumer Goods and FMCG |
| Food and Beverages |
| Others |
| Asset-Light (Management-Based) |
| Asset-Heavy (Own Fleet and Warehouses) |
| Hybrid |
| China |
| India |
| Japan |
| South Korea |
| Singapore |
| Vietnam |
| Indonesia |
| Australia |
| Rest of Asia-Pacific |
| By Service | Domestic Transportation Management | Road |
| Air | ||
| Others | ||
| International Transportation Management | Road | |
| Air | ||
| Sea | ||
| Multimodal / Intermodal | ||
| Value-Added Warehousing and Distribution (VAWD) | ||
| By End-User Industry | Automotive | |
| Energy and Utilities | ||
| Manufacturing | ||
| Life Sciences and Healthcare | ||
| Technology and Electronics | ||
| Retail and E-commerce | ||
| Consumer Goods and FMCG | ||
| Food and Beverages | ||
| Others | ||
| By Logistics Model | Asset-Light (Management-Based) | |
| Asset-Heavy (Own Fleet and Warehouses) | ||
| Hybrid | ||
| By Geography | China | |
| India | ||
| Japan | ||
| South Korea | ||
| Singapore | ||
| Vietnam | ||
| Indonesia | ||
| Australia | ||
| Rest of Asia-Pacific | ||


Key Questions Answered in the Report
What is the size and growth outlook for the Asia-Pacific third-party logistics market through 2031?
The Asia-Pacific third-party logistics market size was USD 431.38 billion in 2025 and is projected to reach USD 726.90 billion by 2031 at a 7.6% CAGR over 2026-2031.
Which service category will grow the fastest in the Asia-Pacific third-party logistics market?
Value-Added Warehousing and Distribution is projected to be the fastest-growing service at a 7.84% CAGR to 2031 as multi-temperature and micro-fulfillment capabilities scale.
Which end-user segment leads demand in the Asia-Pacific third-party logistics market
Retail and E-commerce contributed 27.94% in 2025, supported by dense order flows and automation-led fulfillment, while Life Sciences and Healthcare shows the highest growth trajectory.
What operating model is gaining the most momentum in the Asia-Pacific third-party logistics market
Hybrid strategies are projected to grow at 7.63% as providers balance dedicated assets with flexible brokerage to handle volatility and peak demand.
Which geography offers the fastest expansion in the Asia-Pacific third-party logistics market
India is projected to expand at an 8.62% CAGR, supported by manufacturing shifts and trade facilitation through a national single window.
How are leading providers differentiating in the Asia-Pacific third-party logistics market
Providers are deepening specialization in regulated chains like pharma, investing in automation, aligning with digital control towers, and standardizing cross-border compliance programs.
Page last updated on:


