Market Overview
| Study Period | 2020 - 2031 |
|---|---|
| Forecast Data Period | 2026 - 2031 |
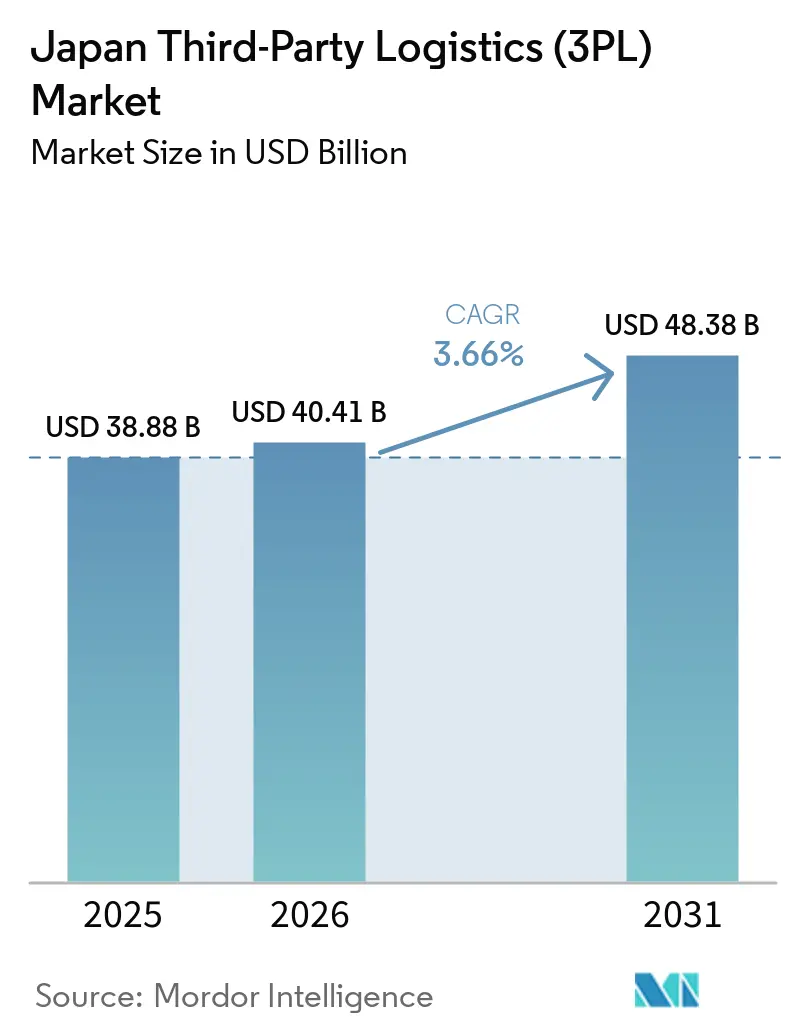
| Base Year Market Size (2025) | USD 38.88 Billion |
| Market Size (2026) | USD 40.41 Billion |
| Market Size (2031) | USD 48.38 Billion |
| Growth Rate (2026 - 2031) | 3.66% CAGR |
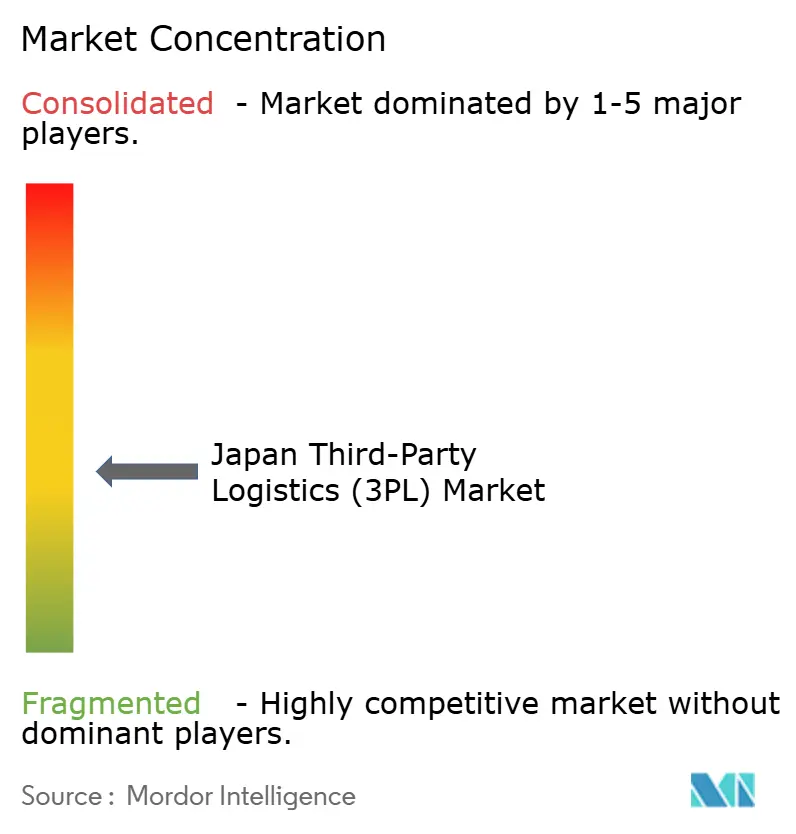
| Market Concentration | Medium |
Major Players
*Disclaimer: Major Players sorted in no particular order Image © Mordor Intelligence. Reuse requires attribution under CC BY 4.0. |
|
Japan Third-Party Logistics (3PL) Market Analysis by Mordor Intelligence
The Japan third-party logistics market size is expected to increase from USD 38.88 billion in 2025 to USD 40.41 billion in 2026 and reach USD 48.38 billion by 2031, growing at a CAGR of 3.66% over 2026-2031.
Cross-border commerce, government digitalization subsidies, and urban sustainability mandates are reshaping fulfillment models toward real-time inventory visibility and flexible capacity. Operators are investing in bonded facilities at Narita and Kansai airports, automated micro-fulfillment centers in railway stations, and electric vehicle fleets for inner-city routes, all of which compress delivery lead times while elevating capital requirements. The Ministry of Economy, Trade and Industry’s Smart Logistics Service program and DX tax credits reduce payback periods on warehouse automation to roughly four years, accelerating technology adoption among mid-tier providers. Retailers shifting to unified omnichannel inventory pools are fueling demand for elastic 3PL capacity, while semiconductor expansion in Kyushu is spawning specialized clean-room logistics. Despite steady growth, compliance costs linked to digital tachographs, cyber-insurance premiums, and night-time noise ordinances continue to squeeze smaller carriers.
Key Report Takeaways
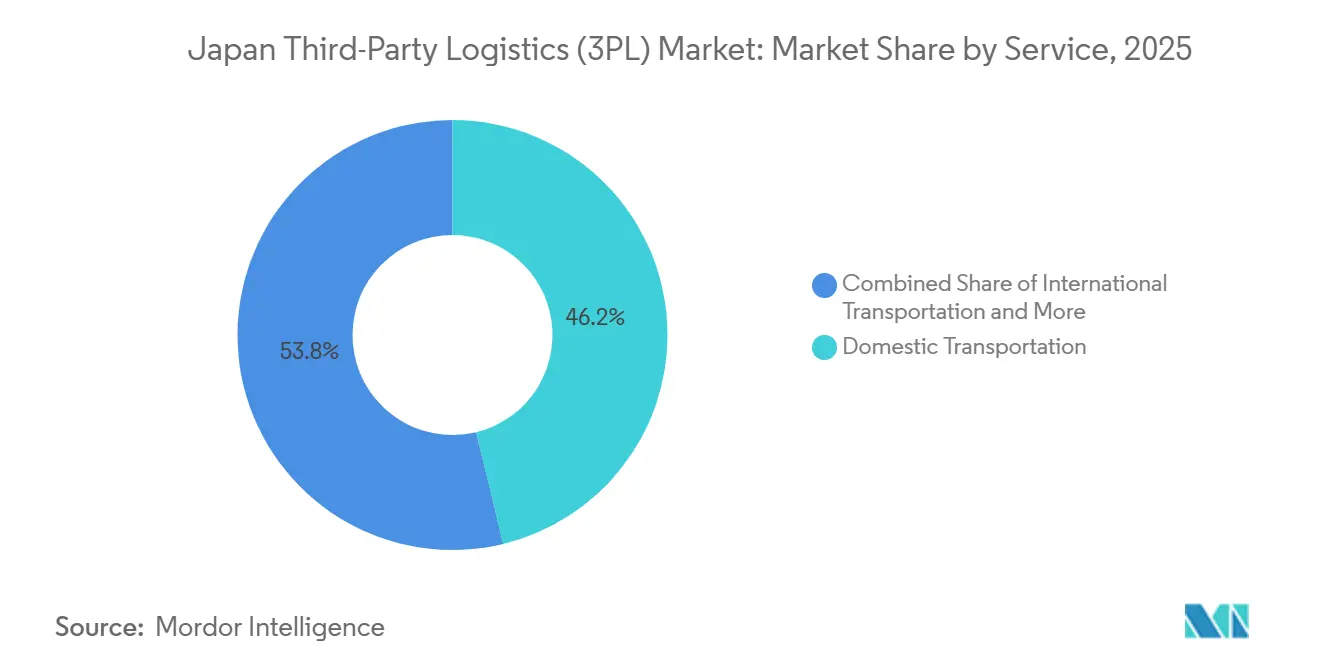
- By service, domestic transportation management held 46.20% of Japan third-party logistics (3PL) market share in 2025, while value-added warehousing and distribution is projected to expand at a 4.17% CAGR through 2031.
- By end user, manufacturing led the Japan third-party logistics market with 30.13% market share in 2025, while life sciences and healthcare are advancing at a 5.73% CAGR through 2031.
- By logistics model, asset-heavy players retained 41.18% market share of the Japan third-party logistics market in 2025; asset-light models are growing fastest at a 4.41% CAGR through 2031.
- By geography, Kanto accounted for 68.20% of the Japan third-party logistics market in 2025; Kyushu & Okinawa are forecast to grow at a 5.15% CAGR to 2031 as semiconductor investment escalates.
Note: Market size and forecast figures in this report are generated using Mordor Intelligence’s proprietary estimation framework, updated with the latest available data and insights as of 2026.
Japan Third-Party Logistics (3PL) Market Trends and Insights
Drivers Impact Analysis*
| Driver | (~) % Impact on CAGR Forecast | Geographic Relevance | Impact Timeline |
|---|---|---|---|
| Cross-Border E-Commerce Surge Forcing High-Throughput Fulfilment Partnerships | +1.1% | National, with concentration in Kanto and Kansai gateway regions | Short term (≤2 years) |
| Government "Smart Logistics Service" Subsidies and DX Tax Breaks Accelerating Tech Adoption | +0.9% | National | Medium term (2-4 years) |
| Retailer Shift to Unified Omnichannel Inventories Creating Demand for Elastic 3PL Capacity | +0.8% | National, with early adoption in metropolitan areas | Medium term (2-4 years) |
| Corporate Fleet-Electrification Mandates Catalysing EV-Based Urban 3PL Solutions | +0.6% | Urban centers (Tokyo, Osaka, Nagoya) | Medium term (2-4 years) |
| Railway-Station Micro-Fulfilment Roll-outs Unlocking Same-Hour Delivery Niches | +0.5% | Metropolitan areas with dense rail networks | Short term (≤2 years) |
| AI-Enabled Demand-Sensing Platforms Driving Data-Sharing Contracts with Lead 3PLs | +0.7% | National, with early adoption among large retailers | Medium term (2-4 years) |
| Source: Mordor Intelligence | |||


Cross-Border E-Commerce Surge Forcing High-Throughput Fulfillment Partnerships
Japan’s cross-border e-commerce imports climbed to USD 27.8 billion in 2025, with Chinese platforms accounting for roughly two-thirds of volume. Bonded facilities at Narita and Kansai now pre-position inventory so that platforms such as Temu and Shein can meet 48-hour customs-to-door delivery targets. Yamato Global Logistics opened a 45,000-square-meter bonded warehouse at Narita in March 2025 capable of processing 120,000 parcels per day. Apparel and electronics drove 38% year-over-year import growth in 2025, intensifying price competition for domestic retailers. For 3PLs, competitive advantage hinges on multilingual customer service teams, integrated customs brokerage, and scalable reverse-logistics solutions[1]“Japan's Cross-Border E-Commerce Statistics 2025,” Japan External Trade Organization, jetro.go.jp.
Government Smart Logistics Service Subsidies and DX Tax Breaks Accelerating Tech Adoption
The DX Investment Promotion Tax System grants a 3-5% credit on qualified logistics IT outlays, while Smart Logistics Service subsidies disbursed JPY 18.7 billion (USD 119.71 million) across 247 projects in fiscal 2025. Sagawa Express deployed a nationwide cloud-based TMS, boosting vehicle utilization by 14% and trimming 2.8 million empty kilometers annually. Subsidies favor CO₂-reduction projects, catalyzing collaboration among parcel carriers that cut overlapping routes by 23% in Osaka pilots. By shortening automation payback periods to near three years, these incentives are accelerating warehouse robotics and AI route optimization adoption across mid-tier operators[2]“Smart Logistics Service Initiative,” Ministry of Economy, Trade and Industry, meti.go.jp.
Retailer Shift to Unified Omnichannel Inventories Creating Demand for Elastic 3PL Capacity
Seven and i Holdings integrated store and online stock across 21,000 7-Eleven outlets and Ito-Yokado supermarkets, requiring Nippon Express to build a real-time visibility platform that merges POS data with WMS and last-mile routing. Uniqlo’s partnership with Hitachi Transport System improved online fill rates to 98.7% while slicing inventory holding costs by 18%. Dark-store pilots for rapid grocery delivery amplify demand for multi-temperature storage and flexible labor pools. Japan third party logistics market operators with multi-tenant warehouses and scalable labor models are best positioned to capture these variable-demand contracts.
Corporate Fleet-Electrification Mandates Catalyzing EV-Based Urban 3PL Solutions
Tokyo’s rule that 30% of commercial light-duty vehicles in its 23 wards be zero-emission by 2030 is nudging operators toward electric fleets. Sagawa Express plans to electrify about 7,200 vehicles, while Isuzu is rolling out battery trucks with 200-kilometer ranges. METI allocated JPY 12 billion (USD 76.82 million) in 2025 to install 3,000 fast chargers at logistics sites, easing infrastructure barriers. Total cost of ownership is now near parity on dense urban routes, giving early adopters a cost edge in the Japan third party logistics market.
Restraints Impact Analysis*
| Restraint | (~) % Impact on CAGR Forecast | Geographic Relevance | Impact Timeline |
|---|---|---|---|
| Enforcement of Mandatory Driver Rest Break Digital Tachographs Raising Cost Base | -0.8% | National | Short term (≤2 years) |
| Acute Shortage of Cold-Chain Technicians Limiting Biopharma Logistics Growth | -0.6% | National, with acute impact in pharmaceutical manufacturing hubs | Medium term (2-4 years) |
| Escalating Cyber-Insurance Premiums After 2025 Ransomware Wave Hitting Mid-Tier 3PLs | -0.5% | National, with higher impact on digitally-integrated operators | Short term (≤2 years) |
| Municipal Night-Time Noise Ordinances Restricting Late-Hour Urban Freight Windows | -0.4% | Urban centers (Tokyo, Osaka, Nagoya, Fukuoka) | Medium term (2-4 years) |
| Source: Mordor Intelligence | |||
Enforcement of Mandatory Driver Rest Break Digital Tachographs Raising Cost Base
All commercial trucks over 3.5 tons had to install digital tachographs from April 2024, costing roughly JPY 180,000 (USD 1,152.35) per vehicle plus data management expenses. Fukuyama Transporting’s rollout across 4,800 units required JPY 864 million (USD 5.53 million) in capital and shaved fleet utilization by 6-8%. Some operators are diverting long-haul freight to rail, lifting JR Freight container volumes 12% on Tokyo-Osaka lanes in 2025[3]“Digital Tachograph Regulations,” Ministry of Land, Infrastructure, Transport and Tourism, mlit.go.jp.
Acute Shortage of Cold-Chain Technicians Limiting Biopharma Logistics Growth
GDP certification, effective April 2025, obliges all temperature-controlled pharma handlers to train staff in thermal mapping and deviation management. Yet Japan faces a deficit of about 2,400 certified technicians. Nichirei Logistics struggled to fill 180 positions in 2025 despite 25% premium wages. Capacity additions in ultra-cold storage will therefore lag demand until at least 2027, constraining one of the fastest-growing segments of the Japan third party logistics industry[4]"GDP Certification Requirements." PMDA, www.pmda.go.jp/english/..
*Our forecasts treat driver/restraint impacts as directional, not additive. The impact forecasts reflect baseline growth, mix effects, and variable interactions.
Segment Analysis
By Service: Fulfillment Complexity Drives Warehousing Premium
Value-added warehousing and distribution captured 4.17% CAGR from 2026 to 2031, while domestic transportation management maintained 46.20% of the Japan third-party logistics (3PL) market share in 2025. The premium on services such as kitting, labeling, and reverse logistics is widening margins to around 8.2%, nearly double basic transport. Road freight still handles roughly 85% of domestic tonnage but is capacity-constrained by driver shortages and tachograph enforcement. Rail freight volumes increased 9% in 2025 as shippers sought alternatives. International transportation management remains volatile, with air volumes down 6% in 2025 and sea freight up 3% on automotive parts and e-commerce flows.
Warehouse demand is inflating rents in Tokyo Bay’s core to JPY 5,200 per tsubo monthly, pushing developers to Ibaraki and Gunma, where land is half the price but adds up to 90 minutes to city-center transit. The Japan third-party logistics (3PL) market size for warehousing services is therefore projected to be the fastest-growing component through 2031. Operators integrating robotics and AI picking are reducing labor intensity and qualifying for government DX tax credits, bolstering ROI on new facilities.


By End-User Industry: Pharmaceutical Precision Commands Growth Premium
Manufacturing held 30.13% of Japan third party logistics market share in 2025, yet life sciences and healthcare are forecast to post the highest 5.73% CAGR through 2031. GDP mandates and biologics growth spur demand for validated cold-chain networks, with Toyo Suisan’s healthcare joint venture logging 12% revenue growth and 9.4% margins. Retail and e-commerce are reshaping operations with omnichannel requirements, while automotive faces softer demand due to production shifts abroad. Semiconductor expansions in Kyushu add specialized chemical and ultra-pure gas logistics, offsetting some automotive weakness and further diversifying demand streams in the Japan third party logistics market.
The food and beverages sector is consolidating as Ajinomoto and Kirin outsource logistics, shifting fixed assets to specialized 3PLs that provide temperature-controlled distribution. Technology and electronics shipments benefit from clean-room protocols and white-glove handling, commanding service premiums that exceed standard tariffs by up to 25%.

By Logistics Model: Platform Economics Favor Asset-Light Scaling
Asset-heavy providers retained 41.18% Japan third-party logistics market share in 2025 due to network density and capacity assurance. However, asset-light models are scaling revenue at a 4.41% CAGR by orchestrating third-party fleets and warehouses through digital platforms. Mitsui-Soko’s divestiture of non-core warehouses to redeploy capital toward IT illustrates the shift. Hybrid structures are spreading as firms hold strategic facilities but outsource overflow to spot capacity, mitigating cost spikes when demand peaks by leveraging data-driven procurement. During peak Golden Week 2025, spot truck rates climbed nearly 35%, underscoring why Japan third party logistics market participants favor flexible models.
Regulatory backing for collaborative delivery platforms also encourages asset-light adoption. The MLIT-supported shared-route pilots in Osaka cut vehicle trips 23% while preserving service levels, signalling official support for capacity-pooling ecosystems that underlie asset-light economics.
Geography Analysis
Warehouse stock in Kanto underpins 68.20% of Japan third party logistics market share in 2025, reinforced by Narita and Haneda airports handling 3.2 million tons of cargo. Vacancies for Class-A facilities averaged 1.8%, and rents rose 18% year-over-year. To contain costs, developers are pushing projects to Ibaraki and Gunma, where land prices are up to 50% lower, but add travel time. Micro-fulfillment centers in railway stations are shortening last-mile lead times to as little as 45 minutes and are enabled by electric cargo bikes that bypass traffic.
Kyushu and Okinawa is the fastest-growing cluster with a 5.15% CAGR to 2031, catalyzed by TSMC’s and Sony’s semiconductor fabs in Kumamoto that require clean-room logistics and just-in-time deliveries. Fukuoka Airport’s planned 200,000-ton cargo terminal due in 2027 will expand lift capacity, while Kagoshima’s agricultural exports call for cold-chain deployments supported by prefectural incentives.
Kansai anchors the second-largest regional share, leveraging overnight truck reach to 70% of the population and Kansai International Airport’s 890,000-ton throughput. Pharmaceutical hubs around Osaka bolster demand for GDP-compliant storage. Chubu remains vital for automotive sequencing but saw vehicle output dip 4% in 2025 amid offshore migration. Tohoku and Hokkaido specialize in seafood and dairy logistics to metropolitan markets, while Chugoku and Shikoku support petrochemical and marine cargo niches, yet their lower population density limits overall scale within the Japan third party logistics market size.
Competitive Landscape
The top players, Nippon Express, Yamato Holdings, Sagawa Express, Kintetsu World Express, and NYK Line, collectively control roughly 38% of Japan's third-party logistics market revenue. Competitive edge is shifting toward proprietary IT, with Nippon Express investing USD 45 million in autonomous trucking via Gatik to maintain margin despite rising labor costs. Yamato’s 3,800 service centers and 60,000-vehicle fleet preserve customer-service uniformity, yet scale alone no longer guarantees advantage as digital freight platforms match spot demand with idle capacity.
White-space entrants specialize in GDP-certified cold chain, micro-fulfillment, and hazardous materials. Alps Logistics dominates automotive parts sequencing, while Sankyu excels in petrochemicals requiring dangerous-goods protocols. Twelve M&A deals closed in 2025 as mid-tier firms, unable to finance electric fleets or warehouse robotics, sought buyers. Japan Post’s 19.9% stake in LOGISTEED exemplifies convergence between postal networks and large-scale 3PLs, aiming for seamless domestic-international coverage.
Technology partnerships further differentiate leaders. Sagawa’s collaboration with Google Cloud applies AI to route design and demand forecasting. METI-subsidized standardization of data interfaces promotes ecosystem interoperability, cementing IT capability as a prerequisite for long-term contracts in the Japan third party logistics industry.
Japan Third-Party Logistics (3PL) Industry Leaders
-
Nippon Express Co., Ltd.
-
Yamato Holdings Co., Ltd.
-
Kintetsu World Express, Inc.
-
Sagawa Express Co., Ltd.
-
NYK Line (including Yusen Logistics Co., Ltd.)
- *Disclaimer: Major Players sorted in no particular order

Recent Industry Developments
- April 2026: Yamato Transport Co., Ltd. unveiled a new integrated business solutions hub in Tokyo's Koto-ku, specifically in the Shinonome district, merging sorting and transportation functions for nationwide logistics centers with additional logistics operations, set to roll out in phases starting June 2026.
- October 2025: Japan Post Holdings acquired a 19.9% stake in LOGISTEED to integrate nationwide last-mile delivery with LOGISTEED’s 3PL platform.
- October 2025: LOGISTEED and Japan Post subsidiaries formed a strategic alliance to provide end-to-end domestic and cross-border 3PL services.
- October 2025: SG Holdings purchased semiconductor-focused forwarder Morrison Express, enhancing high-tech vertical specialization.


Research Methodology Framework and Report Scope
Market Definitions and Key Coverage
Our study defines Japan's third-party logistics market as the revenue earned by independent providers that manage at least one core logistics function (domestic or international transport management, or value-added warehousing and distribution) for external customers across all prefectures. The valuation covers contractual flows inside the country and cross-border shipments that start or end in Japan.
We omit captive in-house fleets, stand-alone freight brokers without process control, and purely postal parcel services.
Segmentation Overview
-
By Service
-
Domestic Transportation Management
- Road
- Rail
- Air
- Inland Waterway
-
International Transportation Management
- Air
- Sea
- Others
- Value-Added Warehousing and Distribution (VAWD)
-
Domestic Transportation Management
-
By End-User Industry
- Automotive
- Energy and Utilities
- Manufacturing
- Life Sciences and Healthcare
- Technology and Electronics
- Retail and E-commerce
- Consumer Goods and FMCG
- Food and Beverages
- Others
-
By Logistics Model
- Asset-Light (Management-Based)
- Asset-Heavy (Own Fleet and Warehouses)
- Hybrid
-
By Region (Japan)
- Kanto
- Kansai
- Chubu
- Kyushu and Okinawa
- Chugoku
- Shikoku
- Hokkaido
- Tohoku
Detailed Research Methodology and Data Validation
Primary Research
Interview dialogues with 3PL executives, procurement managers at manufacturers and e-commerce retailers, and regional fleet cooperatives across Kanto, Kansai, and Kyushu validated rate movements and service mix shifts. Online surveys with shippers filled the remaining information gaps.
Desk Research
We began with transport ministry freight statistics, Japan Customs trade tables, and Bank of Japan Tankan production indices, which supplied baseline shipment volumes and price markers. Association portals such as JAFA and the Japan Trucking Association offered mode splits, driver demographics, and cold-chain capacity data.
Additional intelligence came from company filings accessed through D&B Hoovers, news feeds inside Dow Jones Factiva, and automation patent trends via Questel, letting us trace cost curves and technology uptake. The sources mentioned are illustrative, and many more were reviewed for triangulation, validation, and clarification.
Market-Sizing & Forecasting
We start with a top-down build that converts national production, import, and export pools into logistics spending through mode-specific cost ratios. Supplier roll-ups of sampled contract rates multiplied by handled tonnage act as bottom-up cross-checks that refine totals. Core drivers in the model include parcel throughput, industrial output, diesel price, warehouse rent index, driver wage index, and refrigerated truck fleet count. Driver paths are forecast using multivariate regression with ARIMA overlays to catch seasonality, and scenario bands incorporate the 2024 work-hour cap and carbon levy outlook.
Data Validation & Update Cycle
Outputs undergo variance scans against external indicators, peer review by a second analyst, and a pre-release refresh whenever fuel or regulatory shocks occur. Mordor analysts revisit every dataset annually, ensuring clients always receive the most current view.
Why Mordor's Japan Third Party Logistics Baseline Commands Reliability
Published estimates often diverge because publishers mix service baskets, convert currencies differently, or freeze models for multiple years.
Our numbers stand apart since we exclude postal delivery revenue, apply live yen averages before conversion, and rebuild the model each year with direct shipper feedback.
Benchmark comparison
| Market Size | Anonymized source | Primary gap driver |
|---|---|---|
| USD 38.88 B (2025) | Mordor Intelligence | Not applicable |
| USD 66.70 B (2024) | Global Consultancy A | Includes postal and 4PL revenue, two-year-old inputs |
| USD 56.34 B (2023) | Regional Consultancy B | Relies on regional growth factor, limited Japan variables |
| USD 42.51 B (2024) | Industry Insight Firm C | Omits international legs managed by Japanese 3PLs |
Together, these contrasts show that when scope, variables, and cadence are disciplined, Mordor Intelligence delivers a balanced baseline that decision-makers can trust.


Key Questions Answered in the Report
What is the current value of the Japan third party logistics market?
It stands at USD 40.41 billion in 2026 and is projected to reach USD 48.38 billion by 2031.
Which service segment is growing fastest?
Value-added warehousing and distribution is expanding at a 4.17% CAGR through 2031, driven by omnichannel and cold-chain demand.
Why is Kyushu considered a high-growth region?
Semiconductor fabs in Kumamoto are generating specialized clean-room and just-in-time logistics, lifting regional CAGR to 5.15% through 2031.
How are government policies influencing logistics digitalization?
DX tax credits and Smart Logistics Service subsidies shorten automation payback periods to roughly four years, accelerating adoption of WMS, TMS, and robotics.
What challenges do 3PLs face with cold-chain expansion?
A shortage of about 2,400 certified technicians and strict GDP requirements limit capacity additions for biologics and cell-therapy logistics.
Are electric vehicles economically viable for urban delivery fleets?
On dense city routes, total cost of ownership for electric light-duty trucks has reached parity with diesel units thanks to falling battery prices and operating savings.
Page last updated on:


