Market Overview
| Study Period | 2021 - 2031 |
|---|---|
| Forecast Data Period | 2026 - 2031 |
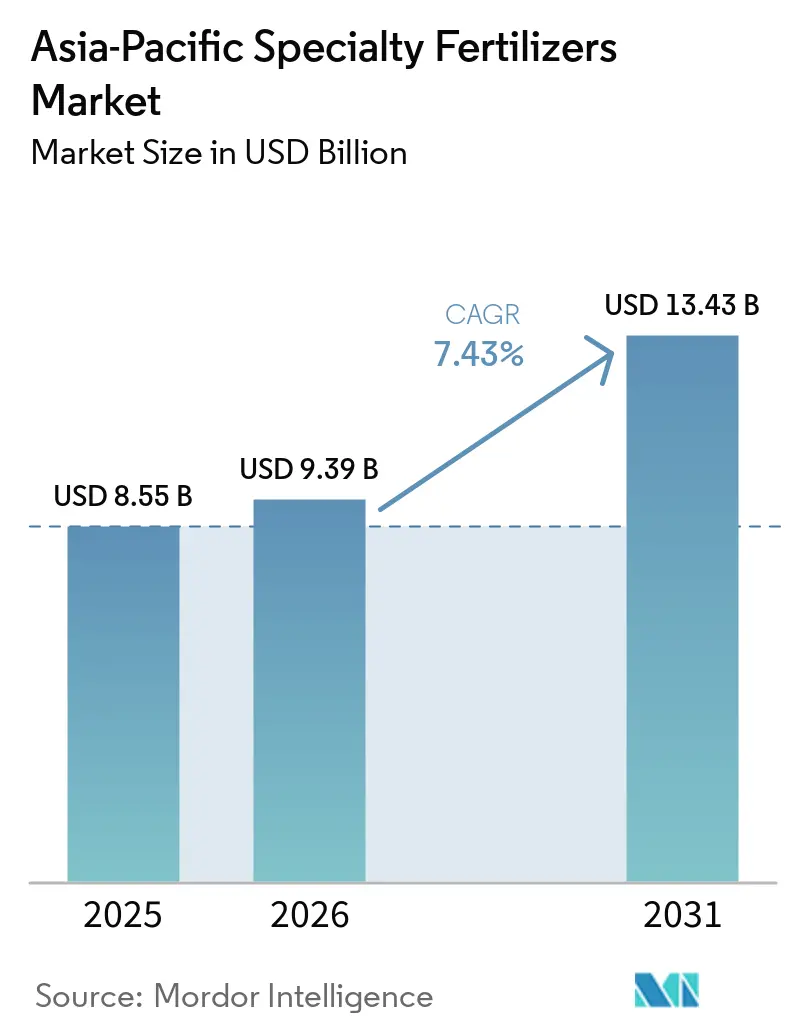
| Base Year Market Size (2025) | USD 8.55 Billion |
| Market Size (2026) | USD 9.39 Billion |
| Market Size (2031) | USD 13.43 Billion |
| Growth Rate (2026 - 2031) | 7.43% CAGR |
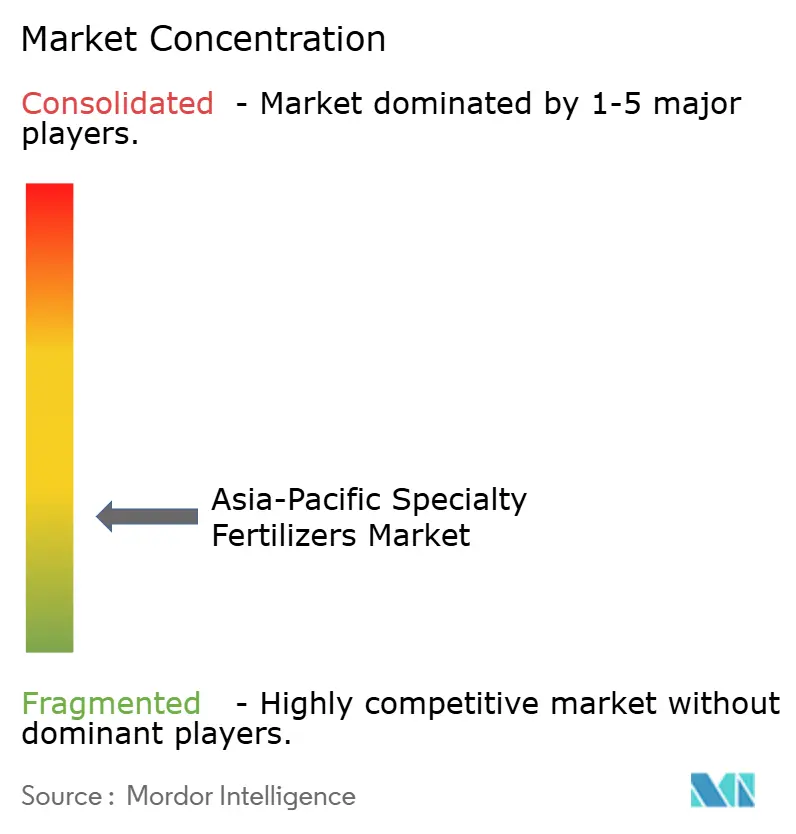
| Market Concentration | Low |
Major Players *Disclaimer: Major Players sorted in no particular order Image © Mordor Intelligence. Reuse requires attribution under CC BY 4.0. | |
Asia-Pacific Specialty Fertilizers Market Analysis by Mordor Intelligence
The Asia-Pacific specialty fertilizer market size was valued at USD 8.55 billion in 2025 and estimated to grow from USD 9.39 billion in 2026 to reach USD 13.43 billion by 2031, at a CAGR of 7.43% during the forecast period (2026-2031). Rising precision-agriculture investments, supportive nutrient-efficiency policies, and widening soil-health programs are expanding the Asia-Pacific specialty fertilizer market footprint while tightening links between agronomic performance and environmental compliance. Liquid formulations dominate current demand because automated fertigation systems now blanket large irrigated areas in China and India, enabling uniform, water-efficient nutrient delivery that reduces waste and boosts yields. Controlled-release technologies are gaining momentum as climate policies reward nitrous oxide abatement and as carbon credit pilots pay growers for measurable emission cuts. Expansion of greenhouse vegetables and export-oriented fruit drives higher micronutrient use, while e-commerce platforms lower access barriers for the region’s 450 million smallholders by offering credit and tailored advisory services. Simultaneously, volatile polymer and potash prices threaten producer margins, and pending microplastic-coating bans in South Korea and Thailand heighten compliance costs, yet ongoing research into biodegradable coatings and policy-backed farmer incentives underpin steady growth across the Asia-Pacific specialty fertilizer market.
Key Report Takeaways
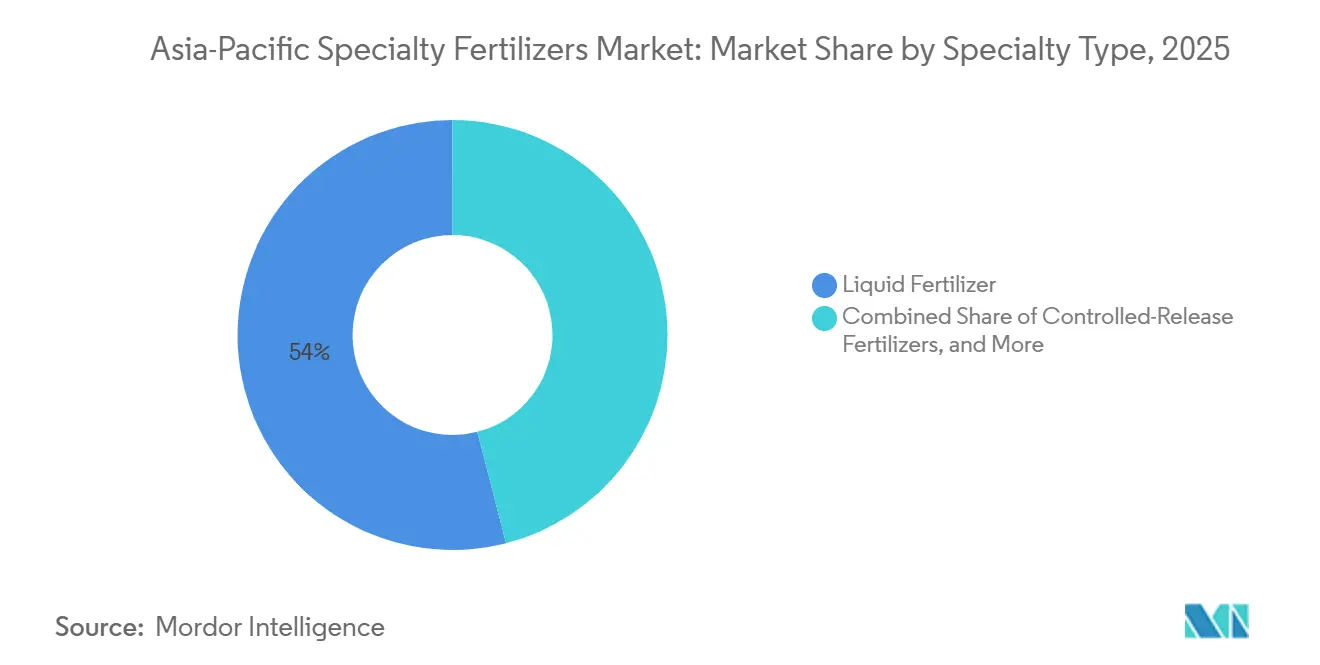
- By Specialty Type, liquid fertilizers held the largest segment, 54.0% of the Asia-Pacific specialty fertilizer market share in 2025, while controlled-release products posted the fastest 7.8% CAGR through 2026 to 2031.
- By Application Mode, fertigation led the market, accounting for 52.0% of the Asia-Pacific specialty fertilizer market size in 2025, while soil application registered the fastest growth, with a 6.9% CAGR from 2026 to 2031.
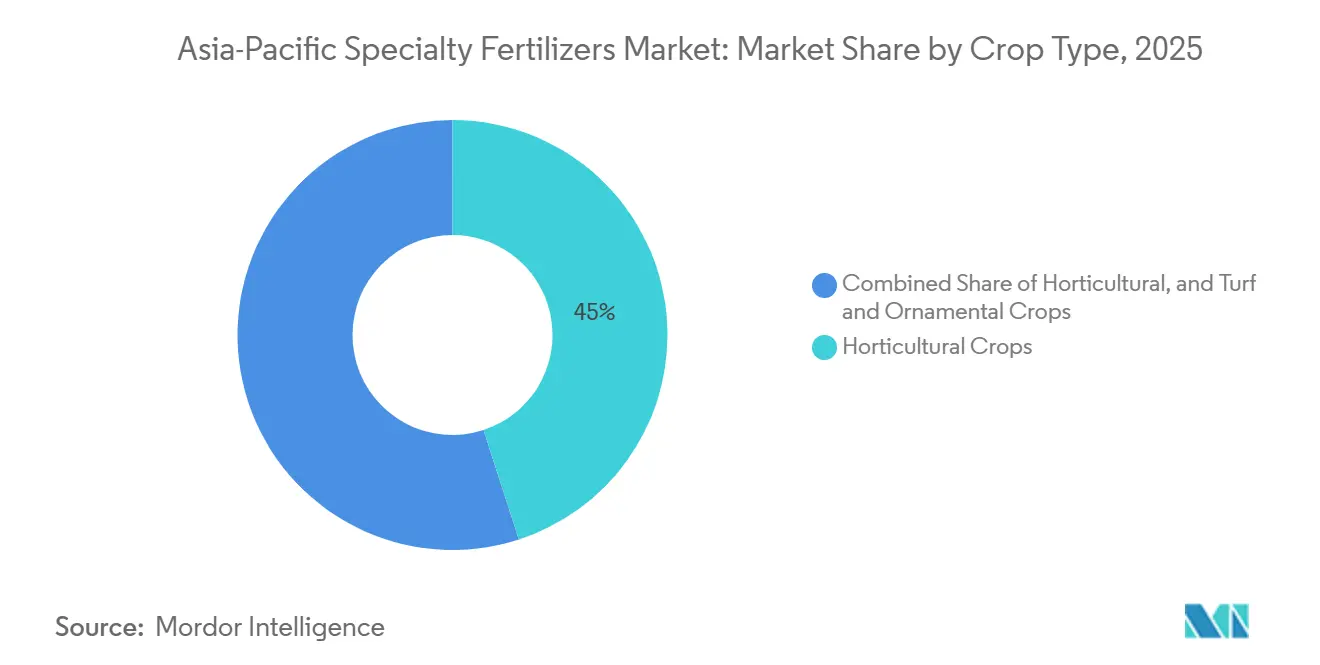
- By Crop Type, horticultural crops hold the largest segment, commanding a 45.0% share of the Asia-Pacific specialty fertilizer market in 2025, whereas turf and ornamental is the fastest-growing, expanding at an 8.2% CAGR between 2026 and 2031.
- By geography, China held a 63.0% share of the Asia-Pacific specialty fertilizer market in 2025, and India recorded the fastest 7.4% CAGR through 2031.
Note: Market size and forecast figures in this report are generated using Mordor Intelligence’s proprietary estimation framework, updated with the latest available data and insights as of 2026.
Asia-Pacific Specialty Fertilizers Market Trends and Insights
Drivers Impact Analysis*
| Driver | (~) % Impact on CAGR Forecast | Geographic Relevance | Impact Timeline |
|---|---|---|---|
| Precision fertigation adoption | +1.8% | China, India, and Australia core markets | Medium term (2-4 years) |
| Government nutrient-efficiency incentives | +1.5% | Japan, Australia, and Korea, with spillover to the Asian | Short term (≤ 2 years) |
| Shift to high-value horticulture | +1.2% | Global Asia-Pacific, concentrated in the Chinese greenhouse belt | Long term (≥ 4 years) |
| Soil micronutrient depletion | +1.0% | India, Bangladesh, and Pakistan, with expansion to Southeast Asia | Long term (≥ 4 years) |
| E-commerce access to niche inputs | +0.8% | Indonesia, Philippines, and Vietnam smallholder regions | Medium term (2-4 years) |
| Carbon-credit backed N₂O-reduction demand | +0.6% | Vietnam, Thailand, with early adoption in developed Asia-Pacific markets | Long term (≥ 4 years) |
| Source: Mordor Intelligence | |||
Precision Fertigation Adoption
Precision fertigation adoption is reshaping the Asia-Pacific specialty fertilizer landscape by creating demand for water-soluble and liquid formulations that integrate seamlessly with automated irrigation systems. China's National Development and Reform Commission allocated USD 2.8 billion in 2024 for water-fertilizer integration projects, targeting 5 million hectares of new fertigation infrastructure by 2027[1]Source: National Development and Reform Commission, “Water-Fertilizer Integration Investment Program,” ndrc.gov.cn. This policy push reflects the technology's proven ability to reduce fertilizer consumption by 20-30% while increasing crop yields by 15-25% compared to broadcast applications. The economic advantage becomes particularly compelling for high-value crops where fertigation systems can deliver targeted micronutrient blends during critical growth stages, optimizing both plant nutrition and resource utilization.
Government Nutrient-Efficiency Incentives
Government incentive programs across developed Asia-Pacific markets are creating artificial demand premiums for controlled-release and enhanced-efficiency fertilizers through direct subsidies and tax relief mechanisms. Japan's K Program, launched in 2024 with JPY 250 billion (USD 1.68 billion) in funding, designates specialty fertilizers as critical agricultural products eligible for 50% cost-sharing support. This policy intervention effectively eliminates the price premium that historically limited controlled-release fertilizer adoption, creating a structural shift in demand patterns that extends beyond market fundamentals.
Shift to High-Value Horticulture
The structural shift toward high-value horticultural crops across Asia-Pacific is creating concentrated demand for specialty fertilizers in regions where traditional field crops previously dominated agricultural landscapes. China's greenhouse vegetable area expanded to 1.2 million hectares in 2024, with controlled-environment production systems requiring precise nutrient management that favors water-soluble and liquid formulations. This transition reflects economic fundamentals where greenhouse tomatoes generate USD 25,000-40,000 per hectare compared to USD 800-1,200 for rice, creating economic capacity to absorb specialty fertilizer premiums that would be prohibitive for commodity crops. The trend extends beyond protected cultivation to include fruit production systems where precision nutrition directly impacts quality parameters that determine market premiums.
Soil Micronutrient Depletion
Chronic micronutrient deficiencies across Asia-Pacific soils are creating non-discretionary demand for specialty fertilizer products as conventional NPK applications fail to address yield-limiting nutritional constraints. India's comprehensive soil testing program revealed zinc deficiency in 48% of agricultural soils and boron deficiency in 33%, with deficiency rates increasing annually due to intensive cropping without micronutrient replacement. This depletion trend creates a structural market opportunity for chelated micronutrient products that remain plant-available in alkaline soils where conventional sulfate forms precipitate and become unavailable.
Restraints Impact Analysis*
| Restraint | (~) % Impact on CAGR Forecast | Geographic Relevance | Impact Timeline |
|---|---|---|---|
| High upfront product cost | -1.2% | Global Asia-Pacific, most severe in smallholder-dominated regions | Short term (≤ 2 years) |
| Polymer and potash price volatility | -0.8% | Global supply chain impact with concentration in import-dependent markets | Medium term (2-4 years) |
| Emerging microplastic-coating bans | -0.6% | South Korea, Thailand leading with regional spillover anticipated | Long term (≥ 4 years) |
| Cold-chain gaps for liquid products | -0.4% | Southeast Asia tropical regions, rural distribution networks | Medium term (2-4 years) |
| Source: Mordor Intelligence | |||
High Upfront Product Cost
The 200-400% price premium of specialty fertilizers over conventional NPK creates significant adoption barriers, particularly among smallholder farmers who represent 80% of Asia-Pacific agricultural producers and operate with limited access to credit and risk management tools. Controlled-release urea typically costs USD 800-1,200 per tonne compared to USD 300-400 for conventional urea, requiring farmers to invest 2-3 times more working capital for fertilizer purchases.[2]Source: International Fertilizer Association, “Fertilizer Price Analysis,” fertilizer.org This cost differential becomes particularly challenging for rice and wheat producers, where commodity prices provide limited margin to absorb input cost increases, creating a structural barrier to adoption that persists despite proven agronomic benefits.
Polymer and Potash Price Volatility
Polymer and potash price volatility creates significant margin pressure for specialty fertilizer manufacturers while introducing unpredictable cost fluctuations that complicate farmer purchasing decisions and distributor inventory management. Polymer prices increased 45% during 2024 due to supply chain disruptions affecting ethylene and propylene feedstocks, directly impacting controlled-release fertilizer production costs. This volatility is particularly problematic for manufacturers operating on contract pricing models where input cost increases cannot be immediately passed through to customers, creating periods of negative margins that threaten long-term investment in specialty product development.
*Our forecasts treat driver/restraint impacts as directional, not additive. The impact forecasts reflect baseline growth, mix effects, and variable interactions.
Segment Analysis
By Specialty Type: Liquid Fertilizers Lead Through Fertigation Integration
Liquid fertilizers dominate the Asia-Pacific specialty fertilizer market share, accounting for 54.0% in 2025, driven by their seamless compatibility with precision fertigation systems that are expanding rapidly across the region's intensive agricultural areas. The segment's leadership position reflects the fundamental advantage of liquid formulations in automated application systems where precise nutrient metering and uniform distribution are critical for optimizing crop performance.
Controlled-release fertilizers represent the fastest-growing segment, with a 7.8% CAGR through 2026 to 2031, as environmental regulations and carbon credit programs increasingly favor technologies that reduce nutrient losses and greenhouse gas emissions. The polymer-coated segment within controlled-release fertilizers faces emerging challenges from microplastic regulations, driving innovation toward biodegradable coating materials, including palm stearin, chitosan, and starch-based polymers that maintain release characteristics while addressing environmental concerns


By Application Mode: Fertigation Systems Drive Market Evolution
Fertigation applications account for 52.0% of the Asia-Pacific specialty fertilizer market size in 2025, reflecting the technology's rapid adoption across high-value crop systems, where precise nutrient timing and water-use efficiency create compelling economic advantages. The segment's dominance is particularly pronounced in China's greenhouse vegetable production and India's sugarcane cultivation, where fertigation systems enable farmers to apply nutrients during peak demand periods while minimizing losses to leaching and volatilization.
Soil application methods are experiencing the fastest growth at 6.9% CAGR through 2026 to 2031, driven by controlled-release fertilizer adoption in field crop systems where single-season applications can provide season-long nutrient availability. The application mode segmentation reflects the increasing sophistication of nutrient management practices across Asia-Pacific agriculture, where farmers are adopting multiple application methods within single cropping systems to optimize nutrient-use efficiency. Regulatory compliance factors are becoming increasingly important, with ISO 14001 environmental management standards influencing application method selection as farms seek to minimize environmental impact while maintaining productivity.
By Crop Type: Horticultural Expansion Reshapes Demand Patterns
Horticultural crops maintain the largest market share at 45.0% in 2025, the dominance of horticultural crops is largely attributed to their high nutritional requirements, which necessitate precise nutrient management to achieve optimal yield and quality. Factors such as the rising demand for premium horticultural products, the expansion of greenhouse and protected cultivation practices, and the increasing emphasis on export-quality produce in countries like China, India, Vietnam, and Thailand have further driven the adoption of specialty fertilizers in this segment. These developments have enabled horticultural crops to maintain their leading position in the market.
Turf and Ornamental is experiencing the fastest growth at 8.2% CAGR through 2026 to 2031, driven by applications that represent a smaller but growing segment, particularly in developed markets like Japan and Australia, where urbanization and recreational facility development create demand for specialized maintenance programs. The segmentation trends indicate a structural shift toward more intensive, technology-driven agricultural systems that favor the adoption of specialty fertilizers over conventional bulk products.
Geography Analysis
China's commanding 63.0% regional market share in 2025 reflects its position as both the world's largest fertilizer producer and consumer, with domestic specialty fertilizer production capacity exceeding 15 million tonnes annually across liquid, controlled-release, and water-soluble categories. The country's market dominance stems from massive government investments in precision agriculture infrastructure, including the USD 2.8 billion water-fertilizer integration program that mandates specialty fertilizer use across 5 million hectares of new fertigation systems by 2027. China's "Hundreds of Counties, Ten Thousand Hectares" soil health demonstration program, launched in March 2025, provides technical support and subsidies for farmers adopting micronutrient-enhanced fertilizer programs, creating predictable demand growth that supports continued market expansion.
India emerges as the fastest-growing market at 7.4% CAGR through 2026 to 2031, driven by the government's comprehensive soil health initiatives and the One Nation One Fertilizer scheme that promotes balanced fertilization practices across the country's 146 million agricultural holdings. The Soil Health Card program has issued 241.7 million cards promoting secondary and micronutrient applications, creating awareness of soil deficiencies that drive demand for specialty fertilizer products .
Australia, Japan, and Southeast Asian markets collectively represent the remaining regional share, with developed markets like Australia and Japan leading in controlled-release fertilizer adoption through government incentive programs that subsidize enhanced-efficiency products. Australia's Enhanced Efficiency Fertilizer Initiative provides AUD 150 million (USD 98 million) in rebates for farmers adopting polymer-coated urea and nitrification inhibitors, while Japan's K Program offers JPY 250 billion (USD 1.68 billion) in cost-sharing support for specialty fertilizer adoption.
Competitive Landscape
The Asia-Pacific specialty fertilizer market exhibits fragmentation, with the top players including Yara International ASA, ICL Group Ltd, Sociedad Quimica y Minera de Chile SA, Coromandel International Ltd., Huaqiang Chemical Group Stock Co., Ltd., creating opportunities for regional specialists and technology innovators to capture emerging segments through differentiated product offerings and localized distribution strategies.
Market concentration patterns reflect the capital-intensive nature of specialty fertilizer manufacturing, where polymer coating technologies and water-soluble formulation capabilities require significant technical expertise and production investments that favor established players with global research and development resources. The fragmented structure also enables nimble regional producers to compete effectively in niche segments where local market knowledge and customer relationships provide competitive advantages over multinational corporations.
Strategic patterns across the competitive landscape emphasize vertical integration and technology partnerships as companies seek to control critical input costs and access advanced coating technologies that differentiate their product portfolios. Yara International's regional market share reflects its comprehensive approach combining proprietary controlled-release technologies with extensive distribution networks, while ICL Group's share leverages its integrated potash and phosphate mining operations to support water-soluble fertilizer production.
Asia-Pacific Specialty Fertilizers Industry Leaders
Yara International ASA
ICL Group Ltd
Sociedad Quimica y Minera de Chile SA
Coromandel International Ltd.
Huaqiang Chemical Group Stock Co., Ltd.
- *Disclaimer: Major Players sorted in no particular order

Recent Industry Developments
- August 2025: Soluble Fertilizer Industry Association (SFIA), India, developed the first indigenous water-soluble fertilizer process, aiming to reduce import dependence and enhance local specialty fertilizer production capabilities.
- December 2024: Coromandel International and International Fertilizer Development Center (IFDC) formed an R&D partnership in India to co-develop specialty and efficiency-enhancing fertilizers, facilitating the faster introduction of advanced formulations in South Asia.
- August 2024: ICL Group and AMP Holdings Group signed a multi-year distribution agreement in China valued at approximately USD 170 million to distribute water-soluble and fertigation fertilizer products nationwide, improving specialty supply chain access.


Asia-Pacific Specialty Fertilizers Market Report Scope
The Asia-Pacific Specialty Fertilizers Market Report is Segmented by Specialty Type (CRF, Liquid Fertilizer, SRF, and Water Soluble), by Application Mode (Fertigation, Foliar, Soil), by Crop Type (Field Crops, Horticultural Crops, and Turf and Ornamental), and by Country (Australia, Bangladesh, China, India, Indonesia, Japan, and More). The Market Forecasts are Provided in Terms of Value (USD) and Volume (Metric Tons).
Speciality Type
| CRF | Polymer Coated |
| Polymer-Sulfur Coated | |
| Others | |
| Liquid Fertilizer | |
| SRF | |
| Water Soluble |
Application Mode
| Fertigation |
| Foliar |
| Soil |
Crop Type
| Field Crops |
| Horticultural Crops |
| Turf & Ornamental |
Country
| Australia |
| Bangladesh |
| China |
| India |
| Indonesia |
| Japan |
| Pakistan |
| Philippines |
| Thailand |
| Vietnam |
| Rest of Asia-Pacific |
| Speciality Type | CRF | Polymer Coated |
| Polymer-Sulfur Coated | ||
| Others | ||
| Liquid Fertilizer | ||
| SRF | ||
| Water Soluble | ||
| Application Mode | Fertigation | |
| Foliar | ||
| Soil | ||
| Crop Type | Field Crops | |
| Horticultural Crops | ||
| Turf & Ornamental | ||
| Country | Australia | |
| Bangladesh | ||
| China | ||
| India | ||
| Indonesia | ||
| Japan | ||
| Pakistan | ||
| Philippines | ||
| Thailand | ||
| Vietnam | ||
| Rest of Asia-Pacific |


Market Definition
- MARKET ESTIMATION LEVEL - Market Estimations for various types of fertilizers has been done at the product-level and not at the nutrient-level.
- NUTRIENT TYPES COVERED - Primary Nutrients: N, P and K, Secondary Macronutrients: Ca, Mg and S, Micronutients: Zn, Mn, Cu, Fe, Mo, B, and Others
- AVERAGE NUTRIENT APPLICATION RATE - This refers to the average volume of nutrient consumed per hectare of farmland in each country.
- CROP TYPES COVERED - Field Crops: Cereals, Pulses, Oilseeds, and Fiber Crops Horticulture: Fruits, Vegetables, Plantation Crops and Spices, Turf Grass and Ornamentals
| Keyword | Definition |
|---|---|
| Fertilizer | Chemical substance applied to crops to ensure nutritional requirements, available in various forms such as granules, powders, liquid, water soluble, etc. |
| Specialty Fertilizer | Used for enhanced efficiency and nutrient availability applied through soil, foliar, and fertigation. Includes CRF, SRF, liquid fertilizer, and water soluble fertilizers. |
| Controlled-Release Fertilizers (CRF) | Coated with materials such as polymer, polymer-sulfur, and other materials such as resins to ensure nutrient availability to the crop for its entire life cycle. |
| Slow-Release Fertilizers (SRF) | Coated with materials such as sulfur, neem, etc., to ensure nutrient availability to the crop for a longer period. |
| Foliar Fertilizers | Consist of both liquid and water soluble fertilizers applied through foliar application. |
| Water-Soluble Fertilizers | Available in various forms including liquid, powder, etc., used in foliar and fertigation mode of fertilizer application. |
| Fertigation | Fertilizers applied through different irrigation systems such as drip irrigation, micro irrigation, sprinkler irrigation, etc. |
| Anhydrous Ammonia | Used as fertilizer, directly injected into the soil, available in gaseous liquid form. |
| Single Super Phosphate (SSP) | Phosphorus fertilizer containing only phosphorus which has lesser than or equal to 35%. |
| Triple Super Phosphate (TSP) | Phosphorus fertilizer containing only phosphorus greater than 35%. |
| Enhanced Efficiency Fertilizers | Fertilizers coated or treated with additional layers of various ingredients to make it more efficient compared to other fertilizers. |
| Conventional Fertilizer | Fertilizers applied to crops through traditional methods including broadcasting, row placement, ploughing soil placement, etc. |
| Chelated Micronutrients | Micronutrient fertilizers coated with chelating agents such as EDTA, EDDHA, DTPA, HEDTA, etc. |
| Liquid Fertilizers | Available in liquid form, majorly used for application of fertilizers to crops through foliar and fertigation. |


Research Methodology
Mordor Intelligence follows a four-step methodology in all our reports.
- Step-1: IDENTIFY KEY VARIABLES: In order to build a robust forecasting methodology, the variables and factors identified in Step-1 are tested against available historical market numbers. Through an iterative process, the variables required for market forecast are set and the model is built on the basis of these variables.
- Step-2: Build a Market Model: Market-size estimations for the forecast years are in nominal terms. Inflation is not a part of the pricing, and the average selling price (ASP) is kept constant throughout the forecast period for each country.
- Step-3: Validate and Finalize: In this important step, all market numbers, variables and analyst calls are validated through an extensive network of primary research experts from the market studied. The respondents are selected across levels and functions to generate a holistic picture of the market studied.
- Step-4: Research Outputs: Syndicated Reports, Custom Consulting Assignments, Databases & Subscription Platforms


