Market Overview
| Study Period | 2021 - 2031 |
|---|---|
| Forecast Data Period | 2026 - 2031 |
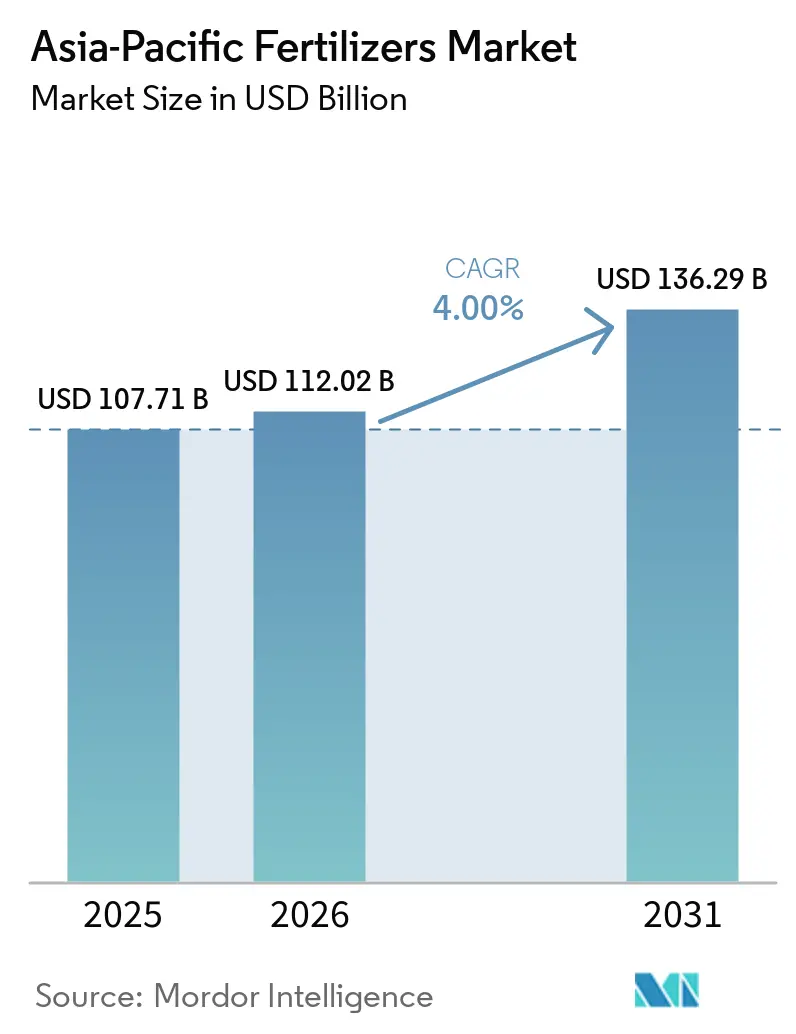
| Base Year Market Size (2025) | USD 107.71 Billion |
| Market Size (2026) | USD 112.02 Billion |
| Market Size (2031) | USD 136.29 Billion |
| Growth Rate (2026 - 2031) | 4.00% CAGR |
| Market Concentration | Low |
Major Players *Disclaimer: Major Players sorted in no particular order Image © Mordor Intelligence. Reuse requires attribution under CC BY 4.0. | |
Asia-Pacific Fertilizers Market Analysis by Mordor Intelligence
The Asia-Pacific fertilizers market size is projected to grow from USD 107.71 billion in 2025 to USD 112.02 billion in 2026 and is forecast to reach USD 136.29 billion by 2031, registering a CAGR of 4.0% during the forecast period (2026–2031). This trajectory mirrors rapid agricultural intensification, policy-backed shifts toward balanced nutrition, and the expansion of specialty product adoption across both mature and emerging economies. Higher horticultural exports from Vietnam and Thailand, subsidy rationalization in India and China, and sustained infrastructure investment in water-efficient irrigation systems together reinforce medium-term growth momentum. Manufacturers accelerate regional capacity additions for controlled-release and water-soluble fertilizers to capture premium demand segments, while producer margins remain vulnerable to volatile natural gas and phosphate rock prices. Competitive rivalry intensifies as global majors pursue acquisitions and distribution tie-ups that embed technology differentiation into local supply chains, creating opportunities for agile regional specialists to exploit niche micronutrient and carbon-smart solutions within the Asia-Pacific fertilizers market.
Key Report Takeaways
- By type, straight fertilizers accounted for the largest Asia-Pacific fertilizers market share of 59.0% in 2025, while complex fertilizers are projected to be the fastest-growing segment, advancing at a CAGR of 5.4% from 2026 to 2031.
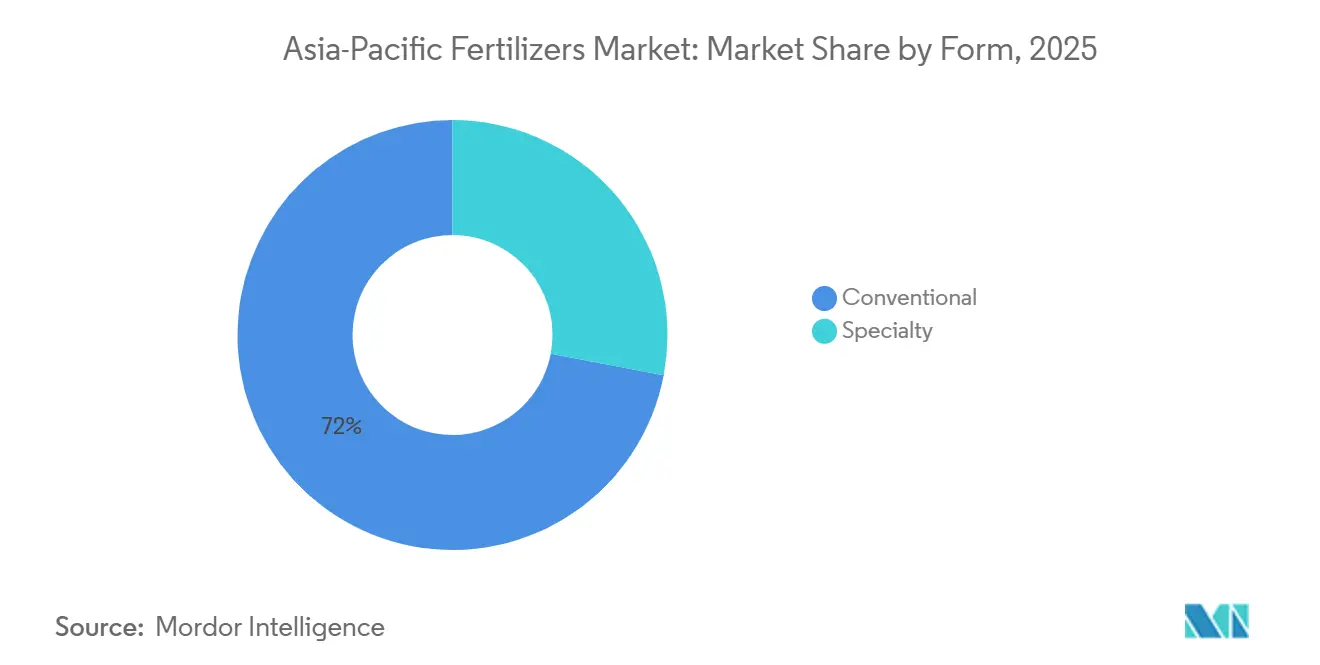
- By form, conventional products held the largest Asia-Pacific fertilizers market size in 2025, accounting for a 72.0% share, whereas specialty fertilizers are forecast to register the highest growth rate at a CAGR of 7.1% through 2031.
- By application mode, soil application accounted for the largest share of the market in 2025, at 61.5%, while fertigation is projected to be the fastest-growing segment, expanding at a CAGR of 6.8% between 2026 and 2031.
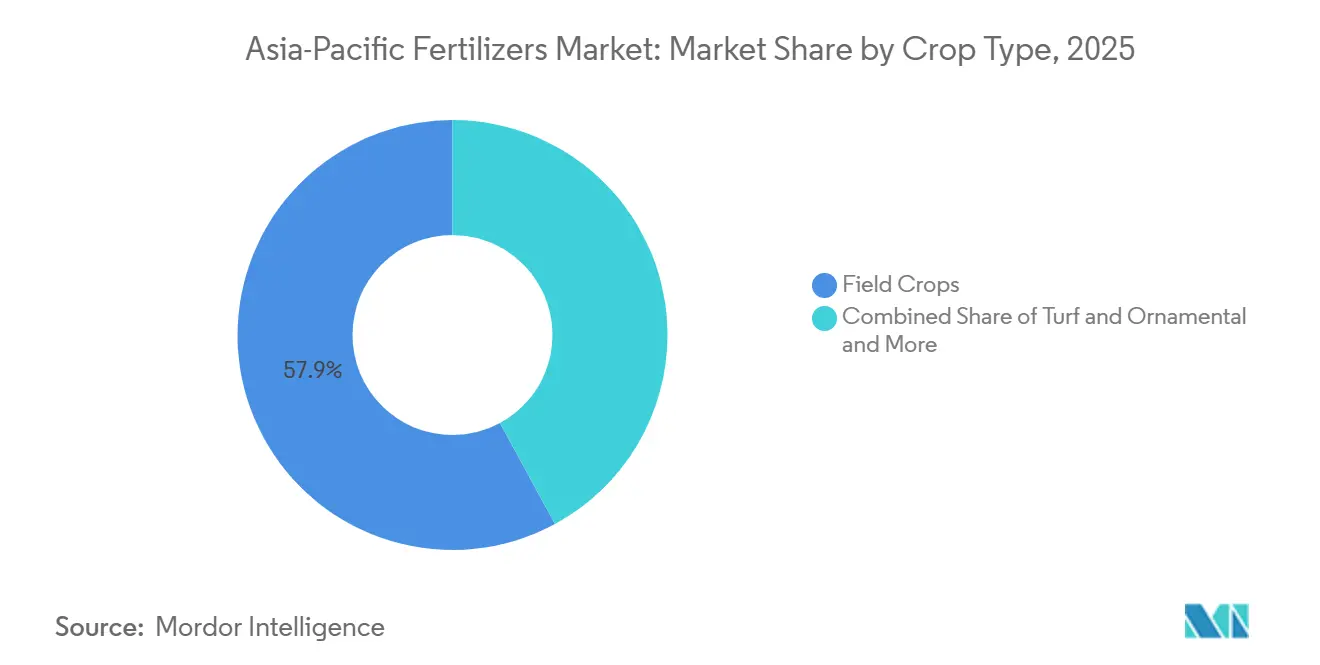
- By crop type, field crops accounted for the largest share of the Asia-Pacific fertilizers market in 2025 at 57.9%, whereas turf and ornamental applications are projected to grow at the fastest CAGR of 8.6% through 2031.
- By geography, China accounted for the largest Asia-Pacific fertilizers market share, 28.1%, in 2025, while India is projected to be the fastest-growing major market, advancing at a CAGR of 5.3% from 2026 to 2031.
Note: Market size and forecast figures in this report are generated using Mordor Intelligence’s proprietary estimation framework, updated with the latest available data and insights as of 2026.
Asia-Pacific Fertilizers Market Trends and Insights
Drivers Impact Analysis*
| Driver | (~) % Impact on CAGR Forecast | Geographic Relevance | Impact Timeline |
|---|---|---|---|
| Subsidy rationalization in India and China is shifting demand toward balanced fertilization | +1.2% | India, China, spill-over to Southeast Asia | Medium term (2-4 years) |
| Government-funded soil health card initiatives are improving micronutrient adoption | +0.8% | India core, expansion to Bangladesh and Pakistan | Long term (≥ 4 years) |
| Surge in specialty fertilizer capacity expansions across Southeast Asia | +0.9% | Indonesia, Vietnam, the Philippines, and Thailand | Short term (≤ 2 years) |
| Rising horticulture exports from Vietnam and Thailand propelling water-soluble demand | +0.7% | Vietnam and Thailand, regional export corridors | Medium term (2-4 years) |
| Carbon-credit monetization pilot projects rewarding low-emission fertilizers | +0.4% | Global, early adoption in Vietnam and Philippines | Long term (≥ 4 years) |
| Coastal aquaculture nutrient-leakage restrictions are driving sulfur-coated products | +0.5% | Coastal regions across Asia-Pacific, Vietnam shrimp zones | Medium term (2-4 years) |
| Source: Mordor Intelligence | |||
Subsidy rationalization in India and China is shifting demand toward balanced fertilization
India’s Nutrient-Based Subsidy framework and China’s parallel reforms narrow the cost gap between urea and complex fertilizers, steering growers toward balanced NPK blends and specialty micronutrients. The converging policies underpin stronger demand for high-analysis products that improve soil fertility while moderating nitrogen overuse. Established producers with diversified portfolios gain pricing power, whereas commodity urea suppliers confront shrinking margins. Supply-chain complexity increases as companies must align formulation registration and distribution systems with evolving sub-national subsidy codes. The shift strengthens the premium tier of the Asia-Pacific fertilizers market.
Government-funded soil health card initiatives are improving micronutrient adoption
More than 220 million soil health cards distributed in India reveal zinc, boron, and iron deficiencies across key cereal belts, galvanizing targeted micronutrient fertilizer uptake[1]Source: Government of India, “Soil Health Card Scheme Dashboard,” agricoop.gov.in. Data-driven prescriptions encourage growers to adopt custom blends that command price premiums yet deliver measurable yield gains. Manufacturers respond with crop- and region-specific micronutrient packs while investing in agronomy advisory teams that translate analytical results into precise usage guidelines. Similar initiatives in Bangladesh and Pakistan position South Asia as a long-run growth engine for the Asia-Pacific fertilizers market.
Surge in specialty fertilizer capacity expansions across Southeast Asia
Pupuk Indonesia allocates USD 1 billion to the Fakfak urea complex in 2024, adding a high capacity with a stated focus on downstream specialty lines, while Vietnam’s PVFCCo builds water-soluble and controlled-release workshops to supply horticulture clusters. Lower energy costs and proximity to export channels anchor these investments, which shorten supply pathways and trim freight emissions. The resulting competitive landscape compels incumbent global majors to secure regional distribution alliances to retain shelf presence in the Asia-Pacific fertilizers market.
Rising horticulture exports from Vietnam and Thailand propelling water-soluble demand
Vietnam and Thailand pursue higher-value fruit and vegetable exports that hinge on precise fertigation routines enabled by water-soluble fertilizers[2]Source: Vietnam Ministry of Agriculture, “Horticulture Export Statistics 2024,” moa.gov.vn. Strong foreign exchange receipts justify the cost premium of these inputs, shifting procurement patterns from bulk granular commodities toward specialty sacks. Irrigation system vendors and fertilizer producers increasingly co-market integrated packages that guarantee nutrient use efficiency and residue compliance, widening the adoption curve across commercial greenhouses and orchard estates.
Restraints Impact Analysis*
| Restraint | (~) % Impact on CAGR Forecast | Geographic Relevance | Impact Timeline |
|---|---|---|---|
| Volatile ammonia and phosphate feedstock prices are squeezing producer margins | -1.1% | Global, acute impact on import-dependent markets | Short term (≤ 2 years) |
| Stringent Chinese export quotas limiting regional supply security | -0.9% | Import-dependent countries: India and Southeast Asia | Short term (≤ 2 years) |
| Proliferation of counterfeit fertilizer bags in South Asia is eroding brand trust | -0.6% | India, Pakistan, Bangladesh, and Sri Lanka | Medium term (2-4 years) |
| Growing microplastic scrutiny on polymer-coated CRFs | -0.4% | Developed markets first, spreading to emerging economies | Long term (≥ 4 years) |
| Source: Mordor Intelligence | |||
Volatile ammonia and phosphate feedstock prices are squeezing producer margins
Yara projects natural gas cost increases of USD 85 million for Q1 2025 and USD 225 million for Q2 2025, underscoring susceptibility to energy price swings that compress gross margins[3]Source: Yara International ASA, “Gas Cost Outlook 2025,” yara.com. Smaller Asian producers reliant on imported ammonia or phosphate rock face pronounced cost pass-through risks, occasionally curtailing operating rates during spike episodes. Extended price turbulence complicates growers’ budgeting cycles and may delay the adoption of premium fertilizers within the Asia-Pacific fertilizers market.
Stringent Chinese export quotas limiting regional supply security
Beijing’s ad-hoc quota adjustments on DAP and urea exports reverberate across South and Southeast Asia during planting peaks, forcing importers to diversify origin portfolios and maintain higher inventory cover. Strategic reserves and accelerated domestic capacity projects partly mitigate risk, but cost escalation remains inevitable in the near term. The situation accelerates long-planned projects in India and Indonesia and invites non-Chinese suppliers to lock multi-year offtake contracts that strengthen their foothold in the Asia-Pacific fertilizers market.
*Our forecasts treat driver/restraint impacts as directional, not additive. The impact forecasts reflect baseline growth, mix effects, and variable interactions.
Segment Analysis
By Type: Straight Fertilizers Dominate While Complex Fertilizers Lead Growth
Straight fertilizers accounted for 59.0% of the Asia-Pacific fertilizers market share in 2025, driven by the prevalent use of separate nitrogen, phosphorus, and potassium applications in major crop production systems. Nitrogenous fertilizers, particularly urea with its 46% nitrogen content, continue to lead demand due to their cost-effectiveness and widespread use in China and India. Phosphatic and potassic fertilizers remain critical for enhancing crop productivity, while increasing awareness of soil nutrient deficiencies is encouraging the adoption of micronutrients such as zinc.
Complex fertilizers are anticipated to be the fastest-growing segment, with a projected CAGR of 5.4% from 2026 to 2031. This growth is attributed to rising demand for balanced nutrient formulations that enhance nutrient-use efficiency and simplify fertilizer application processes. Government initiatives, such as India's USD 4.8 billion nutrient-based subsidy scheme for 2026 and measures to ensure fertilizer availability in China, are further promoting adoption across the region. Additionally, the expansion of precision farming practices is projected to drive demand for complex fertilizers throughout the forecast period.
By Form: Specialty Products Disrupt Conventional Dominance
Conventional fertilizers accounted for 72.0% of revenue in 2025, while specialty fertilizers are projected to expand at a CAGR of 7.1% through 20231 as growers and regulators increasingly prioritize nutrient-use efficiency. Water-soluble products top the growth leaderboard, encouraged by widespread fertigation rollouts in horticulture zones. Controlled-release fertilizers gain share as labor scarcity and leaching losses push demand for single-shot applications, though scrutiny of polymer microplastics is intensifying.
ICL’s USD 170 million distribution pact with AMP Holdings underscores commercial confidence in specialty water-soluble offerings for premium fruit and vegetable crops. Liquid fertilizers ride the mechanization trend, especially in greenhouse and plantation settings, adding further momentum to the specialty segment within the Asia-Pacific fertilizers market.


By Application Mode: Fertigation Gains Momentum
Soil broadcasting retained 61.5% of the application volume in 2025, yet fertigation recorded the highest growth at a 6.8% CAGR from 2026 to 2031, driven by drip irrigation incentives and efforts to address water scarcity. Adoption is accelerating across India’s horticulture belts and coastal aquaculture ponds, with demand for precise sulfur-coated inputs to meet nutrient leakage compliance requirements. Foliar sprays occupy a smaller niche, focused on rapid micronutrient correction in high-value produce.
Japan’s model of combining controlled-release prills with fertigation equipment inspires neighboring markets to upgrade their application protocols, boosting yields and reducing runoff. Integrated solution bundles offered by irrigation and fertilizer firms secure a rising share of new installations, expanding the Asia-Pacific fertilizers market.
By Crop Type: Field Staples Anchor Volume While Turf Flourishes
Field crops accounted for 57.9% of the Asia-Pacific fertilizers market share in 2025, driven primarily by rice, wheat, and corn cultivation. However, turf and ornamental applications are projected to grow at a CAGR of 8.6% through 2031, driven by golf course expansion, public green space development, and residential landscaping across emerging middle-income economies. Horticultural crops maintain robust demand through export-oriented production that prioritizes consistency and compliance with residue regulations.
Rice alone accounts for one-third of the Asia-Pacific fertilizers market, owing to triple-cropping in southern China and intensification in the Mekong Delta. Landscape nutrition programs increasingly specify low-leach, iron-rich blends, creating margin-rich opportunities for specialty suppliers. Parallel growth in greenhouse vegetables enhances the uptake of liquid- and water-soluble nutrients, improving nutrient scheduling precision.
Geography Analysis
China captured 28.1% of regional sales in 2025, supported by its integrated petrochemical network and extensive cereal cultivation. Despite being a mature market, policy-driven efficiency improvements and increasing penetration of specialty fertilizer products continue to support growth in the Asia-Pacific fertilizers market. India, projected to grow at a CAGR of 5.3% from 2026 to 2031, is benefiting from balanced subsidy reforms and digital soil-testing initiatives aimed at improving crop yields and micronutrient uptake among smallholder farmers.
Indonesia, Vietnam, Thailand, and the Philippines collectively exhibit robust growth in specialty fertilizers as export crop profitability encourages investment in drip irrigation and fertigation systems. Pupuk Indonesia’s target of 6.43 million metric tons output for 2025 sharpens domestic supply security, while Vietnam’s PVFCCo channels capex toward high-analysis water-soluble lines that feed its fast-growing fruit export value chain.
Australia and Japan, though smaller in volume, shape technology adoption curves by piloting carbon-credit monetization, biodegradable coatings, and precision nutrient modeling. Meanwhile, Bangladesh and Pakistan are striving to diversify supply away from Chinese DAP through bilateral contracts with Middle Eastern manufacturers, illustrating how supply security concerns realign trade routes within the Asia-Pacific fertilizers market.
Competitive Landscape
The Asia-Pacific fertilizers market is fragmented, with the top five players holding a small share of revenue. Yara pursues vertical integration from ammonia to specialty blends, while ICL and Nutrien aggressively expand distribution partnerships and specialty capacity to defend share. Regional champions such as Coromandel International and Kingenta leverage proximity advantages and government relationships to penetrate micronutrient and water-soluble niches.
Consolidation gathers pace, evidenced by Incitec Pivot’s acquisition of Yara Nipro’s liquid business and ICL’s specialty fertilizer deal with AMP Holdings in China, signaling a quest for end-to-end solution control. Product innovation centers on chitosan-coated controlled-release prills, sulfur-enhanced water-soluble powders, and data-enabled advisory platforms that guide dosage precision.
Disruptive entrants seek to differentiate through carbon-efficient nutrient pathways that may tap emerging voluntary carbon credit schemes. Competitive intensity is forecast to heighten as gas cost volatility and environmental regulation challenge margin resilience across the Asia-Pacific fertilizers market.
Asia-Pacific Fertilizers Industry Leaders
Coromandel International Ltd.
ICL Group Ltd
Sinofert Holdings Limited
Xinyangfeng Agricultural Technology Co., Ltd.
Yara International ASA
- *Disclaimer: Major Players sorted in no particular order

Recent Industry Developments
- June 2025: Xinyangfeng revealed external investment projects, including a new phosphorus-material circular economy industrial park. The projects involve capital expenditure for integrating upstream fertilizer supply, focusing on ammonium phosphate production.
- August 2024: ICL signed a USD 170 million, five-year distribution agreement with AMP Holdings in China to deepen penetration into premium fruit segments.
- January 2023: ICL has entered into a strategic partnership agreement with General Mills, in which it will be the supplier of strategic specialty phosphate solutions to General Mills. The long-term agreement will also focus on international expansion.


Asia-Pacific Fertilizers Market Report Scope
Complex, Straight are covered as segments by Type. Conventional, Speciality are covered as segments by Form. Fertigation, Foliar, Soil are covered as segments by Application Mode. Field Crops, Horticultural Crops, Turf & Ornamental are covered as segments by Crop Type. Australia, Bangladesh, China, India, Indonesia, Japan, Pakistan, Philippines, Thailand, Vietnam are covered as segments by Country.Type
| Complex | ||
| Straight | Micronutrients | Boron |
| Copper | ||
| Iron | ||
| Manganese | ||
| Molybdenum | ||
| Zinc | ||
| Others | ||
| Nitrogenous | Ammonium Nitrate | |
| Anhydrous Ammonia | ||
| Urea | ||
| Others | ||
| Phosphatic | DAP | |
| MAP | ||
| SSP | ||
| TSP | ||
| Others | ||
| Potassic | MoP | |
| SoP | ||
| Others | ||
| Secondary Macronutrients | Calcium | |
| Magnesium | ||
| Sulfur | ||
Form
| Conventional | |
| Speciality | CRF |
| Liquid Fertilizer | |
| SRF | |
| Water Soluble |
Application Mode
| Fertigation |
| Foliar |
| Soil |
Crop Type
| Field Crops |
| Horticultural Crops |
| Turf & Ornamental |
Country
| Australia |
| Bangladesh |
| China |
| India |
| Indonesia |
| Japan |
| Pakistan |
| Philippines |
| Thailand |
| Vietnam |
| Rest of Asia-Pacific |
| Type | Complex | ||
| Straight | Micronutrients | Boron | |
| Copper | |||
| Iron | |||
| Manganese | |||
| Molybdenum | |||
| Zinc | |||
| Others | |||
| Nitrogenous | Ammonium Nitrate | ||
| Anhydrous Ammonia | |||
| Urea | |||
| Others | |||
| Phosphatic | DAP | ||
| MAP | |||
| SSP | |||
| TSP | |||
| Others | |||
| Potassic | MoP | ||
| SoP | |||
| Others | |||
| Secondary Macronutrients | Calcium | ||
| Magnesium | |||
| Sulfur | |||
| Form | Conventional | ||
| Speciality | CRF | ||
| Liquid Fertilizer | |||
| SRF | |||
| Water Soluble | |||
| Application Mode | Fertigation | ||
| Foliar | |||
| Soil | |||
| Crop Type | Field Crops | ||
| Horticultural Crops | |||
| Turf & Ornamental | |||
| Country | Australia | ||
| Bangladesh | |||
| China | |||
| India | |||
| Indonesia | |||
| Japan | |||
| Pakistan | |||
| Philippines | |||
| Thailand | |||
| Vietnam | |||
| Rest of Asia-Pacific | |||


Market Definition
- MARKET ESTIMATION LEVEL - Market Estimations for various types of fertilizers has been done at the product-level and not at the nutrient-level.
- NUTRIENT TYPES COVERED - Primary Nutrients: N, P and K, Secondary Macronutrients: Ca, Mg and S, Micronutients: Zn, Mn, Cu, Fe, Mo, B, and Others
- AVERAGE NUTRIENT APPLICATION RATE - This refers to the average volume of nutrient consumed per hectare of farmland in each country.
- CROP TYPES COVERED - Field Crops: Cereals, Pulses, Oilseeds, and Fiber Crops Horticulture: Fruits, Vegetables, Plantation Crops and Spices, Turf Grass and Ornamentals
| Keyword | Definition |
|---|---|
| Fertilizer | Chemical substance applied to crops to ensure nutritional requirements, available in various forms such as granules, powders, liquid, water soluble, etc. |
| Specialty Fertilizer | Used for enhanced efficiency and nutrient availability applied through soil, foliar, and fertigation. Includes CRF, SRF, liquid fertilizer, and water soluble fertilizers. |
| Controlled-Release Fertilizers (CRF) | Coated with materials such as polymer, polymer-sulfur, and other materials such as resins to ensure nutrient availability to the crop for its entire life cycle. |
| Slow-Release Fertilizers (SRF) | Coated with materials such as sulfur, neem, etc., to ensure nutrient availability to the crop for a longer period. |
| Foliar Fertilizers | Consist of both liquid and water soluble fertilizers applied through foliar application. |
| Water-Soluble Fertilizers | Available in various forms including liquid, powder, etc., used in foliar and fertigation mode of fertilizer application. |
| Fertigation | Fertilizers applied through different irrigation systems such as drip irrigation, micro irrigation, sprinkler irrigation, etc. |
| Anhydrous Ammonia | Used as fertilizer, directly injected into the soil, available in gaseous liquid form. |
| Single Super Phosphate (SSP) | Phosphorus fertilizer containing only phosphorus which has lesser than or equal to 35%. |
| Triple Super Phosphate (TSP) | Phosphorus fertilizer containing only phosphorus greater than 35%. |
| Enhanced Efficiency Fertilizers | Fertilizers coated or treated with additional layers of various ingredients to make it more efficient compared to other fertilizers. |
| Conventional Fertilizer | Fertilizers applied to crops through traditional methods including broadcasting, row placement, ploughing soil placement, etc. |
| Chelated Micronutrients | Micronutrient fertilizers coated with chelating agents such as EDTA, EDDHA, DTPA, HEDTA, etc. |
| Liquid Fertilizers | Available in liquid form, majorly used for application of fertilizers to crops through foliar and fertigation. |


Research Methodology
Mordor Intelligence follows a four-step methodology in all our reports.
- Step-1: IDENTIFY KEY VARIABLES: In order to build a robust forecasting methodology, the variables and factors identified in Step-1 are tested against available historical market numbers. Through an iterative process, the variables required for market forecast are set and the model is built on the basis of these variables.
- Step-2: Build a Market Model: Market-size estimations for the forecast years are in nominal terms. Inflation is not a part of the pricing, and the average selling price (ASP) is kept constant throughout the forecast period for each country.
- Step-3: Validate and Finalize: In this important step, all market numbers, variables and analyst calls are validated through an extensive network of primary research experts from the market studied. The respondents are selected across levels and functions to generate a holistic picture of the market studied.
- Step-4: Research Outputs: Syndicated Reports, Custom Consulting Assignments, Databases & Subscription Platforms


