Market Overview
| Study Period | 2017 - 2030 |
|---|---|
| Forecast Data Period | 2025 - 2030 |
| Historical Data Period | 2017 - 2023 |
| Market Size (2025) | USD 0.75 Billion |
| Market Size (2030) | USD 1.21 Billion |
| Growth Rate (2025 - 2030) | 10.04% CAGR |
| Market Concentration | Low |
Major Players*Disclaimer: Major Players sorted in no particular order Image © Mordor Intelligence. Reuse requires attribution under CC BY 4.0. | |

Asia-Pacific Biofertilizer Market Analysis by Mordor Intelligence
The Asia-Pacific Biofertilizer Market size is estimated at 0.75 billion USD in 2025, and is expected to reach 1.21 billion USD by 2030, growing at a CAGR of 10.04% during the forecast period (2025-2030).
The Asia-Pacific biofertilizer industry is experiencing a significant transformation driven by the increasing adoption of sustainable fertilizer practices. The region has witnessed substantial growth in organic cultivation, with the total area under organic farming reaching 3.8 million hectares in 2022. This shift is supported by stringent regulations on chemical fertilizer usage and growing environmental concerns across the region. Government bodies are actively promoting sustainable fertilizer practices through various initiatives and policies, particularly in major agricultural economies like China and India. The implementation of these policies has led to increased awareness among farmers about the benefits of agricultural biologicals in agriculture.
Technological advancements in biofertilizer production have significantly improved product efficiency and effectiveness. Modern biofertilizers have demonstrated remarkable capabilities, with products like Azotobacter-based solutions increasing agricultural productivity by 10-12% through the synthesis of biologically active compounds including nicotinic acid, biotin, heteroauxins, vitamin B, and gibberellins. These innovations have enhanced the credibility of biofertilizers among farmers, leading to wider acceptance and adoption. The industry has also seen improvements in formulation technologies, resulting in products with longer shelf life and better stability under various environmental conditions.
The integration of biofertilizers in mainstream agriculture has been particularly successful in row crop cultivation, which accounts for 67.5% of the total organic cropland in the region as of 2022. This integration has been facilitated by extensive research and development activities focused on improving the efficacy of biofertilizers for different crop types. Agricultural research institutions across the region are conducting trials and developing new strains of beneficial soil microorganisms, leading to more effective products. The industry has also witnessed the emergence of innovative application methods and improved delivery systems that enhance the efficiency of biofertilizer usage.
A notable trend in the market is the increasing collaboration between research institutions, government bodies, and private companies to develop more effective biofertilizer solutions. These partnerships have resulted in the development of specialized products that can reduce chemical fertilizer usage by 25-30% while maintaining or improving crop yields. The industry has also seen significant investments in infrastructure development for biofertilizer production and distribution. Companies are establishing sophisticated manufacturing facilities equipped with advanced fermentation and quality control systems, ensuring consistent product quality and meeting the growing demand for organic fertilizer agricultural inputs.
Asia-Pacific Biofertilizer Market Trends and Insights
Growing government support in countries like China, India, Indonesia, and Australia, boosts organic farming in the region
- The area of organic agricultural land in Asia-Pacific was over 3.7 million ha in 2021, representing 26.4% of the global organic area, as per FiBL statistics. The organic area under cultivation grew by 19.3% between 2017-2022. As of 2020, the region had 1.83 million organic producers, with India topping the list with 1.3 million organic producers. China, India, Indonesia, and Australia are the major countries with large organic cultivation areas in the region. Government authorities in countries like China and India are constantly promoting organic agriculture to reduce reliance on chemical inputs for crop cultivation. For instance, India has implemented schemes like Paramparagat Krishi Vikas Yojana and the All India Network Programme on Organic Farming (AI-NPOF).
- In 2021, China accounted for a maximum share of 66.1%, with 2.5 million ha, followed by India, Indonesia, and Australia, with 19.3%, 1.5%, and 1.4%, respectively. The total organic land is divided into three crop types, namely row crops, horticultural crops, and cash crops. Row crops occupy a major share of organic agricultural land in the region, accounting for 67.5% share, i.e., 2.5 million ha in 2021. The major row crops grown in the region include paddy, wheat, pulses, soybeans, and millets.
- Cash crops held the second largest share, with 0.7 million ha in 2021, accounting for an 18.5% share of organic cropland. The demand for organic cash crops like sugar and organic tea is increasing worldwide. China and India are the largest organic green and black tea producers, respectively. The growing international demand is expected to increase the organic acreages in the region.


Per capita spending on organic product predominant in Australia and China’s organic food market growing significantly
- The per capita spending on organic products in the region was recorded at USD 85.1 in 2021. Australia witnessed a higher per capita spending on organic products, with USD 34.49 in the same year, attributed to the higher demand due to consumers’ perception of organic food as healthy. As per the Global Organic Trade data, the organic packaged food and beverage market in Australia was valued at USD 885.2 million in 2021.
- China's organic food market grew by 13.3% in 2021, and the positive growth pattern is expected to continue, with a CAGR of 7.1% between 2023 and 2029. With an increasing emphasis on the importance of organic products among the younger generation and the rising demand for organic baby food due to the growing number of mothers in the workforce and the increasing adoption of the health and wellness trend, organic products are expected to reach a value of USD 6.4 billion by 2025.
- Organic products in India represent far less than 1.0% of global demand, with a per capita expenditure of just USD 0.08 in 2021. However, the Indian market may grow over the coming years, reaching a value of USD 153.3 million by 2025. Currently, the region's organic goods market is highly fragmented, with just a few supermarkets and specialty stores selling them, as people from higher-income families are the only potential customers. Growing consumer knowledge and changing buying patterns may lead to a better understanding of organic food sustainability in the region. Increasing per capita income and increased consumer awareness of the importance of organic food can raise per capita expenditure on organic food items in the Asia-Pacific region.

Segment Analysis: Form
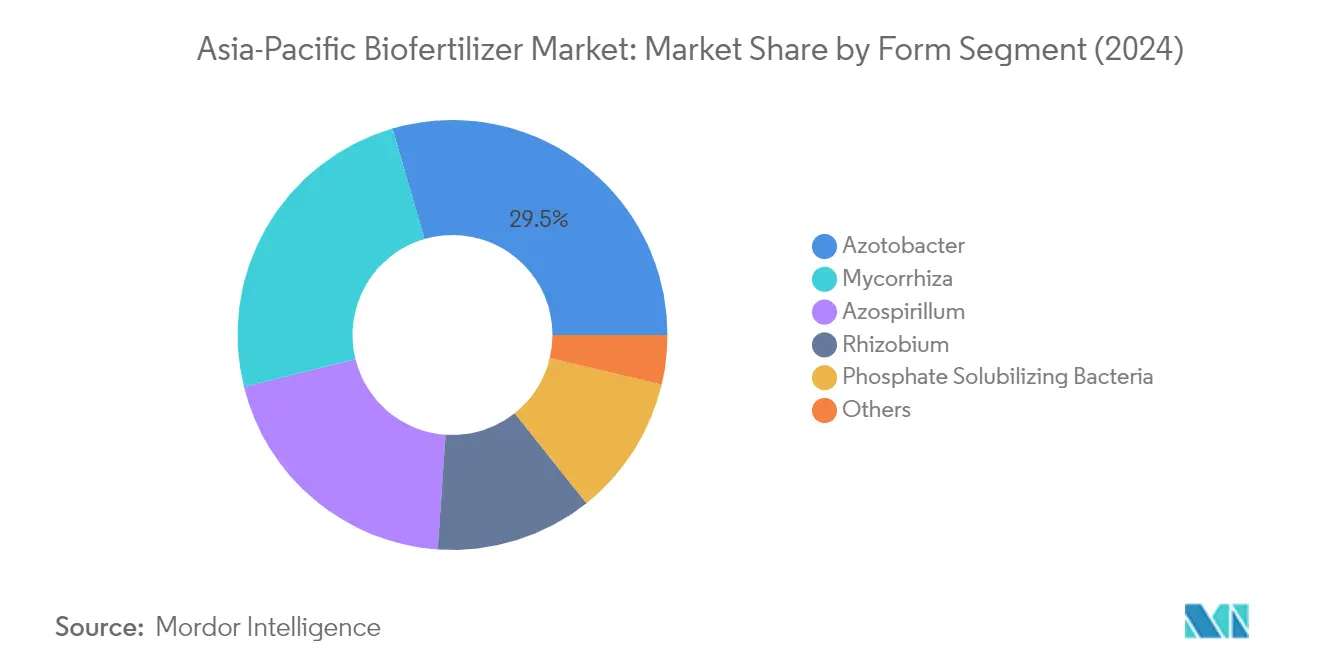
Azotobacter Segment in Asia-Pacific Biofertilizer Market
Azotobacter dominates the Asia-Pacific biofertilizer market, accounting for approximately 30% of the market value in 2024. As a non-symbiotic bacterial fertilizer, Azotobacter has gained significant traction due to its ability to fix atmospheric nitrogen and make it accessible to plants. It is particularly effective for non-leguminous plants, including rice, cotton, and vegetables. The segment's prominence is attributed to its capacity to boost plant health through nitrogen fixation and growth hormone generation. Azotobacter-based biofertilizers have shown remarkable effectiveness in row crops, which represent the largest application area in the region. The lack of organic matter in soil remains a limiting factor for the growth of the Azotobacter segment, yet its versatility and effectiveness continue to drive its market leadership.

Rhizobium Segment in Asia-Pacific Biofertilizer Market
The Rhizobium segment is experiencing the fastest growth trajectory in the Asia-Pacific biofertilizer market, projected to expand at approximately 11% CAGR from 2024 to 2029. This robust growth is driven by Rhizobium's unique ability to form symbiotic relationships with leguminous plants, creating root nodules that efficiently fix atmospheric nitrogen. The segment's growth is further supported by ongoing research initiatives to develop new strains and increasing environmental concerns regarding chemical fertilizer overuse. Rhizobium's effectiveness in potentially replacing commercial nitrogen fertilizers, particularly in leguminous crops, has made it increasingly attractive to farmers adopting sustainable agricultural practices. The segment's growth is also bolstered by its proven ability to enhance agricultural productivity while maintaining soil fertility, making it a crucial component in sustainable farming practices across the region. Additionally, Rhizobium is recognized as a plant growth-promoting rhizobacteria, enhancing its appeal in sustainable agriculture.
Remaining Segments in Form Segmentation
The other significant segments in the Asia-Pacific biofertilizer market include Mycorrhiza, Azospirillum, Phosphate Solubilizing Bacteria, and other biofertilizers. Mycorrhiza has established itself as a crucial segment due to its ability to enhance root surface area and improve nutrient absorption. Azospirillum has gained recognition for its plant growth-promoting capabilities and ability to fix nitrogen in various crops. Phosphate-solubilizing biofertilizer plays a vital role in converting insoluble phosphates into forms readily available for plant uptake. The other biofertilizers segment, including various specialized strains and combinations, continues to contribute to market diversity by offering targeted solutions for specific crop needs and soil conditions.
Segment Analysis: Crop Type
Row Crops Segment in Asia-Pacific Biofertilizer Market
Row crops dominate the Asia-Pacific biofertilizer market, accounting for approximately 82% of the total market value in 2024. The segment's prominence is primarily attributed to its extensive organic cultivation area in the region, representing about 67.5% of the total organic cropland. Major row crops in the region include rice, wheat, canola, barley, corn, and soybeans, with China and India being the largest producers accounting for about 95% of the total organic row crop cultivation area. The segment is dominated by Azotobacter-based biofertilizers, which hold nearly 29% of the market share, due to their capacity to boost plant health via nitrogen fixation and growth hormone generation. The segment's strong performance is further supported by various government initiatives across the region promoting organic and sustainable farming practices, responding to the growing demand for organic products in both domestic and international markets.
Horticultural and Cash Crops Segments in Asia-Pacific Biofertilizer Market
The horticultural crops segment, encompassing fruits and vegetables, represents the second-largest category in the biofertilizer market. The segment's growth is driven by increasing production and consumption of organic fruits and vegetables, despite higher production costs. Common fruits cultivated in the region include oranges, mangoes, grapes, bananas, dates, figs, apricots, olives, and cherries, while major vegetable crops include potato, onion, tomato, cauliflower, cabbage, beans, and eggplant. The cash crops segment, including products like sugar and organic tea, maintains a significant presence in the market. China and India have established themselves as the largest organic green and black tea producers respectively, contributing to the segment's stability. Both segments benefit from the rising consumer awareness and willingness to pay premium prices for organic produce, coupled with the increasing adoption of sustainable farming practices across the region.
Asia-Pacific Biofertilizer Market Geography Segment Analysis
Asia-Pacific Biofertilizer Market in China
China dominates the Asia-Pacific biofertilizer landscape, commanding approximately 93% of the regional market in 2024. The country's biofertilizer sector is primarily driven by its massive organic farming area, particularly in row crops, which account for over 82% of the market. Azotobacter biofertilizer has emerged as the leading segment, owing to its capacity to fix nitrogen aerobically and produce plant hormones. The market's robust performance is further supported by the country's strategic focus on sustainable agricultural practices and increasing awareness among farmers about the efficacy of biofertilizers in crop nutrients. The government's initiatives to promote organic farming and reduce chemical fertilizer usage have created a favorable environment for market growth. Chinese farmers are increasingly adopting biofertilizers as an eco-friendly alternative, particularly in regions with intensive agricultural practices. The country's vast agricultural land and growing emphasis on food security have made it a crucial market for biofertilizer manufacturers and suppliers.
Asia-Pacific Biofertilizer Market in Vietnam
Vietnam's biofertilizer market is poised for remarkable expansion, projected to grow at approximately 9% CAGR from 2024 to 2029. The country's biofertilizer sector is uniquely positioned with a strong focus on horticultural crops, which utilize the majority of biofertilizers. The mycorrhizal biofertilizer segment has established itself as the dominant force in the country's biofertilizer landscape, demonstrating superior efficacy in enhancing nutrient absorption and water uptake in plants. Vietnam's strategic push towards organic agriculture is evident in its ambitious goals to increase organic land area and enhance organic agricultural exports. The country has developed a robust ecosystem of organic agricultural producers, processors, and exporters, creating a strong foundation for biofertilizer market growth. Local farmers are increasingly recognizing the long-term benefits of biofertilizers in maintaining soil health and achieving sustainable crop yields. The government's supportive policies and growing international demand for organic products have created a conducive environment for market expansion.
Asia-Pacific Biofertilizer Market in India
India's biofertilizer market demonstrates significant potential, supported by the country's diverse climatic conditions that enable the cultivation of a wide range of crops. Mycorrhizal biofertilizer has emerged as the predominant biofertilizer type in the country, particularly valued for its significant mutualistic fungi relationship with plant roots. The government's proactive approach through initiatives like the All-India Network Programme on Organic Farming and One-acre Integrated Organic Farming System models has created a strong foundation for market growth. Indian farmers are increasingly adopting biofertilizers, particularly in row crops, which account for the majority of the market share. The country's robust distribution network, combined with growing awareness about sustainable farming practices, has facilitated wider adoption of biofertilizers. Local manufacturers are focusing on developing innovative products tailored to specific crop requirements and soil conditions, further driving market expansion.
Asia-Pacific Biofertilizer Market in Australia
Australia's biofertilizer market is characterized by its strong focus on sustainable agriculture and organic farming practices. The country's biofertilizer sector is dominated by mycorrhizal biofertilizer products, which have shown exceptional results in improving nutrient absorption and water uptake in various crops. Row crops constitute the majority of biofertilizer consumption, reflecting the country's extensive agricultural landscape. The Australian market benefits from advanced research and development capabilities, leading to innovative biofertilizer formulations. Farmers in Australia are increasingly embracing biofertilizers as part of their integrated nutrient management strategies, particularly in regions focusing on organic production. The country's stringent regulatory framework ensures high-quality biofertilizer products while promoting environmental sustainability. Local agricultural institutions actively promote the benefits of biofertilizers through demonstration programs and farmer education initiatives.
Asia-Pacific Biofertilizer Market in Other Countries
The biofertilizer market in other Asia-Pacific countries, including Japan, Indonesia, the Philippines, Thailand, and other smaller markets, exhibits diverse characteristics and growth patterns. These markets are witnessing increasing adoption of biofertilizers, driven by growing awareness about sustainable agriculture and environmental conservation. Each country has its unique agricultural focus and regulatory framework, influencing the adoption patterns of biofertilizers. Government initiatives promoting organic farming and sustainable agricultural practices are common across these markets. Local research institutions are actively involved in developing region-specific biofertilizer solutions. The distribution networks in these countries are continuously evolving, improving accessibility to biofertilizer products. Farmers in these regions are gradually shifting from conventional fertilizers to biological alternatives, recognizing the long-term benefits of sustainable farming practices.

Competitive Landscape
Top Companies in Asia-Pacific Biofertilizer Market
The leading companies in the Asia-Pacific biofertilizer market are actively engaged in expanding their product portfolios through continuous innovation and research. Companies are focusing on developing advanced microbial strains and improving formulation technologies to enhance product efficacy. Strategic partnerships with agricultural research institutions and local farming communities have become increasingly common to strengthen market presence. Many players are investing in expanding their distribution networks and establishing regional manufacturing facilities to better serve local markets. The industry has witnessed a growing trend of companies offering customized solutions based on specific crop requirements and soil conditions, along with technical support services to farmers. Market leaders are also emphasizing sustainable production practices and organic certification to align with growing environmental concerns and regulatory requirements.
Market Structure Shows Regional Player Dominance
The Asia-Pacific biofertilizer market exhibits a moderately fragmented structure with a mix of large state-owned enterprises, established agricultural input companies, and specialized biofertilizer manufacturers. State-owned enterprises, particularly in India and China, maintain significant market positions due to their established distribution networks and government support. The market is characterized by strong regional players who have a deep understanding of local agricultural practices and maintain close relationships with farming communities. These regional players often have advantages in terms of distribution channels and customer relationships over international competitors.
The industry has witnessed selective consolidation through strategic acquisitions and partnerships, particularly as larger agricultural input companies seek to expand their biological product portfolios. Joint ventures between local and international players have emerged as a preferred mode of market entry and expansion. Companies with strong research and development capabilities are increasingly becoming attractive acquisition targets for larger agricultural input manufacturers looking to strengthen their position in the biological products segment. The market also sees active participation from agricultural cooperatives and farmer-owned enterprises, especially in countries with strong cooperative movements.
Innovation and Distribution Key to Growth
Success in the Asia-Pacific biofertilizer market increasingly depends on companies' ability to develop innovative products while maintaining strong distribution networks. Market leaders are investing in advanced research facilities and collaborating with agricultural universities to develop more effective microbial strains and application technologies. Companies are also focusing on improving product shelf life and stability under various environmental conditions, which has been a traditional challenge in the biofertilizer segment. Building strong relationships with agricultural extension services and farmer organizations has become crucial for market penetration and product adoption. Successful players are implementing integrated marketing approaches that combine product demonstrations, farmer education programs, and technical support services.
For new entrants and smaller players, specialization in specific crop segments or regional markets offers a viable path to growth. Companies are increasingly focusing on developing niche products for high-value crops and organic farming segments. The ability to provide comprehensive crop nutrition solutions, rather than standalone products, is becoming increasingly important. Regulatory compliance and organic certification are emerging as critical success factors, particularly as governments implement stricter guidelines for biological products. Companies that can demonstrate a clear value proposition through improved crop yields and reduced chemical fertilizer usage are better positioned to gain market share. Building robust supply chains and maintaining product quality consistency will be crucial for long-term success in this evolving market. Additionally, the integration of agricultural inoculants and agricultural probiotics into product lines is gaining traction, offering enhanced soil health and crop productivity. The marketing of biofertilizers is increasingly focusing on these benefits to appeal to environmentally conscious farmers. Furthermore, the development of organic soil supplements is aligning with the growing demand for sustainable agricultural practices.
Asia-Pacific Biofertilizer Industry Leaders
Biostadt India Limited
Gujarat State Fertilizers & Chemicals Ltd
Indian Farmers Fertiliser Cooperative Limited
Kiwa Bio-Tech
The Fertilizers and Chemicals Travancore Limited
- *Disclaimer: Major Players sorted in no particular order


Recent Industry Developments
- September 2022: Corteva Agriscience agreed to acquire Symborg Inc. to strengthen its global presence with a strong distribution network.
- January 2021: Atlántica Agrícola’s developed Micomix, a biostimulant composed primarily of mycorrhizal fungi, rhizobacteria, and chelated micronutrients. The presence and development of these microorganisms in the rhizosphere create a symbiotic relationship with the plant that favors the absorption of water and mineral nutrients and increases its tolerance to water and salt stress.
- November 2019: IPL Biologicals Limited launched four new biofertilizer products, including Nitrogcea, Phosphacea, Potacea, and Zinkaacea, in Maharashtra, India.


Asia-Pacific Biofertilizer Market Report Scope
Azospirillum, Azotobacter, Mycorrhiza, Phosphate Solubilizing Bacteria, Rhizobium are covered as segments by Form. Cash Crops, Horticultural Crops, Row Crops are covered as segments by Crop Type. Australia, China, India, Indonesia, Japan, Philippines, Thailand, Vietnam are covered as segments by Country.By Form
| Rhizobium |
| Azospirillum |
| Azotobacter |
| Mycorrhiza |
| Phosphate-Solubilizing Bacteria |
| Other Biofertilizer |
By Crop Type
| Row Crops |
| Horticultural Crops |
| Cash Crops |
By Country
| China |
| India |
| Japan |
| Australia |
| Vietnam |
| Thailand |
| Indonesia |
| Philippines |
| Rest of Asia-Pacific |
| By Form | Rhizobium |
| Azospirillum | |
| Azotobacter | |
| Mycorrhiza | |
| Phosphate-Solubilizing Bacteria | |
| Other Biofertilizer | |
| By Crop Type | Row Crops |
| Horticultural Crops | |
| Cash Crops | |
| By Country | China |
| India | |
| Japan | |
| Australia | |
| Vietnam | |
| Thailand | |
| Indonesia | |
| Philippines | |
| Rest of Asia-Pacific |


Market Definition
- AVERAGE DOSAGE RATE - The average application rate is the average volume of biofertilizers applied per hectare of farmland in the respective region/country.
- CROP TYPE - Crop type includes Row crops (Cereals, Pulses, Oilseeds), Horticultural Crops (Fruits and vegetables) and Cash Crops (Plantation Crops, Fibre Crops and Other Industrial Crops)
- FUNCTION - The crop nutrition function of agricultural biological consists of various products that provide essential plant nutrients and enhance soil quality.
- TYPE - Biofertilizers enhance soil quality by increasing the population of beneficial microorganisms. They help crops absorb nutrients from the environment.
| Keyword | Definition |
|---|---|
| Cash Crops | Cash crops are non-consumable crops sold as a whole or part of the crop to manufacture end-products to make a profit. |
| Integrated Pest Management (IPM) | IPM is an environment-friendly and sustainable approach to control pests in various crops. It involves a combination of methods, including biological controls, cultural practices, and selective use of pesticides. |
| Bacterial biocontrol agents | Bacteria used to control pests and diseases in crops. They work by producing toxins harmful to the target pests or competing with them for nutrients and space in the growing environment. Some examples of commonly used bacterial biocontrol agents include Bacillus thuringiensis (Bt), Pseudomonas fluorescens, and Streptomyces spp. |
| Plant Protection Product (PPP) | A plant protection product is a formulation applied to crops to protect from pests, such as weeds, diseases, or insects. They contain one or more active substances with other co-formulants such as solvents, carriers, inert material, wetting agents or adjuvants formulated to give optimum product efficacy. |
| Pathogen | A pathogen is an organism causing disease to its host, with the severity of the disease symptoms. |
| Parasitoids | Parasitoids are insects that lay their eggs on or within the host insect, with their larvae feeding on the host insect. In agriculture, parasitoids can be used as a form of biological pest control, as they help to control pest damage to crops and decrease the need for chemical pesticides. |
| Entomopathogenic Nematodes (EPN) | Entomopathogenic nematodes are parasitic roundworms that infect and kill pests by releasing bacteria from their gut. Entomopathogenic nematodes are a form of biocontrol agents used in agriculture. |
| Vesicular-arbuscular mycorrhiza (VAM) | VAM fungi are mycorrhizal species of fungus. They live in the roots of different higher-order plants. They develop a symbiotic relationship with the plants in the roots of these plants. |
| Fungal biocontrol agents | Fungal biocontrol agents are the beneficial fungi that control plant pests and diseases. They are an alternative to chemical pesticides. They infect and kill the pests or compete with pathogenic fungi for nutrients and space. |
| Biofertilizers | Biofertilizers contain beneficial microorganisms that enhance soil fertility and promote plant growth. |
| Biopesticides | Biopesticides are natural/bio-based compounds used to manage agricultural pests using specific biological effects. |
| Predators | Predators in agriculture are the organisms that feed on pests and help control pest damage to the crops. Some common predator species used in agriculture include ladybugs, lacewings, and predatory mites. |
| Biocontrol agents | Biocontrol agents are living organisms used to control pests and diseases in agriculture. They are alternatives to chemical pesticides and are known for their lesser impact on the environment and human health. |
| Organic Fertilizers | Organic fertilizer is composed of animal or vegetable matter used alone or in combination with one or more non-synthetically derived elements or compounds used for soil fertility and plant growth. |
| Protein hydrolysates (PHs) | Protein hydrolysate-based biostimulants contain free amino acids, oligopeptides, and polypeptides produced by enzymatic or chemical hydrolysis of proteins, primarily from vegetal or animal sources. |
| Biostimulants/Plant Growth Regulators (PGR) | Biostimulants/Plant Growth Regulators (PGR) are substances derived from natural resources to enhance plant growth and health by stimulating plant processes (metabolism). |
| Soil Amendments | Soil Amendments are substances applied to soil that improve soil health, such as soil fertility and soil structure. |
| Seaweed Extract | Seaweed extracts are rich in micro and macronutrients, proteins, polysaccharides, polyphenols, phytohormones, and osmolytes. These substances boost seed germination and crop establishment, total plant growth and productivity. |
| Compounds related to biocontrol and/or promoting growth (CRBPG) | Compounds related to biocontrol or promoting growth (CRBPG) are the ability of a bacteria to produce compounds for phytopathogen biocontrol and plant growth promotion. |
| Symbiotic Nitrogen-Fixing Bacteria | Symbiotic nitrogen-fixing bacteria such as Rhizobium obtain food and shelter from the host, and in return, they help by providing fixed nitrogen to the plants. |
| Nitrogen Fixation | Nitrogen fixation is a chemical process in soil which converts molecular nitrogen into ammonia or related nitrogenous compounds. |
| ARS (Agricultural Research Service) | ARS is the U.S. Department of Agriculture's chief scientific in-house research agency. It aims to find solutions to agricultural problems faced by the farmers in the country. |
| Phytosanitary Regulations | Phytosanitary regulations imposed by the respective government bodies check or prohibit the importation and marketing of certain insects, plant species, or products of these plants to prevent the introduction or spread of new plant pests or pathogens. |
| Ectomycorrhizae (ECM) | Ectomycorrhiza (ECM) is a symbiotic interaction of fungi with the feeder roots of higher plants in which both the plant and the fungi benefit through the association for survival. |


Research Methodology
Mordor Intelligence follows a four-step methodology in all our reports.
- Step-1: Identify Key Variables: In order to build a robust forecasting methodology, the variables and factors identified in Step-1 are tested against available historical market numbers. Through an iterative process, the variables required for market forecast are set and the model is built on the basis of these variables.
- Step-2: Build a Market Model: Market-size estimations for the forecast years are in nominal terms. Inflation is not a part of the pricing, and the average selling price (ASP) is kept constant throughout the forecast period.
- Step-3: Validate and Finalize: In this important step, all market numbers, variables and analyst calls are validated through an extensive network of primary research experts from the market studied. The respondents are selected across levels and functions to generate a holistic picture of the market studied.
- Step-4: Research Outputs: Syndicated Reports, Custom Consulting Assignments, Databases & Subscription Platforms.


