Market Overview
| Study Period | 2021 - 2031 |
|---|---|
| Forecast Data Period | 2026 - 2031 |
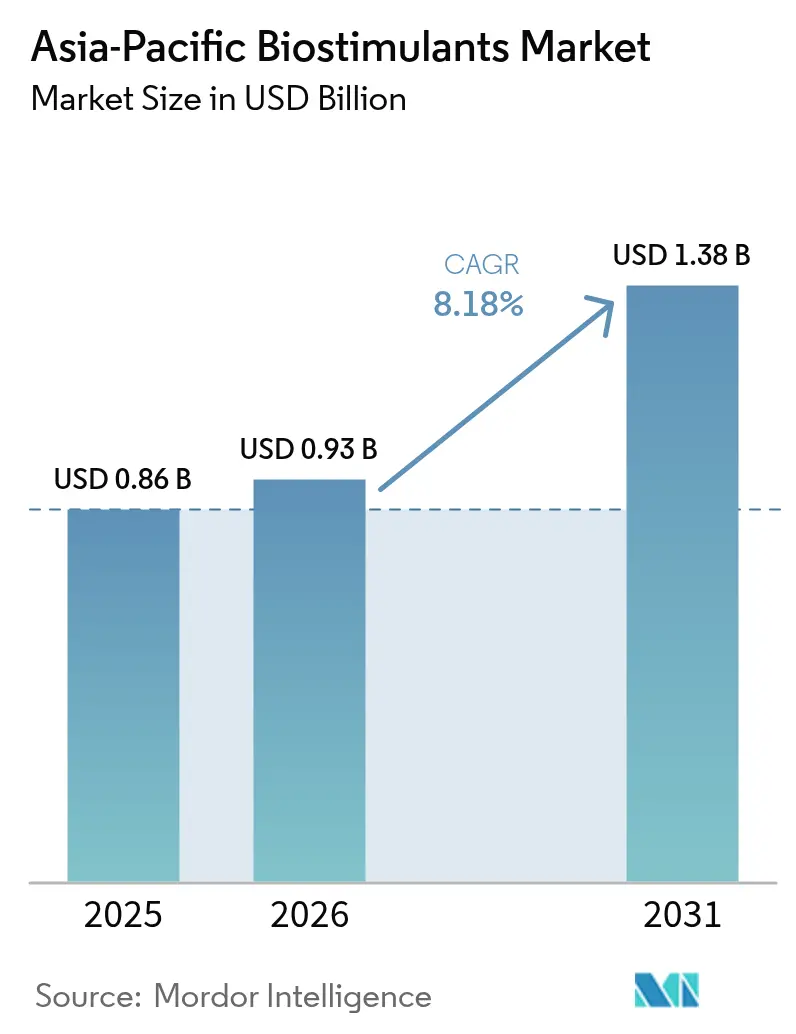
| Base Year Market Size (2025) | USD 0.86 Billion |
| Market Size (2026) | USD 0.93 Billion |
| Market Size (2031) | USD 1.38 Billion |
| Growth Rate (2026 - 2031) | 8.18% CAGR |
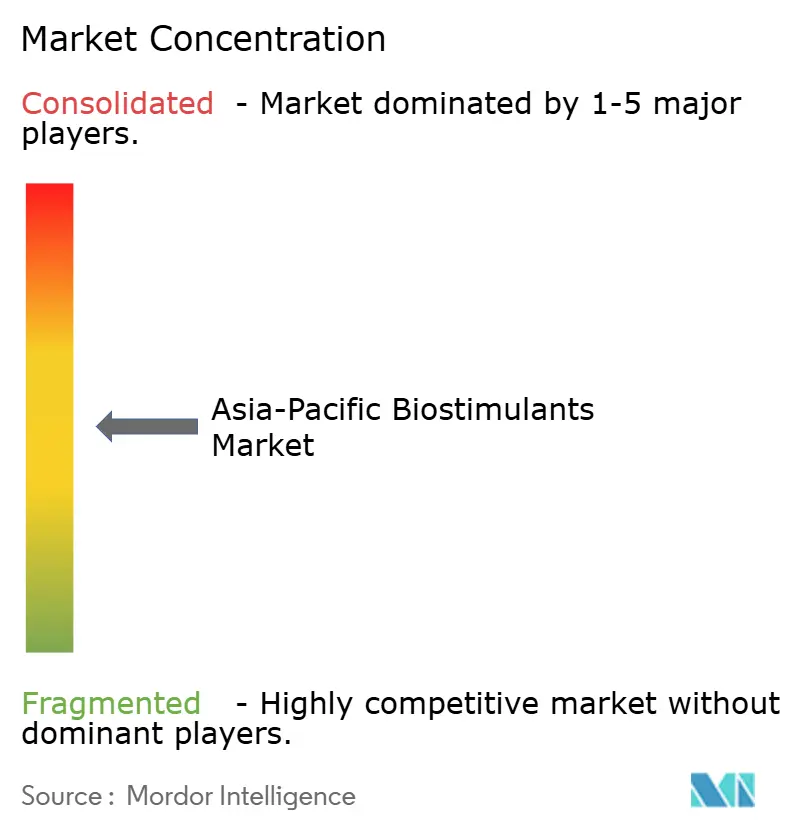
| Market Concentration | Medium |
Major Players *Disclaimer: Major Players sorted in no particular order Image © Mordor Intelligence. Reuse requires attribution under CC BY 4.0. | |
Asia-Pacific Biostimulants Market Analysis by Mordor Intelligence
The Asia-Pacific biostimulants market size in 2026 is estimated at USD 0.93 billion, growing from 2025 value of USD 0.86 billion with 2031 projections showing USD 1.38 billion, growing at 8.18% CAGR over 2026-2031. Current expansion benefits from the region’s dominant position in global seaweed farming, which supplies 98% of all cultivated biomass and delivers a clear cost edge for local manufacturers. Government subsidies that lower the effective purchase price of biological inputs, rising consumer demand for residue-free food, and the wider availability of e-commerce ag-input platforms are strengthening market pull. Technology investments in advanced extraction methods are raising product efficacy, while growers of controlled-environment vegetables in metropolitan areas such as Singapore and Tokyo prefer low-residue inputs that align with strict food-safety rules. At the same time, climate variability across India, Vietnam, and coastal China is forcing farmers to adopt biostimulants to protect yields against heat, drought, and salinity stress.
Key Report Takeaways
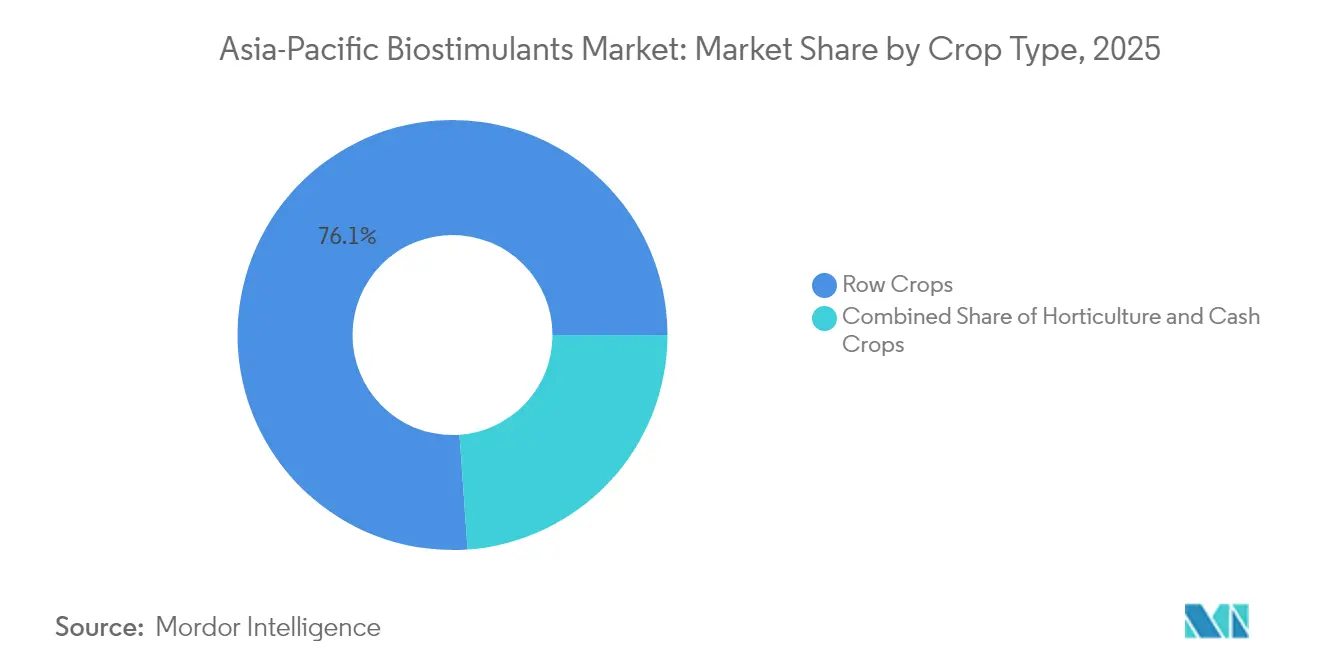
- By crop type, row crops led with 76.12% revenue share of the Asia-Pacific biostimulants market in 2025, and are projected to expand at an 8.28% CAGR through 2031.
- By form, amino acids captured 25.35% of the Asia-Pacific biostimulants market share in 2025, and humic acid products are advancing at a 9.62% CAGR to 2031.
- By geography, China held 27.65% of the Asia-Pacific biostimulants market size in 2025 and is forecast to grow at a 9.23% CAGR through 2031.
- The top five companies accounted for nearly a 55% share of the Asia-Pacific biostimulants market in 2024, reflecting moderate concentration across the region.
Note: Market size and forecast figures in this report are generated using Mordor Intelligence’s proprietary estimation framework, updated with the latest available data and insights as of 2026.
Asia-Pacific Biostimulants Market Trends and Insights
Drivers Impact Analysis*
| Driver | (~) % Impact on CAGR Forecast | Geographic Relevance | Impact Timeline |
|---|---|---|---|
| Government subsidies for sustainable inputs | +1.8% | India, China, Thailand | Medium term (2-4 years) |
| Surge in organic and residue-free food demand | +1.5% | Japan, Australia, urban Asia-Pacific | Short term (≤ 2 years) |
| Seaweed cultivation boom improves feedstock supply | +1.2% | Indonesia, Philippines, and coastal China | Long term (≥ 4 years) |
| Climate-driven abiotic stress mitigation needs | +1.0% | India, Vietnam, and drought-prone areas | Medium term (2-4 years) |
| E-commerce ag-input platforms widen last-mile reach | +0.8% | India, Malaysia, rural markets | Short term (≤ 2 years) |
| Urban CEA growth requires low-residue inputs | +0.5% | Singapore, Japan, urban India | Long term (≥ 4 years) |
| Source: Mordor Intelligence | |||
Government Subsidies For Sustainable Inputs
Multiple programs are tipping grower economics toward biological solutions such as seaweed extracts and humic acids. As of January 30, 2025, the Government of India has disbursed INR 2,265.86 crore (USD 257 million) under the Paramparagat Krishi Vikas Yojana (PKVY) since its inception, supporting over 2.5 million farmers [1]Source: Ministry of Agriculture and Farmers Welfare, “Paramparagat Krishi Vikas Yojana Guidelines,” agricoop.nic.in. Chinese provinces match the national direction with voucher systems that lower the shelf price of certified biostimulants in local cooperatives. Thailand channels Bio-Circular-Green funds through ag-bank micro-loans, letting smallholders spread costs over three harvests. Japan adds an income-support bonus when certified biological inputs are used on land enrolled in its Green Food System strategy. Together, these actions embed biostimulants in mainstream nutrient-management plans rather than niche organic programs.
Surge in Organic and Residue-Free Food Demand
Urban shoppers in Tokyo, Sydney, and Shanghai reward residue-free labels with price premiums of 30–50%, a spread large enough to offset the extra cost of foliar bio-solutions. Retail chains reinforce the trend by adding “no synthetic fertilizer” seals to in-store signage, creating direct visibility for growers who adopt biostimulants. Export buyers of Australian almonds and Vietnamese dragon fruit now ask for product-application logs within traceability files. This transparency pushes producers to use inputs that leave no chemical footprint and improve sensory traits such as sweetness and shelf life. As a result, cash-crop farmers calculate a higher net margin when they switch from purely mineral fertilizer programs to integrated packages that include biological stimulants. The structural demand shift keeps the Asia-Pacific biostimulants market on an upward price trajectory.
Seaweed Cultivation Boom Improves Feedstock Supply
Asia-Pacific grows 98% of cultured seaweed, so processors in Shandong, Cebu, and Makassar enjoy raw-material proximity that European and North American peers cannot match. Vertical integration from rafts to refinery allows companies to lock in consistent quality and shorten the harvest-to-extraction interval, preserving bioactive content. Indonesia’s Eucheuma farmers now adopt floating-line designs that cut ice-ice disease losses, keeping supply stable even during warmer El Niño cycles. Chinese refiners invest in low-temperature enzymatic reactors that lift carrageenan extraction efficiency by 15%, lowering unit costs for downstream biostimulant grades. Governments further support the chain by funding cold-storage depots and farmer-training centers, tightening control over moisture and contamination. These elements combine to anchor the cost leadership that underpins the Asia-Pacific biostimulants market advantage.
Climate-Driven Abiotic Stress Mitigation Needs
Heat waves, drought, and salinity intrusion are no longer episodic; they shape planting calendars across South and Southeast Asia. Trials by the International Rice Research Institute show that seaweed-based foliar sprays preserve chlorophyll and spikelet fertility at temperatures above 40 °C, ensuring yield stability. Growers in the Mekong Delta deploy amino-acid blends at panicle initiation to counter salt stress as tidal surges push brackish water inland. Provincial extension officers document fewer crop failures when humic acids are dripped through irrigation during dry spells in Rajasthan. Insurance schemes in India now offer lower premiums when policyholders adopt certified biostimulants that reduce abiotic-stress loss ratios. These practical gains pull climate-smart inputs deeper into core cereal systems.
Restraints Impact Analysis*
| Restraint | (~) % Impact on CAGR Forecast | Geographic Relevance | Impact Timeline |
|---|---|---|---|
| Fragmented and shifting regulations | –1.2% | ASEAN, India | Medium term (2-4 years) |
| Low farmer awareness and quality variance | –0.9% | Indonesia, Philippines | Short term (≤ 2 years) |
| Seaweed biomass disease and climate risks | –0.7% | Indonesia, Malaysia | Long term (≥ 4 years) |
| Heavy-metal contamination in marine raw materials | –0.4% | Pacific Island supply chains | Medium term (2-4 years) |
| Source: Mordor Intelligence | |||
Fragmented And Shifting Regulations
ASEAN lacks a unified biostimulant code, forcing manufacturers to customize dossiers for each jurisdiction and run redundant field trials. Indonesia’s separate efficacy requirement alone can consume six to nine months, while Thailand may waive trials but demands local residue data. India’s 2024 Fertilizer Control Order amendments reclassified several existing products, compelling companies to resubmit paperwork and retest shelf life. China ties foreign approvals to domestic manufacturing partnerships, pushing multinationals into joint ventures that dilute economic returns. Compliance budgets rise 15–25% as firms juggle divergent label-format rules and language mandates. The resulting delays hamper first-mover advantages in fast-growing niches within the Asia-Pacific biostimulants market.
Low Farmer Awareness and Quality Variance
Field surveys in South Sulawesi reveal that two-thirds of smallholders cannot distinguish a biostimulant from a foliar fertilizer, reducing willingness to invest [2]Source: Ministry of Agriculture Indonesia, “Agricultural Extension Services Report,” pertanian.go.id. Counterfeit labels that mimic leading brands erode trust after substandard performance, so farmers default to known chemical inputs. Training sessions reach just 12% of rice growers in central Java, leaving a large knowledge gap on correct dilution rates and spray timings. Uneven product quality compounds skepticism, as humic-acid content can vary more than 30% between batches from small local producers. Cooperative demonstration plots improve perception, yet limited acreage slows diffusion. Bridging these awareness and quality gaps remains critical to unlocking the full value of the Asia-Pacific biostimulants market.
*Our forecasts treat driver/restraint impacts as directional, not additive. The impact forecasts reflect baseline growth, mix effects, and variable interactions.
Segment Analysis
By Form: Amino Acids Lead While Humic Acid Accelerates
Amino acids captured 25.35% of the Asia-Pacific biostimulants market share in 2025, making them the most widely used formulation across the region. Growers favor these protein hydrolysates because they move quickly into plant cells and support protein synthesis during heat or drought, which keeps yields steady in high-value crops such as tomatoes, peppers, and strawberries. Within the overall Asia-Pacific biostimulants market size, seaweed extracts held a prominent share as coastal processors in Indonesia and China convert low-cost Kappaphycus feedstock into liquid concentrates that cost 30–40% less than imported brands.
Humic acids posted the fastest growth at a 9.62% CAGR to 2031 as cereal growers turned to these carbon-rich compounds to rebuild tired soils and vertical-farm operators used them to stabilize pH in nutrient tanks. Technology upgrades are broadening the appeal of each form group. Seaweed processors now use low-temperature enzymatic extraction that lifts bioactive yield by 15%, lowering dose rates for farmers. Fulvic acids, is growing at a significant rate per year, pair well with drip irrigation because their small molecules move micronutrients toward roots in calcareous soils. As these innovations roll out, input dealers bundle multiple product types in one advisory package, helping growers mix amino acids for stress days, humic acids for soil repair, and seaweed extracts for flowering, thereby deepening customer loyalty across the Asia-Pacific biostimulants market.
By Crop Type: Row Crops Strengthen Dominance Across Applications
Row crops controlled 76.12% of the Asia-Pacific biostimulants market size in 2025 and are advancing at 8.28% CAGR during 2026-2031 as public extension agents bundled biologicals with subsidized seed and fertilizer packs in large rice, wheat, corn, and soybean tracts. Even a modest 6% yield bump on thousands of hectares pays for a season’s biostimulant spend, so cooperatives place repeat orders to hedge weather risk. Wider pivot to biologicals also helps governments hit chemical-fertilizer reduction targets without sacrificing grain output, a critical balance for food-security plans.
Cash crops account for a significant share owing to its organic tea, coffee, and cacao estates earning price premiums when residue audits show clean test reports. Horticultural crops such as peppers, melons, and cut flowers follow closely and are growing at 7.72% CAGR as supermarket buyers demand consistent color and shelf life that biologicals can deliver. Remote-sensing tools feed real-time leaf-area data to mobile apps that suggest exact spray timings, which boosts return on investment and keeps wastage low across all crop groups. The resulting efficiency gains sustain the momentum of the Asia-Pacific biostimulants market while pushing biological inputs deeper into mainstream fertilization programs.


Geography Analysis
China led the region with 27.65% market share in 2025 and is growing at a 9.23% CAGR. The government earmarked CNY 50 billion (USD 7.1 billion) to promote green inputs under its current Five-Year Plan, and provincial subsidy portals reimburse up to half of farmers’ purchase invoices. Shandong’s dense seaweed-to-biostimulant industrial corridor provides feedstock security, while foreign firms enter joint ventures to localize formulations that match coastal soil salinity profiles. University-linked incubators in Fujian are patenting polysaccharide extraction methods that shorten processing cycles.
India captured a significant share of revenue in 2025 and expanded at an 8.07% CAGR, powered by cooperative distribution channels and diverse agro-ecologies from rain-fed sorghum in Karnataka to irrigated rice in Tamil Nadu. Public research institutes validate humic and amino-acid blends under multi-location trials, supporting label claims that resonate with price-sensitive smallholders. Biostadt India and domestic start-ups such as Sea6 Energy leverage local seaweed harvests from the Gulf of Mannar, reducing foreign exchange exposure.
Developed markets such as Japan and Australia provide premium growth pockets. Growers of greenhouse tomatoes near Osaka emphasize low-residue compliance in keeping with supermarket procurement codes. Australia’s organic grain exporters in Victoria employ seaweed foliar sprays to meet destination-market documentation requirements. Southeast Asian nations, notably Indonesia and the Philippines, pair an abundant seaweed supply with emerging regulatory reforms that slowly reduce compliance friction, thus broadening the addressable base for the Asia-Pacific biostimulants market.
Competitive Landscape
The top five suppliers hold a prominent share of regional revenue, reflecting moderate concentration that still leaves room for niche innovators. Biostadt India commands a leading share through its Biozyme seaweed line and a 6,500-point dealer network serving cooperatives and input retailers. Biolchim holds a significant share, capitalizing on a broad amino-acid and humic portfolio tailored to high-value horticulture. Valagro and Acadian Plant Health focus on vertical integration, forging supply contracts with Indonesian Eucheuma growers and operating proprietary extraction lines in Java and Shandong [3]Source: Acadian Plant Health, “Partnership Announcements,” acadianplanthealth.com.
Strategic activity is brisk. BASF entered a research pact with Anhui Huaheng Biotechnology in mid-2024 to co-develop region-specific liquid formulations. Bayer launched An Hai Long in April 2025, a seaweed extract that claims a 15–20% yield lift in rice and wheat under stress. Krishak Bharati Cooperative Limited (KRIBHCO) paired with Novonesis to produce low-cost biostimulants in Gujarat, leveraging cooperative distribution to penetrate the smallholder segment. Patenting has shifted from macro-ingredient claims to delivery technologies such as micro-encapsulation and nano-chelates, indicating that the Asia-Pacific biostimulants industry is maturing toward functional differentiation.
Competitive gaps persist in precision-agriculture-ready products, Controlled Environment Agriculture (CEA)-specific blends, and contamination-free marine supply chains. Companies that can prove consistent bioactive content and integrate digital advisory systems stand to capture incremental share as farmers adopt more data-driven management practices. Given the current share distribution, the Asia-Pacific biostimulants market concentration sits in the mid-range, promoting healthy rivalry without deterring new entrants.
Asia-Pacific Biostimulants Industry Leaders
Biostadt India Limited
T. Stanes and Company Limited
Biolchim SpA (J.M. Huber Corporation)
Valagro (Syngenta Group)
Atlántica Agrícola
- *Disclaimer: Major Players sorted in no particular order

Recent Industry Developments
- May 2025: Mosaic rolled out Neptunion, its newest biostimulant, to growers in China. The water-soluble formulation fits into the company’s growth roadmap and is designed to help crops cope with drought, salty soils, and high temperatures by building stress resilience.
- April 2025: Bayer introduced An Hai Long seaweed biostimulant in China, formulated with Ascophyllum nodosum extract to enhance stress tolerance, root growth, and nutrient uptake in crops such as rice, wheat, vegetables, and fruits.
- September 2024: Syngenta and Provivi formed a collaboration to advance pheromone-based pest management solutions integrated with biostimulant programs for growers across Asia-Pacific.


Asia-Pacific Biostimulants Market Report Scope
Amino Acids, Fulvic Acid, Humic Acid, Protein Hydrolysates, Seaweed Extracts are covered as segments by Form. Cash Crops, Horticultural Crops, Row Crops are covered as segments by Crop Type. Australia, China, India, Indonesia, Japan, Philippines, Thailand, Vietnam are covered as segments by Country.By Form
| Humic Acid |
| Fulvic Acid |
| Amino Acids |
| Protein Hydrolysates |
| Seaweed Extracts |
| Other Biostimulants |
By Crop Type
| Row Crops |
| Horticultural Crops |
| Cash Crops |
By Geography
| China |
| India |
| Japan |
| Australia |
| Vietnam |
| Thailand |
| Indonesia |
| Philippines |
| Rest of Asia-Pacific |
| By Form | Humic Acid |
| Fulvic Acid | |
| Amino Acids | |
| Protein Hydrolysates | |
| Seaweed Extracts | |
| Other Biostimulants | |
| By Crop Type | Row Crops |
| Horticultural Crops | |
| Cash Crops | |
| By Geography | China |
| India | |
| Japan | |
| Australia | |
| Vietnam | |
| Thailand | |
| Indonesia | |
| Philippines | |
| Rest of Asia-Pacific |


Market Definition
- AVERAGE DOSAGE RATE - The average application rate is the average volume of biostimulants applied per hectare of farmland in the respective region/country.
- CROP TYPE - Crop type includes Row crops (Cereals, Pulses, Oilseeds), Horticultural Crops (Fruits and vegetables) and Cash Crops (Plantation Crops, Fibre Crops and Other Industrial Crops)
- FUNCTION - The Crop Protection function of agirucultural biological include products that prevent or control various biotic and abiotic stress.
- TYPE - Biostimulants boost crop growth and yield by preventing or controlling various abiotic stresses.
| Keyword | Definition |
|---|---|
| Cash Crops | Cash crops are non-consumable crops sold as a whole or part of the crop to manufacture end-products to make a profit. |
| Integrated Pest Management (IPM) | IPM is an environment-friendly and sustainable approach to control pests in various crops. It involves a combination of methods, including biological controls, cultural practices, and selective use of pesticides. |
| Bacterial biocontrol agents | Bacteria used to control pests and diseases in crops. They work by producing toxins harmful to the target pests or competing with them for nutrients and space in the growing environment. Some examples of commonly used bacterial biocontrol agents include Bacillus thuringiensis (Bt), Pseudomonas fluorescens, and Streptomyces spp. |
| Plant Protection Product (PPP) | A plant protection product is a formulation applied to crops to protect from pests, such as weeds, diseases, or insects. They contain one or more active substances with other co-formulants such as solvents, carriers, inert material, wetting agents or adjuvants formulated to give optimum product efficacy. |
| Pathogen | A pathogen is an organism causing disease to its host, with the severity of the disease symptoms. |
| Parasitoids | Parasitoids are insects that lay their eggs on or within the host insect, with their larvae feeding on the host insect. In agriculture, parasitoids can be used as a form of biological pest control, as they help to control pest damage to crops and decrease the need for chemical pesticides. |
| Entomopathogenic Nematodes (EPN) | Entomopathogenic nematodes are parasitic roundworms that infect and kill pests by releasing bacteria from their gut. Entomopathogenic nematodes are a form of biocontrol agents used in agriculture. |
| Vesicular-arbuscular mycorrhiza (VAM) | VAM fungi are mycorrhizal species of fungus. They live in the roots of different higher-order plants. They develop a symbiotic relationship with the plants in the roots of these plants. |
| Fungal biocontrol agents | Fungal biocontrol agents are the beneficial fungi that control plant pests and diseases. They are an alternative to chemical pesticides. They infect and kill the pests or compete with pathogenic fungi for nutrients and space. |
| Biofertilizers | Biofertilizers contain beneficial microorganisms that enhance soil fertility and promote plant growth. |
| Biopesticides | Biopesticides are natural/bio-based compounds used to manage agricultural pests using specific biological effects. |
| Predators | Predators in agriculture are the organisms that feed on pests and help control pest damage to the crops. Some common predator species used in agriculture include ladybugs, lacewings, and predatory mites. |
| Biocontrol agents | Biocontrol agents are living organisms used to control pests and diseases in agriculture. They are alternatives to chemical pesticides and are known for their lesser impact on the environment and human health. |
| Organic Fertilizers | Organic fertilizer is composed of animal or vegetable matter used alone or in combination with one or more non-synthetically derived elements or compounds used for soil fertility and plant growth. |
| Protein hydrolysates (PHs) | Protein hydrolysate-based biostimulants contain free amino acids, oligopeptides, and polypeptides produced by enzymatic or chemical hydrolysis of proteins, primarily from vegetal or animal sources. |
| Biostimulants/Plant Growth Regulators (PGR) | Biostimulants/Plant Growth Regulators (PGR) are substances derived from natural resources to enhance plant growth and health by stimulating plant processes (metabolism). |
| Soil Amendments | Soil Amendments are substances applied to soil that improve soil health, such as soil fertility and soil structure. |
| Seaweed Extract | Seaweed extracts are rich in micro and macronutrients, proteins, polysaccharides, polyphenols, phytohormones, and osmolytes. These substances boost seed germination and crop establishment, total plant growth and productivity. |
| Compounds related to biocontrol and/or promoting growth (CRBPG) | Compounds related to biocontrol or promoting growth (CRBPG) are the ability of a bacteria to produce compounds for phytopathogen biocontrol and plant growth promotion. |
| Symbiotic Nitrogen-Fixing Bacteria | Symbiotic nitrogen-fixing bacteria such as Rhizobium obtain food and shelter from the host, and in return, they help by providing fixed nitrogen to the plants. |
| Nitrogen Fixation | Nitrogen fixation is a chemical process in soil which converts molecular nitrogen into ammonia or related nitrogenous compounds. |
| ARS (Agricultural Research Service) | ARS is the U.S. Department of Agriculture's chief scientific in-house research agency. It aims to find solutions to agricultural problems faced by the farmers in the country. |
| Phytosanitary Regulations | Phytosanitary regulations imposed by the respective government bodies check or prohibit the importation and marketing of certain insects, plant species, or products of these plants to prevent the introduction or spread of new plant pests or pathogens. |
| Ectomycorrhizae (ECM) | Ectomycorrhiza (ECM) is a symbiotic interaction of fungi with the feeder roots of higher plants in which both the plant and the fungi benefit through the association for survival. |


Research Methodology
Mordor Intelligence follows a four-step methodology in all our reports.
- Step-1: Identify Key Variables: In order to build a robust forecasting methodology, the variables and factors identified in Step-1 are tested against available historical market numbers. Through an iterative process, the variables required for market forecast are set and the model is built on the basis of these variables.
- Step-2: Build a Market Model: Market-size estimations for the forecast years are in nominal terms. Inflation is not a part of the pricing, and the average selling price (ASP) is kept constant throughout the forecast period.
- Step-3: Validate and Finalize: In this important step, all market numbers, variables and analyst calls are validated through an extensive network of primary research experts from the market studied. The respondents are selected across levels and functions to generate a holistic picture of the market studied.
- Step-4: Research Outputs: Syndicated Reports, Custom Consulting Assignments, Databases & Subscription Platforms.


