Asia-Pacific Organic Fertilizer Market Size and Share
Market Overview
| Study Period | 2018 - 2031 |
|---|---|
| Forecast Data Period | 2026 - 2031 |
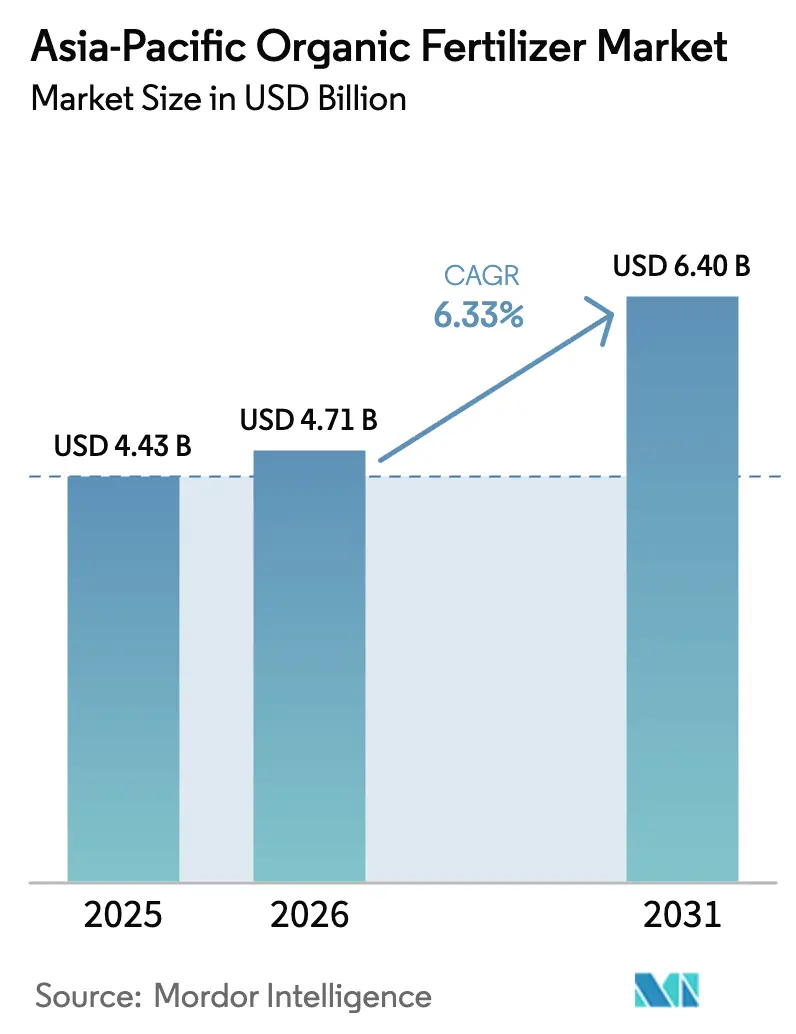
| Base Year Market Size (2025) | USD 4.43 Billion |
| Market Size (2026) | USD 4.71 Billion |
| Market Size (2031) | USD 6.4 Billion |
| Growth Rate (2026 - 2031) | 6.33% CAGR |
| Market Concentration | Low |
Major Players *Disclaimer: Major Players sorted in no particular order Image © Mordor Intelligence. Reuse requires attribution under CC BY 4.0. | |
Asia-Pacific Organic Fertilizer Market Analysis by Mordor Intelligence
Asia-Pacific organic fertilizer market size in 2026 is estimated at USD 4.71 billion, growing from 2025 value of USD 4.43 billion with 2031 projections showing USD 6.4 billion, growing at 6.33% CAGR over 2026-2031. Rapidly expanding subsidy programs, a growing preference for chemical-free food, and the scaling of e-commerce input channels are widening the user base across both smallholder and commercial farms. The intensification of soil-health mandates, especially in China and India, has transformed organic amendments from a niche product into a mainstream soil-restoration tool. Manure-based offerings benefit from plentiful livestock waste and circular economy policies, while microbial consortia address nutrient density gaps, boosting yield reliability. The nascent rise of cold-chain packaging solutions in humid coastal areas further safeguards product viability and improves farmer confidence[1]Source: Food and Agriculture Organization, “Agricultural Subsidies and Organic Farming Initiatives in Asia-Pacific,” fao.org.
Key Report Takeaways
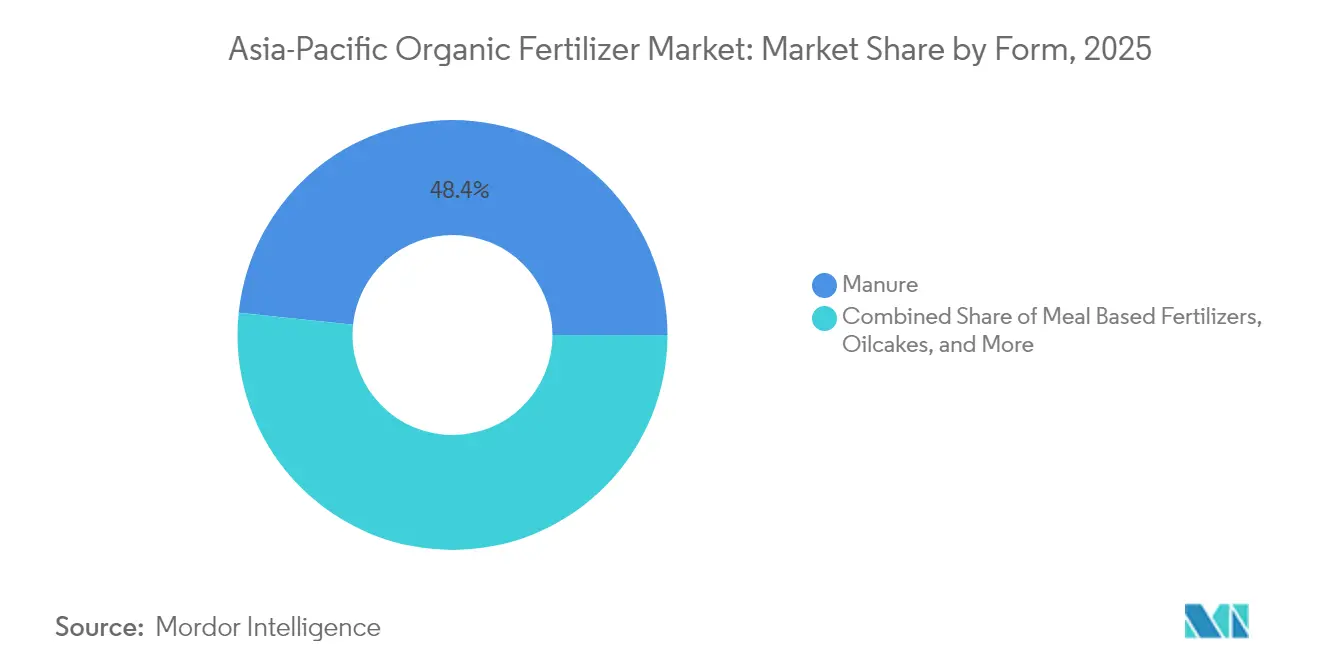
- By form, manure products led with 48.35% Asia-Pacific organic fertilizer market share in 2025, and are projected to expand at a 6.72% CAGR to 2031.
- By crop type, row crops accounted for 79.10% of the Asia-Pacific organic fertilizer market share in 2025, while cash crops are forecast to grow at a 6.66% CAGR through 2031.
- By country, China commanded 79.05% share of the Asia-Pacific organic fertilizer market size in 2025, and is advancing at a 6.47% CAGR through 2031.
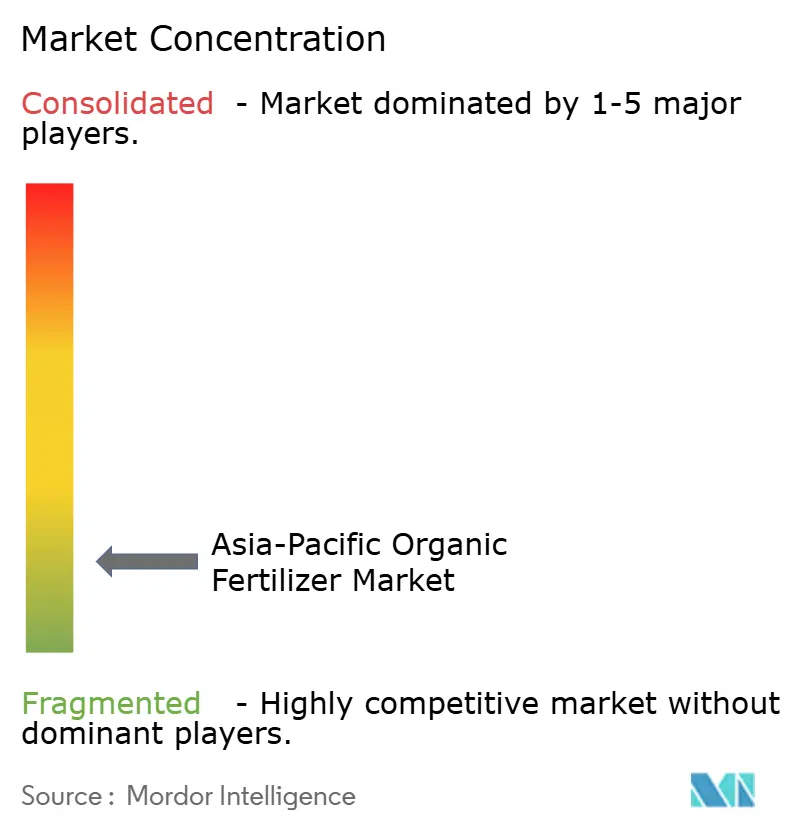
- The Asia-Pacific organic fertilizer market is highly fragmented, with the top five suppliers accounting for only a small share.
Note: Market size and forecast figures in this report are generated using Mordor Intelligence’s proprietary estimation framework, updated with the latest available data and insights as of 2026.
Asia-Pacific Organic Fertilizer Market Trends and Insights
Drivers Impact Analysis*
| Driver | (~) % Impact on CAGR Forecast | Geographic Relevance | Impact Timeline |
|---|---|---|---|
| Government subsidies and organic-farming incentives | +2.1% | China, India, Thailand | Medium term (2–4 years) |
| Rising consumer demand for chemical-free food | +1.8% | China, Japan, Australia | Long term (≥4 years) |
| Soil-health deterioration and declining yields | +1.5% | Asia-Pacific | Long term (≥4 years) |
| Emergence of e-commerce ag-input marketplaces | +0.9% | China, India, Indonesia | Short term (≤2 years) |
| Large-scale composting of agri-waste | +0.7% | Indonesia, Vietnam, Philippines | Medium term (2–4 years) |
| Microbial consortia-based high-efficiency products | +0.6% | India, China, Japan | Medium term (2–4 years) |
| Source: Mordor Intelligence | |||
Government Subsidies and Organic-Farming Incentives
China allocated USD 1.2 billion in 2024 to accelerate the transition toward organic practices, trimming on-farm adoption costs by 40% for millions of growers[2]Source: National Development and Reform Commission, “2024 Agricultural Transition Subsidy Program,” en.ndrc.gov.cn. India has expanded the Paramparagat Krishi Vikas Yojana, which provides support for certification, training, and market linkages [3]Source: Ministry of Agriculture and Farmers Welfare, “Paramparagat Krishi Vikas Yojana Extension,” agricoop.nic.in. Thailand’s cooperative-purchase model reduces input prices by 25%, allowing certified growers to pool their demand and negotiate bulk rates. Mandatory certification by national bodies ensures alignment with export protocols, thereby opening up additional revenue streams. Together, these policies are driving growth in the Asia-Pacific organic fertilizer market by integrating smallholders, who cultivate 78% of the region's agricultural acreage, into the organic farming ecosystem.
Rising Consumer Demand for Chemical-Free Food
Urban households in Beijing, Shanghai, Tokyo, and Sydney pay premiums of 35-50% for organic produce, signaling strong demand. Retailers and food processors impose ingredient traceability rules that require certified inputs, so growers turn to organic fertilizer to guard market access. Chinese e-commerce portals Tmall and JD.com reported 42% organic food growth in 2024, quadrupling the growth of synthetic fertilizer SKUs. In Japan, 68% of shoppers associate organic fertilizer use with higher nutritional value in produce, reinforcing brand storytelling around soil health. The net effect funnels price signals upstream, guiding input purchases toward certified amendments.
Soil-Health Deterioration and Declining Yields
Roughly 45% of the region’s arable land holds organic-matter levels below 2%, pushing governments to subsidize organic inputs for remediation. Heavy-metal contamination exceeds safe limits on 19.4% of Chinese cropland, prompting provincial authorities to issue rebates for compost applications. India’s Soil Health Card program recommends organic supplements to 140 million growers for micronutrient renewal. Environmental agencies across Southeast Asia are tightening soil-quality benchmarks, incorporating organic fertilizers into their compliance toolkits. This regulatory momentum stabilizes demand and reduces grower risk.
Emergence of E-Commerce Ag-Input Marketplaces
Digital storefronts reduce distribution costs by up to 40% compared to legacy dealer chains, thereby increasing access to the Asia-Pacific organic fertilizer market in remote areas. China’s Pinduoduo tripled organic input listings in 2024, aided by algorithmic preference for high-engagement categories. Agro-marketplaces incorporate agronomy tutorials and geotagged logistics tracking, enabling farmers to apply products correctly, which in turn increases repeat purchases. India’s AgroStar covers 15 states with 450 organic SKUs and leverages micro-warehouse hubs for two-day delivery. These platforms unlock price transparency and widen brand visibility.
Restraints Impact Analysis*
| Restraint | (~) % Impact on CAGR Forecast | Geographic Relevance | Impact Timeline |
|---|---|---|---|
| Higher cost and lower nutrient density vs. synthetics | −1.4% | Asia-Pacific | Long term (≥4 years) |
| Absence of uniform Asia-Pacific quality standards | −0.8% | Asia-Pacific | Medium term (2–4 years) |
| Logistic and shelf-life challenges in humid climates | −0.6% | Indonesia, Philippines, Vietnam | Short term (≤2 years) |
| Slow-release profile misaligned with intensive cycles | −0.4% | Vietnam, Thailand, China | Medium term (2–4 years) |
| Source: Mordor Intelligence | |||
Higher Costs and Lower Nutrient Density Vs. Synthetics
Organic amendments average 1.7 times the cost of urea per hectare, compelling growers to seek premium crop prices to break even. Nutrient density remains lower, so application rates must rise two- to threefold, inflating labor and transport overhead. While fruit and vegetable producers pass these costs to consumers, row-crop farmers face tighter margins. Profitability breakeven emerges only when produce premiums pass 25%, a threshold yet to materialize in many rural markets. Price gaps thus slow the expansion of the Asia-Pacific organic fertilizer market in commodity segments.
Absence of Uniform Asia-Pacific Quality Standards
Divergent residue limits and additive rules force manufacturers to craft country-specific blends, pushing unit costs up by 15-20%. Thailand allows certain microbial additives that Indonesia bans, complicating cross-border trade. Overlapping certification bodies add to farmer confusion and delay adoption. ASEAN Good Agricultural Practices aim to harmonize rules, but full rollout is unlikely before 2027. The resulting patchwork limits economies of scale and thins profit margins in the Asia-Pacific organic fertilizer market.
*Our forecasts treat driver/restraint impacts as directional, not additive. The impact forecasts reflect baseline growth, mix effects, and variable interactions.
Segment Analysis
By Form: Manure Products Maintain Leadership amid Waste-to-Value Policies
Manure captured 48.35% of the Asia-Pacific organic fertilizer market share in 2025 and is projected to record the fastest 6.72% CAGR through 2031 because livestock-waste volumes are rising and subsidy programs in China and India cut feedstock costs, making composted manure the most economical option for smallholders and commercial farms alike. Rapid microbial enrichment further boosts its nutrient profile, so growers see fewer yield penalties when shifting away from synthetics.
Meal-based fertilizers serve premium horticulture where precise nutrient delivery justifies higher prices, yet their expansion is capped by limited oil-seed crushing capacity. Oilcakes, now treated as a distinct category, are gaining traction in cash-crop systems that value their steady nutrient release and soil-conditioning traits. Newly installed village-scale expellers in Indonesia and India feed fresh press cakes directly into local fertilizer markets, reducing transport costs and preserving nutrient potency. Other organic fertilizers, such as seaweed extract and biochar blends, carve out niches in climate-smart agriculture by linking carbon-sequestration benefits with soil-health improvements, while cold-chain packaging trials are helping all product types maintain stability in humid coastal areas. Together these dynamics broaden grower choice, but manure retains clear dominance within the Asia-Pacific organic fertilizer market size because it pairs cost advantages with policy support and the strongest growth trajectory.


By Crop Type: Row Crops Dominate While Cash Crops Accelerate
Row crops, such as rice, wheat, and corn, accounted for 79.10% of the Asia-Pacific organic fertilizer market share in 2025, underscoring the vast land area dedicated to staple grains. Government soil-health schemes attach subsidy disbursements to compost use, nudging millions of rice growers toward adoption. Future traction hinges on refining slow-release profiles to match multiple seasonal harvests and reigning in cost-per-hectare metrics.
Cash crops, including cotton and sugarcane, post the fastest 6.66% CAGR through 2031. Export premiums and direct-to-consumer supply chains make organic status a differentiator. The horticulture segment enjoys strong consumer demand in East Asian supermarkets, which are willing to pay higher produce premiums. Although the land area is smaller, the spend per hectare is higher, supporting profitability for specialized suppliers within the Asia-Pacific organic fertilizer market.
Geography Analysis
China accounted for 79.05% of the Asia-Pacific organic fertilizer market size in 2025, and is expanding at a 6.47% CAGR, supported by USD 1.2 billion in annual subsidies and the implementation of soil-restoration directives across 19.4% of its cropland. Policy priorities are transitioning from volume growth to nutrient precision and contamination mitigation.
India leverages national funding and utilizes its extensive smallholder base to extend organic farming from horticulture to staple grains. Extension services and cooperative purchasing lower entry barriers for farmers, sustaining mid-single-digit growth and deepening regional supply diversity.
Emerging ASEAN markets reshape the Asia-Pacific organic fertilizer market landscape. Indonesia’s 25 composting hubs, funded by Japan International Cooperation Agency (JICA), turn 2.4 million metric tons of waste into affordable inputs that cut freight costs by 45%. Vietnam harnesses rice-husk biochar and donor aid to lift organic acreage, with export certifications targeting premium Japanese and European buyers. The Philippines allocates USD 150 million to community compost initiatives, while Australia and Japan utilize consumer premiums to justify higher application costs.
Competitive Landscape
With the top five suppliers holding just a minor share, the Asia-Pacific organic fertilizer market is extremely fragmented. Hundreds of local processors serve provincial pockets, often tied to municipal waste streams, while certification disparities stymie large-scale consolidation. Competition focuses on geographic coverage, microbial IP, and bundled agronomy services rather than head-to-head price discounting.
Leading incumbents, such as Gujarat Narmada Valley Fertilizers, secure upstream raw materials and invest in direct-to-farmer channels, thereby reducing their reliance on fragmented dealer grids. Coromandel International collaborates with the Indian Council of Agricultural Research (ICAR) to tailor bio-fertilizers for rice and wheat belts, enhancing agronomic fit and speeding regulatory clearance. Biotechnology start-ups aim to achieve nutrient-density breakthroughs through consortia of nitrogen-fixing, phosphorus-solubilizing, and potassium-mobilizing microbes.
Digital platforms form the newest competitive axis. Pinduoduo and AgroStar utilize consumer analytics and last-mile logistics to enhance visibility for brand partners, displacing traditional distributors. Cold-chain innovators partner with coastal distributors to curb spoilage, winning share in humid zones. Over the medium term, regulatory harmonization across the Association of Southeast Asian Nations (ASEAN) and South Asian Association for Regional Cooperation (SAARC) may unlock waves of cross-border mergers and acquisitions as scale advantages emerge.
Asia-Pacific Organic Fertilizer Industry Leaders
Coromandel International Ltd
Genliduo Bio-tech Corporation Ltd
Gujarat Narmada Valley Fertilizers & Chemicals Ltd
Gujarat State Fertilizers & Chemicals Ltd
Swaroop Agrochemical Industries
- *Disclaimer: Major Players sorted in no particular order

Recent Industry Developments
- September 2025: Tata Chemicals and TERI inaugurated a Centre of Excellence on Biochemicals in New Delhi, outfitted with multi-scale bioreactors and pilot recovery systems to commercialize fermentation-based molecules such as 2,3-Butanediol, laying the groundwork for renewable feedstocks that can flow into bio-based fertilizer formulations and strengthen India’s circular bioeconomy.
- July 2025: Kan Biosys introduced its ROFA precision water-soluble line and three in-house neem-based bio-fertilizers for residue-free farming in India, created jointly with France’s De Sangosse and aimed at boosting nutrient-use efficiency while lowering chemical load.
- December 2024: Yara Vietnam delivered more than 1 000 t of YaraSuna organic fertilizers made from recovered waste and began a joint project with the Plant Protection Department and the Soils and Fertilizers Research Institute (2024-2026) to embed these products in sustainable nutrient-management programs for durian farms in Dak Nong province.


Asia-Pacific Organic Fertilizer Market Report Scope
Manure, Meal Based Fertilizers, Oilcakes are covered as segments by Form. Cash Crops, Horticultural Crops, Row Crops are covered as segments by Crop Type. Australia, China, India, Indonesia, Japan, Philippines, Thailand, Vietnam are covered as segments by Country.
| Manure |
| Meal Based Fertilizers |
| Oilcakes |
| Other Organic Fertilizers |
| Cash Crops |
| Horticultural Crops |
| Row Crops |
| Australia |
| China |
| India |
| Indonesia |
| Japan |
| Philippines |
| Thailand |
| Vietnam |
| Rest of Asia-Pacific |
| Form | Manure |
| Meal Based Fertilizers | |
| Oilcakes | |
| Other Organic Fertilizers | |
| Crop Type | Cash Crops |
| Horticultural Crops | |
| Row Crops | |
| Geography | Australia |
| China | |
| India | |
| Indonesia | |
| Japan | |
| Philippines | |
| Thailand | |
| Vietnam | |
| Rest of Asia-Pacific |


Market Definition
- AVERAGE DOSAGE RATE - The average application rate is the average volume of organic fertilizers applied per hectare of farmland in the respective region/country.
- CROP TYPE - Crop type includes Row crops (Cereals, Pulses, Oilseeds), Horticultural Crops (Fruits and vegetables) and Cash Crops (Plantation Crops, Fibre Crops and Other Industrial Crops)
- FUNCTION - The crop nutrition function of agricultural biological consists of various products that provide essential plant nutrients and enhance soil quality.
- TYPE - Organic fertilizers are applied to provide essential crop nutrients and enhance the soil quality.
| Keyword | Definition |
|---|---|
| Cash Crops | Cash crops are non-consumable crops sold as a whole or part of the crop to manufacture end-products to make a profit. |
| Integrated Pest Management (IPM) | IPM is an environment-friendly and sustainable approach to control pests in various crops. It involves a combination of methods, including biological controls, cultural practices, and selective use of pesticides. |
| Bacterial biocontrol agents | Bacteria used to control pests and diseases in crops. They work by producing toxins harmful to the target pests or competing with them for nutrients and space in the growing environment. Some examples of commonly used bacterial biocontrol agents include Bacillus thuringiensis (Bt), Pseudomonas fluorescens, and Streptomyces spp. |
| Plant Protection Product (PPP) | A plant protection product is a formulation applied to crops to protect from pests, such as weeds, diseases, or insects. They contain one or more active substances with other co-formulants such as solvents, carriers, inert material, wetting agents or adjuvants formulated to give optimum product efficacy. |
| Pathogen | A pathogen is an organism causing disease to its host, with the severity of the disease symptoms. |
| Parasitoids | Parasitoids are insects that lay their eggs on or within the host insect, with their larvae feeding on the host insect. In agriculture, parasitoids can be used as a form of biological pest control, as they help to control pest damage to crops and decrease the need for chemical pesticides. |
| Entomopathogenic Nematodes (EPN) | Entomopathogenic nematodes are parasitic roundworms that infect and kill pests by releasing bacteria from their gut. Entomopathogenic nematodes are a form of biocontrol agents used in agriculture. |
| Vesicular-arbuscular mycorrhiza (VAM) | VAM fungi are mycorrhizal species of fungus. They live in the roots of different higher-order plants. They develop a symbiotic relationship with the plants in the roots of these plants. |
| Fungal biocontrol agents | Fungal biocontrol agents are the beneficial fungi that control plant pests and diseases. They are an alternative to chemical pesticides. They infect and kill the pests or compete with pathogenic fungi for nutrients and space. |
| Biofertilizers | Biofertilizers contain beneficial microorganisms that enhance soil fertility and promote plant growth. |
| Biopesticides | Biopesticides are natural/bio-based compounds used to manage agricultural pests using specific biological effects. |
| Predators | Predators in agriculture are the organisms that feed on pests and help control pest damage to the crops. Some common predator species used in agriculture include ladybugs, lacewings, and predatory mites. |
| Biocontrol agents | Biocontrol agents are living organisms used to control pests and diseases in agriculture. They are alternatives to chemical pesticides and are known for their lesser impact on the environment and human health. |
| Organic Fertilizers | Organic fertilizer is composed of animal or vegetable matter used alone or in combination with one or more non-synthetically derived elements or compounds used for soil fertility and plant growth. |
| Protein hydrolysates (PHs) | Protein hydrolysate-based biostimulants contain free amino acids, oligopeptides, and polypeptides produced by enzymatic or chemical hydrolysis of proteins, primarily from vegetal or animal sources. |
| Biostimulants/Plant Growth Regulators (PGR) | Biostimulants/Plant Growth Regulators (PGR) are substances derived from natural resources to enhance plant growth and health by stimulating plant processes (metabolism). |
| Soil Amendments | Soil Amendments are substances applied to soil that improve soil health, such as soil fertility and soil structure. |
| Seaweed Extract | Seaweed extracts are rich in micro and macronutrients, proteins, polysaccharides, polyphenols, phytohormones, and osmolytes. These substances boost seed germination and crop establishment, total plant growth and productivity. |
| Compounds related to biocontrol and/or promoting growth (CRBPG) | Compounds related to biocontrol or promoting growth (CRBPG) are the ability of a bacteria to produce compounds for phytopathogen biocontrol and plant growth promotion. |
| Symbiotic Nitrogen-Fixing Bacteria | Symbiotic nitrogen-fixing bacteria such as Rhizobium obtain food and shelter from the host, and in return, they help by providing fixed nitrogen to the plants. |
| Nitrogen Fixation | Nitrogen fixation is a chemical process in soil which converts molecular nitrogen into ammonia or related nitrogenous compounds. |
| ARS (Agricultural Research Service) | ARS is the U.S. Department of Agriculture's chief scientific in-house research agency. It aims to find solutions to agricultural problems faced by the farmers in the country. |
| Phytosanitary Regulations | Phytosanitary regulations imposed by the respective government bodies check or prohibit the importation and marketing of certain insects, plant species, or products of these plants to prevent the introduction or spread of new plant pests or pathogens. |
| Ectomycorrhizae (ECM) | Ectomycorrhiza (ECM) is a symbiotic interaction of fungi with the feeder roots of higher plants in which both the plant and the fungi benefit through the association for survival. |


Research Methodology
Mordor Intelligence follows a four-step methodology in all our reports.
- Step-1: Identify Key Variables: In order to build a robust forecasting methodology, the variables and factors identified in Step-1 are tested against available historical market numbers. Through an iterative process, the variables required for market forecast are set and the model is built on the basis of these variables.
- Step-2: Build a Market Model: Market-size estimations for the forecast years are in nominal terms. Inflation is not a part of the pricing, and the average selling price (ASP) is kept constant throughout the forecast period.
- Step-3: Validate and Finalize: In this important step, all market numbers, variables and analyst calls are validated through an extensive network of primary research experts from the market studied. The respondents are selected across levels and functions to generate a holistic picture of the market studied.
- Step-4: Research Outputs: Syndicated Reports, Custom Consulting Assignments, Databases & Subscription Platforms.


