
Immunohistochemistry Market Size and Share
Market Overview
| Study Period | 2020 - 2031 |
|---|---|
| Market Size (2026) | USD 3.18 Billion |
| Market Size (2031) | USD 4.42 Billion |
| Growth Rate (2026 - 2031) | 6.78 % |
| Fastest Growing Market | Asia Pacific |
| Largest Market | North America |
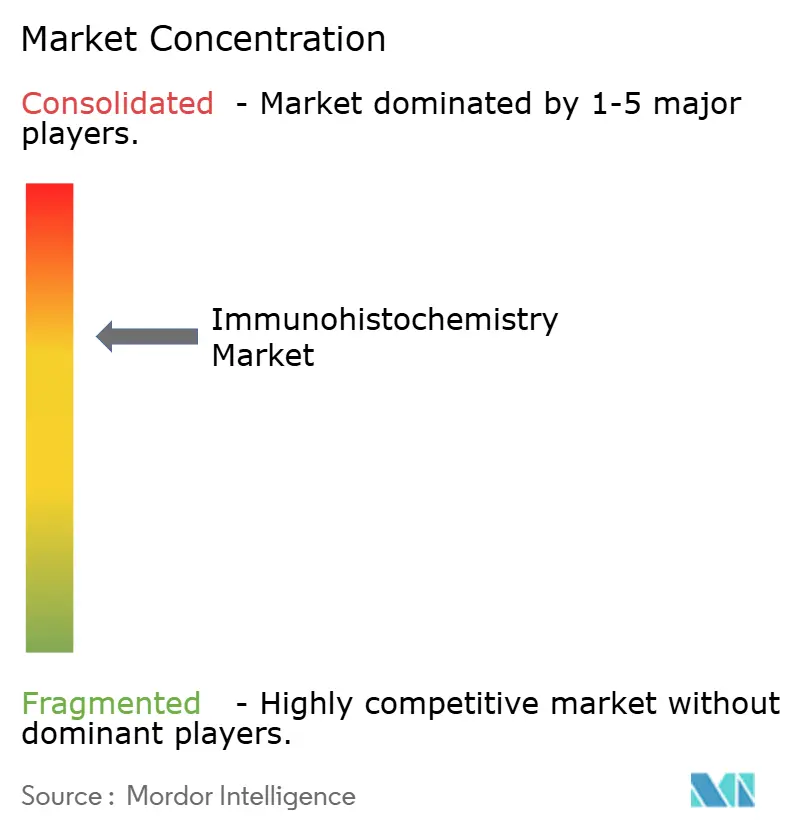
| Market Concentration | Medium |
Major Players
*Disclaimer: Major Players sorted in no particular order Image © Mordor Intelligence. Reuse requires attribution under CC BY 4.0. |
|
Immunohistochemistry Market Analysis by Mordor Intelligence
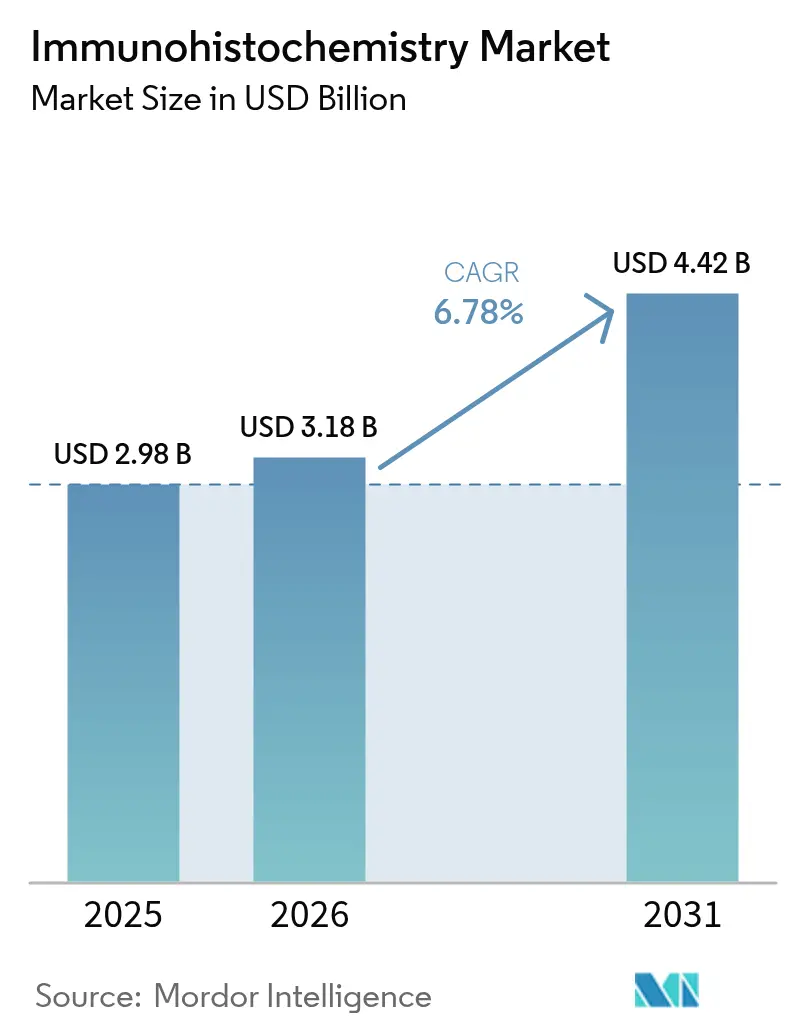
The immunohistochemistry market size was valued at USD 2.98 billion in 2025 and estimated to grow from USD 3.18 billion in 2026 to reach USD 4.42 billion by 2031, at a CAGR of 6.78% during the forecast period (2026-2031). Growth is supported by rising cancer prevalence, broader use of companion diagnostics, and rapid adoption of AI-enabled multiplex staining workflows that shorten turnaround times while improving diagnostic precision [1]Anders Blilie, "Artificial Intelligence-Assisted Prostate Cancer Diagnosis for Reduced Use of Immunohistochemistry," arxiv, arxiv.org. Increasing digital pathology integration, deeper penetration of automated slide stainers in middle-income laboratories, and mounting investments in drug discovery outsourcing add further momentum. At the same time, the FDA’s re-classification of immunohistochemistry assays as medical devices raises compliance costs yet favors large manufacturers that already operate globally certified quality systems. Geographic demand gradually shifts to Asia-Pacific, where expanding oncology infrastructure and manufacturing capacity complement unmet diagnostic needs. Consolidation among suppliers—illustrated by the 2024 Danaher–Abcam deal—signals a competitive emphasis on end-to-end reagent, instrument, and software portfolios.
Key Report Takeaways
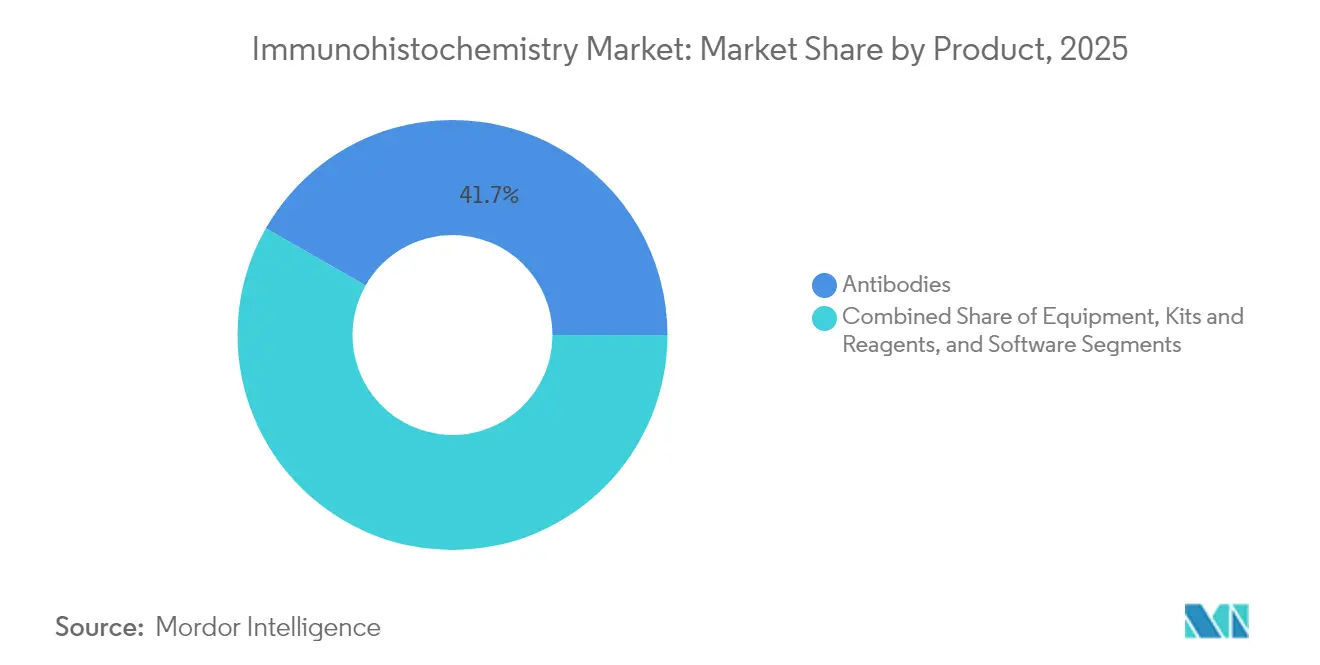
- By product category, antibodies led with 41.74% of immunohistochemistry market share in 2025; software solutions are projected to expand at an 7.58% CAGR to 2031.
- By application, diagnostics accounted for a 60.92% share of the immunohistochemistry market size in 2025, while drug discovery and testing is advancing at an 7.72% CAGR through 2031.
- By detection method, indirect immunohistochemistry held 70.66% of immunohistochemistry market share in 2025 and is forecast to grow at an 7.63% CAGR.
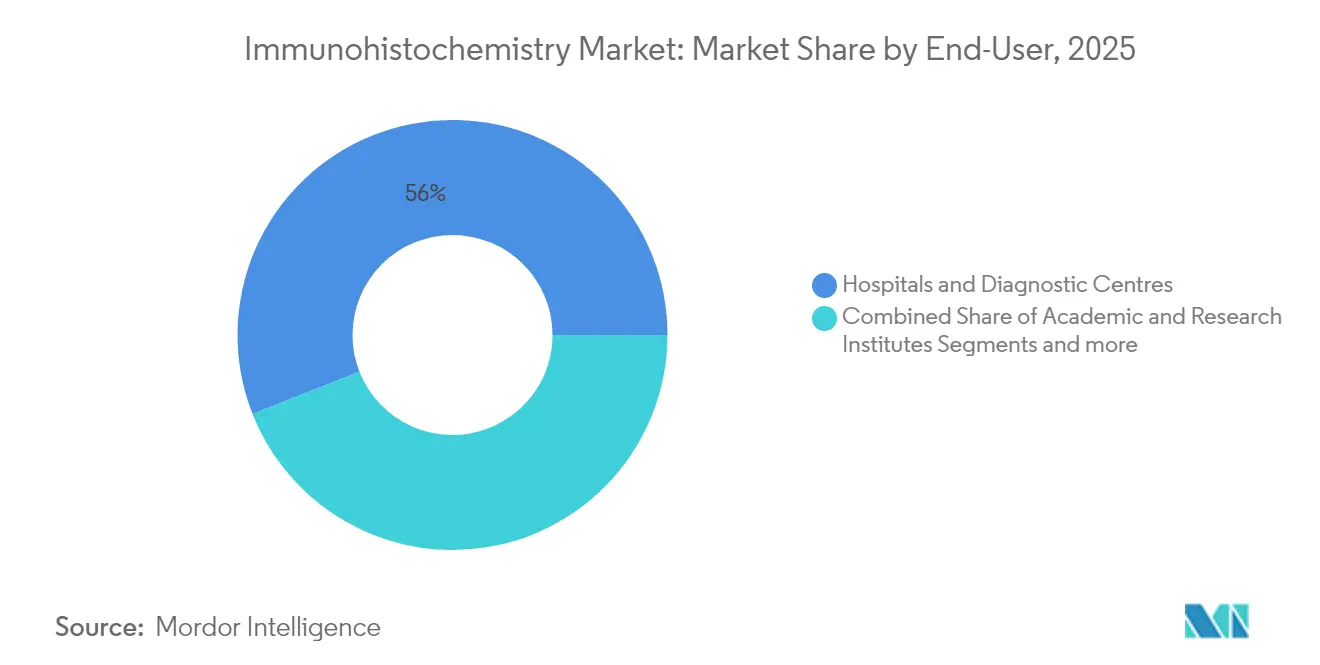
- By end-user, hospitals and diagnostic centers commanded 55.98% of immunohistochemistry market size in 2025; academic institutes post the highest projected CAGR at 7.76% to 2031.
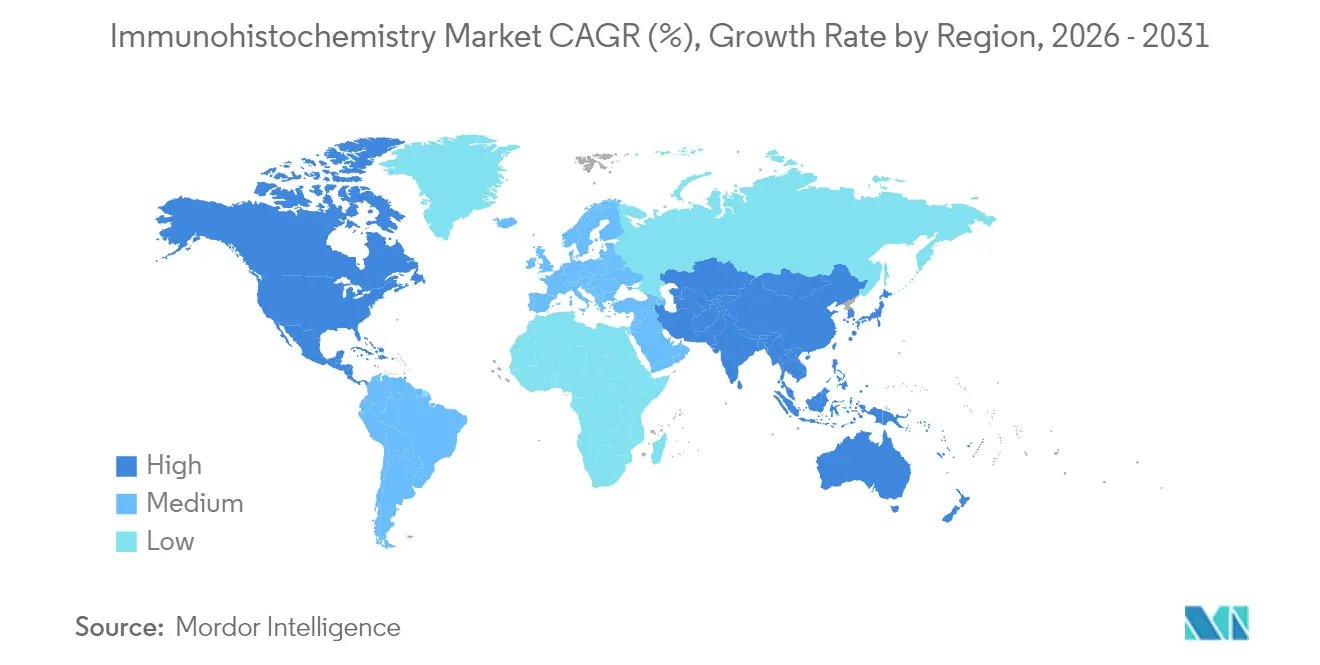
- By geography, North America controlled 40.92% revenue share in 2025, whereas Asia-Pacific is expected to clock an 7.84% CAGR between 2026-2031.
Note: Market size and forecast figures in this report are generated using Mordor Intelligence’s proprietary estimation framework, updated with the latest available data and insights as of 2026.
Market Trends and Insights
Drivers Impact Analysis of Immunohistochemistry Market*
| Driver | (~) % Impact on CAGR Forecast | Geographic Relevance | Impact Timeline |
|---|---|---|---|
| Rising prevalence of cancer | +1.8% | Global, highest in North America & Europe | Long term (≥ 4 years) |
| Ageing population & chronic disease burden | +1.5% | Global, concentrated in developed markets | Long term (≥ 4 years) |
| Advancements in multiplex & AI-assisted IHC workflows | +2.1% | North America & EU leading, APAC adoption accelerating | Medium term (2-4 years) |
| Expansion of companion-diagnostic approvals | +1.2% | Global, FDA/EMA decisions driving worldwide adoption | Short term (≤ 2 years) |
| Growth of tissue-based biomarker discovery outsourcing | +0.8% | North America & EU core, expansion to APAC | Medium term (2-4 years) |
| Affordable automated slide stainers in emerging labs | +0.6% | APAC, Latin America, Middle East & Africa | Long term (≥ 4 years) |
| Source: Mordor Intelligence | |||
Rising Prevalence of Cancer
Surging cancer incidence sustains high demand for immunohistochemistry market tests that clarify tumor biology with single-cell resolution [2]Alina Bollhagen, "Highly Multiplexed Tissue Imaging in Precision Oncology and Translational Cancer Research," American Association for Cancer Research, pmc.ncbi.nlm.nih.gov. Multiplex staining reveals immune-tumor interactions, guiding checkpoint inhibitor therapy selection. Companion diagnostics broaden treatment eligibility: the FDA cleared HER2-ultralow testing, and zanidatamab’s biliary tract indication relies on robust HER2 staining. Rare cancer use cases, such as pemphigus diagnosis via direct immunofluorescence replacement, further expand the immunohistochemistry market [3]Rana, Deepika, "Direct immunofluorescence (DIF) versus immunohistochemical (IHC) staining of complements and immunoglobulins (Ig) in pemphigus group," The Indian Journal of Pathology and Microbiology, journals.lww.com.
Ageing Population & Chronic Disease Burden
Longer life expectancy multiplies chronic comorbidities, driving case volumes that stretch existing histopathology capacity. Fewer than 14 pathologists per million population globally and escalating workloads (over 4,000 cases annually in many regions) increase reliance on automation. Hospital laboratories request 20% more immunohistochemistry tests than a decade earlier, while only one-third of clinical sites have implemented digital pathology due to capital constraints. This gap accelerates adoption of AI-enabled slide scanners that standardize staining intensity and scoring, improving throughput without lowering quality.
Advancements in Multiplex & AI-Assisted Workflows
AI collaboration frameworks apply universal algorithms to diverse stains, outperforming cohort-specific models (Kappa 0.578 vs 0.509). Virtual multiplexing recreates stains from a single H&E image, preserving tissue for downstream genomic profiling. Commercial platforms such as Roche’s navify Digital Pathology link automated stainers, slide scanners, and cloud-based AI to deliver end-to-end reporting, reducing manual turnaround by 40%. These innovations position software as the fastest-growing component within the immunohistochemistry market.
Expansion of Companion-Diagnostic Approvals
Regulators increasingly approve pancancer and target-specific assays that pair directly with therapy labels. Illumina’s TruSight Oncology Comprehensive became the first in vitro diagnostic kit with pancancer claims, evaluating 500 genes to inform immuno-oncology decisions. Roche’s TROP2 RxDx device, cleared under FDA breakthrough designation, autonomously scores membrane intensity—enhancing consistency versus manual reads. European CE-IVDR adoption of CLDN18.2 testing opens access for 38% of gastric cancer patients, demonstrating the integrative pull of regulatory alignment.
Restraints Impact Analysis of Immunohistochemistry Market*
| Restraint | (~) % Impact on CAGR Forecast | Geographic Relevance | Impact Timeline |
|---|---|---|---|
| High cost of premium antibodies & detection kits | -1.4% | Global, most severe in emerging markets | Medium term (2-4 years) |
| Scarcity of skilled histopathologists | -0.9% | Sub-Saharan Africa, South Asia, Latin America | Long term (≥ 4 years) |
| Reimbursement gaps for advanced IHC panels | -0.7% | Global, particularly severe in developing countries | Medium term (2-4 years) |
| Supply-chain fragility for critical reagents | -0.5% | Global, with highest impact during disruptions | Short term (≤ 2 years) |
| Source: Mordor Intelligence | |||
High Cost of Premium Antibodies & Detection Kits
Two-thirds of commercially available antibodies fail basic specificity tests, forcing labs to run costly in-house validations that inflate per-test expenditure. The YCharOS review of 1,000 antibodies pegged unreproducibility losses at up to USD 1.8 billion annually in the United States alone. Median list prices for monoclonal therapeutics remain between USD 15,624 and USD 143,833, reflecting manufacturing scale limitations despite process improvements. Medicare’s Local Coverage Determinations (in force since July 2024) now require rigorous medical-necessity documentation for immunohistochemistry stains, crimping reimbursement for extended panels.
Scarcity of Skilled Histopathologists in Low-Income Regions
Sub-Saharan Africa averages fewer than three pathologists per million inhabitants, restricting immunohistochemistry usage to tertiary centers that can afford imported reagents. Pakistan operates with one histopathologist per 450,000 residents across 18 major labs, creating diagnostic delays exceeding three weeks for complex cases. Bulgaria reimburses only a narrow set of breast markers, leaving patients to pay 80–120 BGN per antibody, which suppresses test volumes. Collaborative training initiatives and low-cost automated stainers offer partial relief, yet human resource shortages remain a long-term brake on immunohistochemistry market adoption.
*Our forecasts treat driver/restraint impacts as directional, not additive. The impact forecasts reflect baseline growth, mix effects, and variable interactions.
Immunohistochemistry Market Segment Analysis
By Product:
Software Solutions Drive Digital TransformationThe antibodies subsegment still anchors 41.74% of immunohistochemistry market share in 2025, confirming its foundational role in every assay run. Software, however, is advancing at an 7.58% CAGR as laboratories migrate to cloud-hosted image analytics that enable multi-institutional algorithm deployment. Roche’s VENTANA DP 200 slide scanner integrated with navify Digital Pathology illustrates a seamless pathway from staining through AI scoring. The antibodies category itself evolves: primary monoclonal clones gain validation transparency, while multiplex-ready secondary antibodies amplify low-abundance targets. Equipment upgrades parallel these shifts; automated stainers reduce manual errors and free skilled labor for interpretation tasks. As open-source tools such as QuPath and HistoQC improve image standardization, laboratories in mid-income countries adopt digital platforms more swiftly, reinforcing software’s strategic importance across the immunohistochemistry market.
In kits and reagents, companion diagnostic approvals influence purchasing decisions because oncologists require strict lot-to-lot reproducibility. Slide scanners and tissue microarrayers converge to support high-throughput translational research. Manufacturers respond with quality-assured reagent bundles to ease compliance under the FDA’s device re-classification rule. This interplay secures software’s elevation from ancillary tool to core revenue contributor, setting the stage for double-digit growth through 2031 in the immunohistochemistry market.



By Application:
Drug Discovery Accelerates Outsourcing TrendsDiagnostics retained 60.92% of immunohistochemistry market size in 2025, mirroring routine oncology workflows across hospitals. Yet drug discovery and testing climbs fastest at an 7.72% CAGR as pharmaceutical sponsors externalize tissue analysis to contract research organizations. ICON plc exemplifies this pivot, offering custom immunohistochemistry assay development on Ventana Benchmark ULTRA platforms within CAP-licensed labs. Outsourcing benefits from immunohistochemistry market economies of scale: centralized sites process thousands of slides daily and deploy AI to flag outliers, reducing cycle time for biomarker qualification.
Beyond oncology, tissue-based assays inform infectious disease and autoimmune research. Spatial omics couples immunohistochemistry with high-plex RNA mapping, affording multi-omic context that accelerates target discovery. Laboratory automation and algorithm-driven scoring boost reproducibility, assuring sponsors of data integrity. As regulatory agencies emphasize tissue evidence in drug approval packages, contract labs expand capacity, reinforcing the segment’s momentum throughout the forecast period.
By End-User:
Academic Institutes Lead Innovation AdoptionHospitals and diagnostic centers held 55.98% of immunohistochemistry market share in 2025, anchoring routine cancer work-ups and benefiting from integrated reagent–instrument bundles that simplify compliance with the FDA’s device rule. Academic and research institutes, though smaller in absolute revenue, are expanding at an 7.76% CAGR as grant-funded programs pilot multiplex staining, spatial omics, and AI-assisted scoring that later diffuse to clinical practice. Contract research organizations widen access to high-throughput tissue analysis by offering validated protocols on automated platforms, a model that attracts pharmaceutical sponsors keen to reduce cycle times in biomarker discovery.
Persistent workforce shortages shape adoption patterns: the United Kingdom reports vacancy rates exceeding 30% in some pathology departments, while Pakistan fields just one histopathologist per 450,000 people, pushing community hospitals to outsource complex panels and accelerating digital slide sharing. Academic hubs counter this constraint by embedding AI algorithms into resident training, cutting manual review time by up to 40% without compromising accuracy. The immunohistochemistry market size attributed to academic institutes rises further as multicenter consortia negotiate volume discounts on antibodies and slide scanners, lowering per-test costs and stimulating research throughput. Small specialty labs that focus on rare diseases or cell-therapy eligibility tests gain traction by leveraging cloud-based image servers that facilitate remote expert consultation, a capability hospitals increasingly adopt for second reads. Overall, end-user dynamics favor institutions that combine automation, digital pathology, and collaborative networks, reinforcing academic leadership in technology diffusion across the wider immunohistochemistry market.
By Detection Method:
Indirect Methods Dominate Technical ApplicationsIndirect detection methods accounted for 70.66% of immunohistochemistry market share in 2025 and are forecast to grow at an 7.63% CAGR through 2031, underpinned by their superior sensitivity, signal amplification, and compatibility with multiplex panels that interrogate low-abundance targets. The direct method remains useful for high-expressor antigens and rapid intraoperative decisions, yet its limited chromogenic intensity and higher background restrict broader uptake, keeping its revenue contribution below 20% of immunohistochemistry market size.
Technical advances reinforce indirect dominance: polymer-based secondary systems reduce endogenous biotin interference, and novel fluorophore conjugates enable seven-plus simultaneous markers under a single excitation filter, accelerating spatial-omics workflows. Generative AI now resolves membrane co-localization artifacts in brightfield multiplex images, allowing indirect stains to achieve clearer delineation in crowded tissue compartments. Laboratories adopting automated slide stainers integrate pre-optimized indirect protocols that shorten run times by 25% while standardizing reagent volumes, an efficiency critical for high-volume oncology centers. Regulatory guidance from the College of American Pathologists stipulates full validation for laboratory-developed indirect assays, pushing vendors to ship turnkey kits that bundle antibodies, polymers, and chromogens in single lots for easier documentation. Emerging fluorescent probe technologies further expand indirect capabilities by tracking immune-cell function in situ, a feature increasingly requested in cell-therapy trials. Collectively, these innovations secure the indirect approach as the backbone of high-complexity testing across the immunohistochemistry market.
Geography Analysis
North America Immunohistochemistry Market
North America commands 40.92% of 2025 revenue, buoyed by established reimbursement, early AI deployment, and frequent companion diagnostic approvals. However, laboratories must absorb compliance spending of USD 566 million–3.56 billion under the FDA’s 2024 laboratory-developed test rule, prompting strategic partnerships with larger IVD manufacturers. Digital pathology adoption, currently 33% of clinical sites, is expected to accelerate as capital budgets migrate toward image management platforms that unlock remote sub-specialist reads.
APAC Immunohistochemistry Market
Asia-Pacific exhibits the highest growth at 7.84% CAGR, driven by rising oncology incidence, expanding biomanufacturing capacity, and public hospital upgrades. China and India channel stimulus funds into cancer centers outfitted with automated slide stainers, though workforce shortages remain acute. Pathologist density in Pakistan stands at one per 450,000 people, restraining the speed of advanced immunohistochemistry market adoption. Investment in AI-enabled scoring tools offers partial mitigation, allowing less-experienced staff to triage simple cases.
Europe Immunohistochemistry Market
Europe grows steadily on the back of CE-IVDR alignment and expanding precision medicine rollouts. Germany and France lead in digital platform deployments, while Southern and Eastern states lag due to reimbursement gaps: Bulgaria restricts coverage to limited breast malignancy markers, shifting costs to patients. Regional quality programs such as NordiQC boosted biomarker pass rates from 71% in 2017 to 79% in 2021, underscoring a continental push toward assay standardization.

Regulatory Landscape
In the United States, immunohistochemistry (IHC) reagents and kits are regulated as in vitro diagnostic medical devices under 21 CFR 864.1860, with classification and controls varying by intended use (general controls for lower-risk uses and special controls or PMA requirements for higher-risk claims such as certain companion diagnostics). Oversight is also tightening around laboratory-developed tests (LDTs), with the FDA beginning a staged phaseout of enforcement discretion starting May 6, 2025, which increases validation and documentation requirements for laboratories running complex IHC menus.
Quality-system obligations are becoming more harmonized globally. The FDA Quality Management System Regulation (QMSR), aligned to ISO 13485:2016, moved into enforcement on February 2, 2026, raising the bar for design controls, risk management, and supplier oversight across IHC instruments, reagents, and associated software. In Europe, the In Vitro Diagnostic Regulation (IVDR) continues to drive lifecycle compliance, including post-market surveillance, while notified-body review constrains capacity. As of July 2026, transitional timelines for legacy devices remain in force, with Class D ending December 31, 2027, Class C ending December 31, 2028, and Class B ending December 31, 2029.
Competitive Landscape
The immunohistochemistry market is consolidating as integrated players marry reagents with hardware and algorithms. Danaher’s USD 5.5 billion acquisition of Abcam adds 189,000 antibody and protein tools to a portfolio already spanning Leica Biosystems instruments. Roche capitalizes on AI credentials; its TROP2 immunohistochemistry assay autonomously detects tumor cells, reducing inter-reader variability and earning FDA breakthrough status. Thermo Fisher, Leica-Indica, and emerging startups compete through digital ecosystems that bundle scanners, cloud storage, and analytics subscriptions.
Quality control challenges shape competitive positioning. Two-thirds of commercial antibodies miss specification marks, elevating brands with verified performance documentation. Large vendors leverage global service laboratories—Danaher opened two CLIA-certified sites in 2024—to demonstrate assay reproducibility and support pharmaceutical co-development.
Startups target virtual multiplexing and universal AI analyzers, lowering tissue consumption and broadening adoption in low-resource settings. While barriers to entry rise under device-class regulation, algorithm innovation remains open, allowing agile firms to carve out niche advantages.
Immunohistochemistry Industry Leaders
-
F. Hoffmann-LA Roche AG
-
Thermo Fisher Scientific Inc.
-
Merck KGaA
-
Abcam PLC
-
Agilent Technologies, Inc.
- *Disclaimer: Major Players sorted in no particular order
Immunohistochemistry Market Companies Covered in this Report
- Roche
- Agilent Technologies
- Thermo Fisher Scientific
- Danaher Corp. (Leica Biosystems)
- Merck
- Abcam
- Bio-Rad Laboratories
- PerkinElmer
- Cell Signaling Technology
- Bio SB
- Sakura Finetek Japan Co.
- Biocare Medical
- Enzo Biochem
- Lunaphore Technologies SA
- Vector Laboratories
- 3DHistech
- Fluidigm (Standard BioTools)
- Qritive Pte Ltd.
- Miltenyi Biotec
- Genemed Biotechnologies

Market Opportunities and Future Outlook
Companion diagnostics and standardized digital workflows are broadening the addressable opportunity for integrated IHC portfolios that combine assay content, automated staining, slide scanning, and algorithmic scoring. In 2026, Agilent secured FDA approvals that expand clinical use cases for PD-L1 testing, including July 2026 approval of PD-L1 IHC 28-8 pharmDx as a companion diagnostic across esophageal squamous cell carcinoma and multiple upper GI indications, and June 2026 approval expanding PD-L1 IHC 22C3 pharmDx use on the Dako Omnis platform. These approvals support menu consolidation on installed instruments and strengthen demand for vendor-validated reagents designed to reduce lab-level variability.
AI-enabled computational pathology and pharma-aligned assay co-development are also creating whitespace for software subscriptions and biomarker-specific kits that can be deployed consistently across multi-site networks. In May 2026, Leica Biosystems, Indica Labs, and Lunit announced a partnership around AI-powered PD-L1 and emerging biomarker algorithms, including availability via the Aperio AI Store, and Leica expanded a collaboration with AstraZeneca and Daiichi Sankyo to develop an IHC assay and image analysis algorithm for the TROP2 Normalized Membrane Ratio (NMR) biomarker. At the laboratory level, tighter analytic validation expectations, including College of American Pathologists 2024 guidance that emphasizes high concordance against comparator methods for clinical validation, increase the value of ready-to-use antibody clones, multiplex-ready detection chemistry, and locked workflows that simplify compliance across geographies.
Recent Industry Developments in Immunohistochemistry Market
- July 2026: Agilent Technologies received FDA approval for PD-L1 IHC 28-8 pharmDx as a companion diagnostic in esophageal squamous cell carcinoma and select gastric, gastroesophageal junction, and esophageal adenocarcinoma indications. The expanded label reinforces the role of IHC in therapy selection and supports higher utilization of the Dako platform where laboratories prefer vendor-validated, regulated assays over heterogeneous laboratory-developed alternatives.
- August 2025: Agilent Technologies received FDA approval for its MMR IHC Panel pharmDx on the Dako Omnis platform as a companion diagnostic for identifying mismatch repair deficient colorectal cancer patients. The approval expands the regulated IHC menu for precision oncology workflows and supports test consolidation on automated stainers with standardized reagents and interpretation criteria.
- November 2024: Roche received a CE Mark for the VENTANA FOLR1 (FOLR1-2.1) RxDx Assay as an IHC-based companion diagnostic to identify FRa-positive ovarian cancer patients eligible for ELAHERE. The milestone expanded the European companion diagnostic test landscape and reinforces demand for assay-instrument ecosystems that can deliver reproducible results across distributed pathology networks.


Immunohistochemistry Market Report Scope and Research Methodology
Market Definition and Coverage
This market covers the total value of immunohistochemistry products and related workflow tools used to detect specific antigens in tissue samples for diagnostic and research use, including typical consumables and instruments used around staining and detection.
Scope exclusions: Services-only revenue (standalone lab testing services), pure histology stains outside IHC, and general-purpose microscopy hardware not purchased for IHC workflows are not counted.
Segments Covered in This Report
-
By Product
-
Antibodies
- Primary Antibodies
- Secondary Antibodies
-
Equipment
- Automated Slide Stainers
- Tissue Microarrayers
- Slide Scanners
- Others
- Kits and Reagents
- Software
-
Antibodies
-
By Application
-
Diagnostics
- Cancer
- Infectious Diseases
- Auto-immune Diseases
- Others
- Drug Discovery and Testing
-
Diagnostics
-
By End-User
- Hospitals and Diagnostic Centres
- Academic and Research Institutes
- Contract Research Organizations
- Others
-
By Detection Method
- Direct
- Indirect
-
By Geography
-
North America
- United States
- Canada
- Mexico
-
Europe
- Germany
- United Kingdom
- France
- Italy
- Spain
- Rest of Europe
-
Asia-Pacific
- China
- Japan
- India
- Australia
- South Korea
- Rest of Asia-Pacific
-
Middle East and Africa
- GCC
- South Africa
- Rest of Middle East and Africa
-
South America
- Brazil
- Argentina
- Rest of South America
-
North America
Data Sources, Market Sizing, and Validation
Desk Research
Desk research started by mapping how IHC demand is formed in real labs, then linking that demand to measurable public indicators. We used public health and epidemiology sources such as the World Health Organization, the International Agency for Research on Cancer, and national cancer registries for cancer incidence trends that influence staining volumes.
To ground the supply side, we reviewed regulatory and labeling signals and the pace of assay updates using sources such as the US FDA databases for cleared diagnostics and product recalls, along with scientific literature from PubMed to understand common markers and protocol shifts. Trade flows and manufacturing signals were cross-checked using government trade statistics (including UN Comtrade and national customs summaries) when relevant for consumables. We also referenced company filings, investor decks, reputable press coverage, and a paid subscription for company financials and patent intelligence to validate product mix and innovation activity. The sources listed here are illustrative, and other public references were also used for data collection, validation, and clarification.
Primary Interviews and Surveys
Primary work focused on confirming what drives IHC volumes and spending in routine pathology and in research labs, and then stress-testing pricing and product-mix assumptions. Interviews covered instrument suppliers, reagent distributors, pathology lab operators, and hospital procurement teams, with inputs balanced across APAC, EMEA, and the Americas so regional practice patterns could be represented in the final model.
Distribution of primary research fieldwork respondents
| Company type | Respondent position | Region |
|---|---|---|
| Top tier: 30% | CXOs: 12% | APAC: 39% |
| Mid tier: 56% | Functional/Unit leaders: 32% | EMEA: 37% |
| Smaller Players: 14% | Managers: 56% | Americas: 24% |
Market-Sizing & Forecasting
Sizing was built using top-down and bottom-up logic, where the main totals were reconstructed from the demand pool and then checked with selective supplier and channel math. At the country level, diagnostic testing intensity and addressable case volumes were used to build a realistic staining workload, and that workload was translated into spend using typical reagent usage and instrument replacement cycles.
Key inputs that shaped the model included cancer incidence and biopsy volumes, the penetration of companion diagnostics and targeted therapy testing, the mix shift toward automated staining platforms, average reagent consumption per slide, and average selling price ranges for antibodies, detection systems, and instruments. Since public data does not always show clear splits between research and diagnostic consumption, gaps were handled using expert-validated allocation factors and then rechecked against reported product-mix narratives.
Forecasts were developed using multivariate regression, where future market values were linked to expected oncology testing growth, automation adoption, and pricing progression assumptions that were reviewed with interviewees. Scenario checks were also run around tighter reimbursement environments and periods of unusually high instrument purchasing, so the final trajectory stayed practical rather than overly optimistic.
Data Validation & Update Cycle
Outputs were validated through triangulation across demand signals, supply signals, and expert feedback, and then tested for variance by region and by product category. When an assumption caused an unusual swing, the driver was traced back to the input series, and follow-up questions were triggered with respondents to confirm whether the change reflected reality or a modeling artifact.
Before sign-off, the model and narrative are reviewed in multiple steps by analysts, including checks on currency conversion timing, inflation treatment, and year-on-year growth logic. The report is refreshed annually, and interim updates are done when there are material events like major regulatory changes, large acquisitions, or sharp shifts in diagnostic testing practices. Right before delivery, a final pass is completed so clients receive the most current view that can be supported by the underlying sources.
Mordor Intelligence's Immunohistochemistry Market Size Versus Other Published Estimates
Published market sizes for immunohistochemistry often vary because the underlying scope is not always identical, even when titles appear similar. Differences typically come from what is counted as product revenue, how research versus diagnostic use is split, and which year is treated as the base for currency and pricing.
In some estimates, software and broader pathology workflow tools are added to the total, or services revenue is blended into the value, which can lift the number. Another common gap comes from how antibody pricing is trended over time and whether automation-driven throughput growth is treated as a volume effect, a price effect, or both. The table shows how these choices can move the market value up or down for the same general industry.
Benchmark comparison
| Source | Market Size | Gaps in Research Methodology |
|---|---|---|
| Mordor Intelligence | USD 3.18 B (2026) | |
| Global Consultancy A | USD 3.55 B (2025) | Uses an earlier base year and commonly bundles adjacent workflow items such as software and some service revenue, and it may apply a stronger ASP uplift assumption across antibodies and kits. |
| Industry Publisher B | USD 2.32 B (2025) | Leans on a narrower spend perimeter that can undercount automated instruments and premium detection systems, and it may rely on fewer cross-checks for diagnostic versus research consumption splits. |
Taken together, most of the spread is explained by whether software and services are included, how reagent ASPs are progressed, and how the diagnostic workload is converted into slide and reagent demand. By tying the total to case-volume driven staining activity and by separating product revenue from services and adjacent digital tools, the estimate stays traceable to repeatable inputs, which is the modeling choice applied by Mordor Intelligence.


Key Questions Answered in the Report
What is the current size of the immunohistochemistry market?
The immunohistochemistry market is valued at USD 3.18 billion in 2026 and is projected to reach USD 4.42 billion by 2031.
Which product segment is growing fastest?
Software solutions, encompassing AI-enabled image analysis and workflow platforms, are advancing at an 7.58% CAGR through 2031.
Why is Asia-Pacific the fastest-growing region?
Strong healthcare infrastructure investment, a growing cancer burden, and rising precision-medicine adoption push Asia-Pacific ahead at an 7.84% CAGR.
How will new FDA regulations affect laboratories?
The 2024 FDA rule classifies immunohistochemistry assays as medical devices, requiring validation steps that could cost the sector USD 566 million–3.56 billion but favor well-capitalized suppliers.
What technological advances are reshaping immunohistochemistry workflows?
AI-assisted multiplex staining, virtual staining from H&E images, and cloud-based digital pathology ecosystems collectively enhance accuracy and throughput, fueling market growth.
Which application area shows the highest long-term growth?
Drug discovery and testing, supported by pharmaceutical outsourcing to contract research organizations, is projected to grow at an 7.72% CAGR through 2031.
Page last updated on:


 Your data is secure and never sold or shared.


