Asia-Pacific Remote Sensing Satellites Market Size and Share
Market Overview
| Study Period | 2017 - 2030 |
|---|---|
| Forecast Data Period | 2025 - 2030 |
| Historical Data Period | 2017 - 2023 |
| Market Size (2025) | USD 22.05 Billion |
| Market Size (2030) | USD 43.4 Billion |
| Growth Rate (2025 - 2030) | 14.51% CAGR |
| Market Concentration | High |
Major Players*Disclaimer: Major Players sorted in no particular order Image © Mordor Intelligence. Reuse requires attribution under CC BY 4.0. | |

Asia-Pacific Remote Sensing Satellites Market Analysis by Mordor Intelligence
The Asia-Pacific Remote Sensing Satellites Market size is estimated at 22.05 billion USD in 2025, and is expected to reach 43.4 billion USD by 2030, growing at a CAGR of 14.51% during the forecast period (2025-2030).
The Asia-Pacific remote sensing satellites industry is experiencing transformative growth driven by increasing commercial applications and technological advancements. Commercial satellite users in the region have demonstrated significant momentum, with approximately 222 remote sensing satellites deployed into orbit for commercial uses during 2017-2022. The advancement in satellite technology has enabled enhanced capabilities in areas such as environmental monitoring, forest management, energy exploration, and urban planning. These developments have attracted substantial private sector investment, leading to the emergence of new market players and innovative business models in the satellite industry.
The industry has witnessed remarkable progress in satellite constellation deployments and technological capabilities. A prime example is the successful launch of 89 Jilin-1 satellites between January 2022 and January 2023, demonstrating the region's growing capability in deploying large-scale satellite networks. These satellites, each weighing 30-45 kg, are equipped with high-resolution cameras capable of capturing both optical and hyperspectral imagery for various mapping applications. This trend highlights the increasing sophistication of satellite technology and its expanding applications across different sectors.
Government support and strategic investments continue to shape the market landscape significantly. South Korea's Ministry of Science and ICT's announcement of a USD 619 million space budget in 2022 for manufacturing satellites, rockets, and other key space equipment exemplifies the strong governmental commitment to space technology development. Similar initiatives across the region have fostered innovation and created opportunities for public-private partnerships, contributing to the overall market expansion and technological advancement.
The market is characterized by growing demand for medium-sized satellites, evidenced by the deployment of 126 medium-sized remote sensing satellites into orbit during 2017-2022. These satellites serve various applications, including Earth observation satellites, disaster management, urban planning, natural resource management, and climate monitoring. The trend towards medium-sized satellites reflects a balance between capability and cost-effectiveness, making them particularly attractive for both commercial and government applications. Industry collaborations and partnerships between satellite manufacturers, launch service providers, and end-users have become increasingly common, fostering innovation and market growth.
Asia-Pacific Remote Sensing Satellites Market Trends and Insights
Rising demand for satellite miniaturization is driving the market
- Miniature satellites leverage advances in computation, miniaturized electronics, and packaging to produce sophisticated mission capabilities. As microsatellites can share the ride to space with other missions, they offer a considerable reduction in launch costs.
- The demand from Asia-Pacific is primarily driven by China, Japan, and India, which manufacture the largest number of small satellites annually. Though the launches have decreased over the last three years, the satellite market in these countries continues to hold huge potential. Ongoing investments in startups and nano and microsatellite development projects are expected to boost the revenue growth of the region. From 2017 to 2022, more than 550 nano and microsatellites were placed into orbit by various players in the region.
- China is investing significant resources toward augmenting its space-based capabilities. The country has launched the largest number of nano and microsatellites in the Asia-Pacific region. In April 2022, Chinese startup SpaceWish’s nanosatellite was launched into LEO aboard the CZ-2C (3) rocket. XINGYUAN-2 is a 6U remote sensing CubeSat that weighs approximately 7.5 kg.
- Singapore has become a pioneer in the fabrication of nanosatellites, with several models being designed each year for scientific missions. The SpooQy-1 NanoSat, which was launched by JAXA in 2019, is the brainchild of the Centre for Quantum Technologies (CQT) at the National University of Singapore. The 3,000 cm3 satellite weighs just 2.6 kg and is designed to demonstrate the physical phenomenon of quantum entanglement in space, which, if proven, may unlock quantum communications in space and attract investments worth USD 20 billion by 2030.
,-Number-of-Launches,-Asia-Pacific,-2017---2022.svg)


Rising investment opportunities in the market are driving spending on space programs
- Considering the increase in space-related activities in the Asia-Pacific region, satellite manufacturers are enhancing their production capabilities to tap into the rapidly emerging market potential. The prominent countries in Asia-Pacific that possess a robust space infrastructure are China, India, Japan, and South Korea. China National Space Administration announced space exploration priorities for the 2021–2025 period, including enhancing national civil space infrastructure and ground facilities. As a part of this plan, the Chinese government established China Satellite Network Group Co. Ltd for the development of a 13,000-satellite constellation for providing satellite internet services.
- In 2022, according to the draft budget of Japan, the space budget of the country was over USD 1.4 billion, which included investment for space activities of 11 government ministries. These activities include the development of the H3 rocket, Engineering Test Satellite-9, and the nation's Information Gathering Satellite (IGS) program. India has become a global leader in third-party launch services and has several ongoing R&D programs for new launch platforms. The proposed budget for India's space programs for FY22 was USD 1.83 billion.
- South Korea's space program has seen slow progress as other countries are reluctant to transfer core technologies. In 2022, the Ministry of Science and ICT announced a space budget of USD 619 million for manufacturing satellites, rockets, and other key space equipment. Many Southeast Asian countries have also recently started investing in space technology. As of March 2021, the Indonesian government had secured USD 545 million to continue the fabrication of the Very High Throughput Satellite (SATRIA), using a Public Private Partnership (PPP) scheme.

OTHER KEY INDUSTRY TRENDS COVERED IN THE REPORT
- Small satellites are poised to create demand in the market
- Rising demand for satellite miniaturization is driving the market
Segment Analysis: Satellite Mass
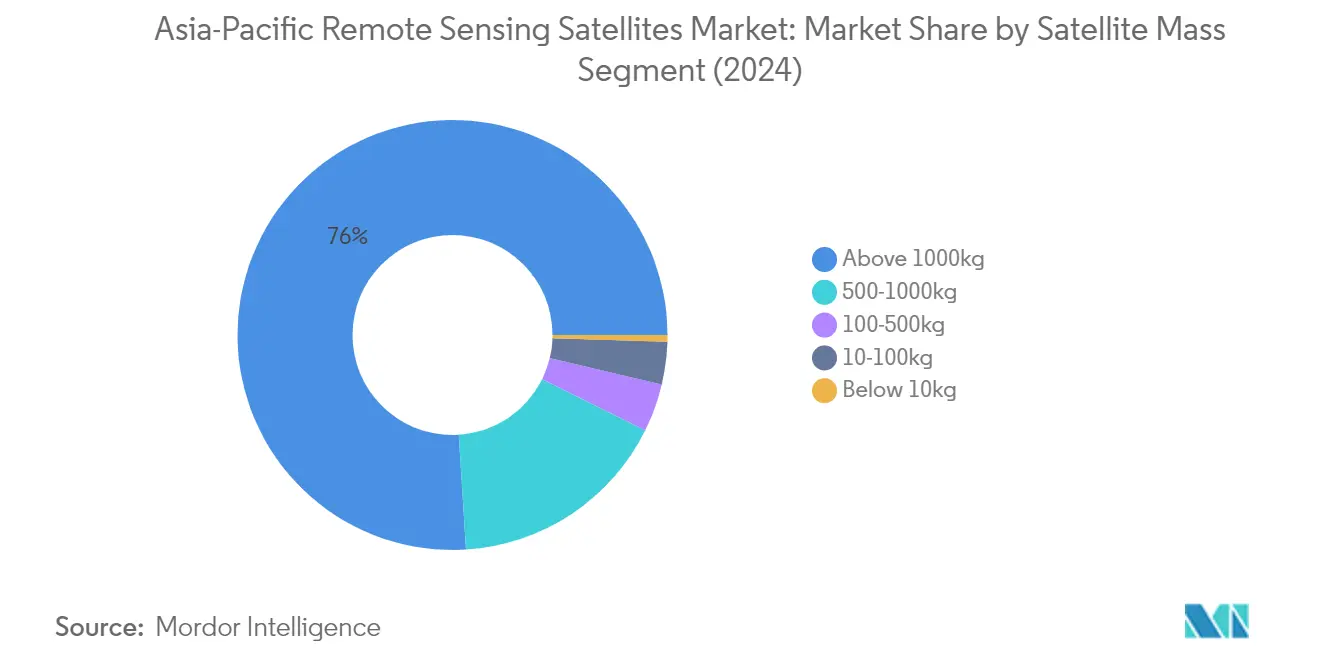
Above 1000kg Segment in Asia-Pacific Remote Sensing Satellites Market
The above 1000kg satellite segment dominates the Asia-Pacific remote sensing satellites market, commanding approximately 76% market share in 2024. These large satellites are primarily designed for operational purposes with extended lifetimes ranging between 5 and 10 years. They are equipped with redundant systems for all major subsystems to support random failures and extend their operational lifespan. These satellites typically utilize radiation-resistant space-grade electronics and generate substantial power through larger deployable solar panels to support all subsystems and larger loads. Due to their larger bodies and solar panels, they experience greater atmospheric drag, necessitating more powerful propulsion systems. These satellites commonly employ chemical propulsion systems for orbit and altitude corrections, making them ideal for applications such as electronic intelligence, Earth/weather science, laser imaging, and meteorology.

10-100kg Segment in Asia-Pacific Remote Sensing Satellites Market
The 10-100kg microsatellite segment is projected to experience the fastest growth in the Asia-Pacific remote sensing satellites market from 2024 to 2029. These microsatellites are designed for medium applications with operational lifetimes of up to two years and offer redundancy for critical subsystems like bus management units. Many microsatellites carry propulsion systems and are predominantly used in constellations. The segment's rapid growth is driven by their lower manufacturing costs and ease of mass production. Their shorter development timelines reduce overall program costs, providing budget-friendly options for space programs with limited resources. Industry experts note that approximately 80% of a program's goals can be achieved at 20% of the cost using small spacecraft solutions, making them increasingly attractive for various earth observation satellites applications.
Remaining Segments in Satellite Mass
The remaining segments in the market include satellites ranging from 500-1000kg (medium satellites), 100-500kg (minisatellites), and below 10kg (nanosatellites). Medium satellites serve as a bridge between large and small satellites, offering a balance of capabilities and cost-effectiveness. Minisatellites compete with large satellites in many applications, featuring miniature but redundant electronics and field-programmable gate arrays. Nanosatellites, despite their small size, are gaining popularity in the region due to their affordability and rapid development timelines, particularly for Earth observation and experimental missions. These segments collectively contribute to a diverse ecosystem of satellite capabilities, serving various commercial, military, and research applications across the Asia-Pacific region.
Segment Analysis: Orbit Class
LEO Segment in Asia-Pacific Remote Sensing Satellites Market
Low Earth Orbit (LEO) dominates the Asia-Pacific remote sensing satellites market, commanding approximately 80% market share in 2024. This significant market position is driven by the increasing adoption of LEO satellites for Earth observation applications, particularly in areas such as environmental monitoring, disaster management, and urban planning. The segment's dominance is further strengthened by the growing deployment of small satellite constellations in LEO, which provide enhanced coverage and more frequent revisit times. Countries like China have been particularly active in this segment, launching multiple Earth observation satellites into LEO orbits for various applications including agriculture, resource management, and maritime surveillance. The lower launch costs and reduced latency associated with LEO satellites have made them particularly attractive for commercial and government applications in the region.
MEO Segment in Asia-Pacific Remote Sensing Satellites Market
The Medium Earth Orbit (MEO) segment is emerging as the fastest-growing segment in the Asia-Pacific remote sensing satellites market, projected to grow at approximately 17% during 2024-2029. This growth is primarily driven by the increasing demand for navigation and positioning services, particularly from countries developing their own satellite navigation systems. The segment's expansion is supported by technological advancements in MEO satellite capabilities, enabling improved coverage and more accurate data collection for various applications. The growing investment in MEO satellite constellations by regional powers, particularly for applications such as precise positioning, navigation, and timing services, is expected to further accelerate this segment's growth. The versatility of MEO satellites in providing a balance between coverage area and signal strength makes them increasingly attractive for both commercial and military applications.
Remaining Segments in Orbit Class
The Geostationary Earth Orbit (GEO) segment continues to play a crucial role in the Asia-Pacific remote sensing satellites market, particularly for applications requiring continuous coverage over specific geographic areas. GEO satellites are especially valuable for weather monitoring, climate research, and long-term environmental observation due to their ability to maintain a fixed position relative to Earth. These satellites provide consistent coverage and are particularly important for applications requiring real-time data transmission and continuous monitoring capabilities. The segment maintains its significance in the market through its unique ability to provide uninterrupted coverage over large geographical areas, making it essential for regional weather forecasting and disaster monitoring applications.
Segment Analysis: Satellite Subsystem
Propulsion Hardware and Propellant Segment in Asia-Pacific Remote Sensing Satellites Market
The Propulsion Hardware and Propellant segment dominates the Asia-Pacific remote sensing satellites market, commanding approximately 80% market share in 2024. This significant market position is driven by the increasing demand for satellite propulsion systems required for mass satellite constellation deployments across the region. The segment's dominance is further strengthened by the critical role these systems play in transferring spacecraft into orbit and maintaining their positions throughout their operational lifetime. The growing emphasis on developing advanced propulsion technologies, including high-efficiency electric propulsion systems and sophisticated chemical propulsion solutions, has contributed to the segment's market leadership. Additionally, the rising number of satellite launches in countries like China, Japan, and India has created substantial demand for reliable propulsion systems, reinforcing this segment's market dominance.
Solar Array & Power Hardware Segment in Asia-Pacific Remote Sensing Satellites Market
The Solar Array & Power Hardware segment is emerging as the fastest-growing segment in the market, projected to grow at approximately 16% during the forecast period 2024-2029. This remarkable growth is primarily attributed to the increasing power requirements of modern satellites and the continuous technological advancements in solar panel efficiency. The segment's expansion is further driven by the growing trend toward satellite miniaturization, which demands more efficient and compact power solutions. The development of innovative solar array technologies, including deployable and flexible solar panels, is contributing to this growth trajectory. Additionally, the increasing focus on sustainable space operations and the need for reliable power generation systems in harsh space environments has led to substantial investments in advanced solar array technologies, particularly in countries like China and Japan, where space programs are rapidly expanding.
Remaining Segments in Satellite Subsystem
The other significant segments in the satellite subsystem market include Satellite Bus & Subsystems and Structures, Harness & Mechanisms. The Satellite Bus & Subsystems segment plays a crucial role in providing the fundamental framework and core functionality for satellite operations, including attitude control, thermal management, and communication systems. This segment continues to evolve with the integration of advanced technologies and miniaturized components. The Structures, Harness & Mechanisms segment focuses on the physical architecture and mechanical systems of satellites, including antenna deployment mechanisms and structural support systems. Both segments are experiencing technological advancements driven by the increasing demand for more efficient and reliable satellite systems in the Asia-Pacific region.
Segment Analysis: End User
Military & Government Segment in Asia-Pacific Remote Sensing Satellites Market
The Military & Government segment dominates the Asia-Pacific remote sensing satellites market, commanding approximately 93% market share in 2024. This segment's prominence is driven by the increasing use of satellites in surveillance missions and the rising involvement of government space agencies in satellite development programs. Military organizations require real-time information to make critical decisions, and satellite technology provides them with this capability. The segment is also experiencing robust growth, projected to expand at around 15% through 2024-2029, driven by increasing investments in space-based capabilities and national security requirements. Countries across the region are actively developing and launching military satellites for various applications, including telecommunications, reconnaissance, and Earth observation. For instance, China's deployment of advanced military satellites and India's focus on strengthening its space-based surveillance capabilities demonstrate the segment's strategic importance.
Commercial Segment in Asia-Pacific Remote Sensing Satellites Market
The commercial segment represents a significant opportunity in the Asia-Pacific remote sensing satellites market, driven by increasing connectivity needs and growing demand for broadcasting and navigation services. Commercial satellite users have experienced significant growth in recent years, supported by expanding remote sensing and Earth observation applications, and favorable government policies supporting the space industry's development. This demand is creating substantial opportunities for satellite manufacturers, operators, and service providers. The segment's growth is particularly evident in applications such as environmental monitoring, forest management, energy, mining, and land planning. Commercial entities are increasingly deploying large constellations of remote sensing satellites for Earth observation to enhance their capabilities in gathering data and insights. The trend toward satellite miniaturization and cost reduction is making space technology more accessible to commercial users, further driving segment growth.
Remaining Segments in End User Segmentation
The Other segment, primarily comprising academic institutions, NGOs, and research organizations, plays a vital role in advancing remote sensing satellite technology and applications. These organizations focus on scientific research and educational purposes rather than commercial applications, contributing to technological innovation and knowledge development in the field. Universities and research institutes in the region often cooperate with satellite manufacturers or develop their small satellites for research and teaching purposes. While this segment may have limited funding compared to commercial and government sectors, it serves as an important platform for testing new technologies and conducting specialized research in areas where commercial or government-operated satellites may not provide the necessary data. The collaboration between academic institutions and industry partners continues to drive innovation in satellite technology and applications.
Competitive Landscape
Top Companies in Asia-Pacific Remote Sensing Satellites Market
The leading companies in the market are focusing heavily on technological advancement and product innovation, particularly in developing advanced earth observation satellites capabilities and high-resolution imaging systems. Companies are investing in expanding their manufacturing facilities and establishing regional offices across Asia-Pacific to strengthen their market presence and better serve local customers. Strategic partnerships with government agencies, research institutions, and commercial entities have become increasingly common to enhance technological capabilities and market reach. Operational agility is demonstrated through rapid satellite deployment capabilities, flexible launch options, and the ability to customize solutions for specific customer requirements. Companies are also emphasizing the development of complete end-to-end solutions, from satellite manufacturing to satellite data services, to provide comprehensive solutions to their customers.
Government Dominance Shapes Market Competition Dynamics
The market is characterized by a strong presence of government-backed organizations and state-owned enterprises, particularly from China, Japan, and India. These organizations, such as China Aerospace Science and Technology Corporation (CASC), JAXA, and ISRO, hold significant market share due to their extensive technological capabilities and government support. The private sector's participation is growing but remains limited compared to government players, with companies like Chang Guang Satellite Technology and Axelspace Corporation gaining prominence through specialized offerings and innovative solutions.
The market shows moderate consolidation, with a few large players controlling substantial market share while numerous smaller companies operate in specialized niches. Merger and acquisition activities are limited due to government ownership of major players and the strategic importance of the technology. However, there is an increasing trend of joint ventures and strategic partnerships between established players and emerging companies to combine technological expertise and market access. The entry barriers remain high due to substantial capital requirements, technical expertise needs, and regulatory compliance challenges.
Innovation and Collaboration Drive Future Success
For incumbent players to maintain and increase their market share, focusing on continuous technological innovation and the development of advanced satellite capabilities is crucial. Establishing strong relationships with government agencies and participating in national space programs remains vital for sustained growth. Companies need to invest in developing comprehensive solution portfolios that include not just satellite manufacturing but also data analytics and value-added services to meet evolving customer needs. Additionally, expanding international partnerships and collaborations can help in accessing new markets and technologies.
New entrants and contenders can gain ground by focusing on specialized market segments and developing innovative solutions for specific applications. Building strategic partnerships with established players and government agencies can provide access to essential infrastructure and market opportunities. Companies need to consider the high concentration of government customers and develop strategies to address their specific requirements while also exploring commercial market opportunities. The regulatory environment, particularly regarding space debris and frequency allocation, will continue to impact market dynamics, making compliance capabilities crucial for success. The risk of substitution remains low due to the unique capabilities of satellite-based remote sensing, but companies must continue to demonstrate their value proposition against alternative technologies, such as geospatial imaging and satellite imaging solutions.
Asia-Pacific Remote Sensing Satellites Industry Leaders
Axelspace Corporation
Chang Guang Satellite Technology Co. Ltd
China Aerospace Science and Technology Corporation (CASC)
Japan Aerospace Exploration Agency (JAXA)
Korea Aerospace Research Institute (KARI)
- *Disclaimer: Major Players sorted in no particular order


Recent Industry Developments
- March 2023: The Japan Aerospace Exploration Agency (JAXA) had scheduled the launch of the first H3 Launch Vehicle with the Advanced Land Observing Satellite "Daichi 3" (ALOS-3) onboard from the Tanegashima Space Center.
- February 2023: NASA and geographic information service provider Esri will grant wider access to the space agency’s geospatial content for research and exploration purposes through the Space Act Agreement.
- January 2023: Axelspace announced an agreement with NorthStar Earth & Space Inc. Through this partnership, Axelspace will utilize five AxelGlobe Earth observation satellites, GRUS, to provide complementary satellite imaging data for NorthStar’s space situational awareness (SSA) efforts.


Asia-Pacific Remote Sensing Satellites Market Report Scope
10-100kg, 100-500kg, 500-1000kg, Below 10 Kg, above 1000kg are covered as segments by Satellite Mass. GEO, LEO, MEO are covered as segments by Orbit Class. Propulsion Hardware and Propellant, Satellite Bus & Subsystems, Solar Array & Power Hardware, Structures, Harness & Mechanisms are covered as segments by Satellite Subsystem. Commercial, Military & Government are covered as segments by End User.| 10-100kg |
| 100-500kg |
| 500-1000kg |
| Below 10 Kg |
| above 1000kg |
| GEO |
| LEO |
| MEO |
| Propulsion Hardware and Propellant |
| Satellite Bus & Subsystems |
| Solar Array & Power Hardware |
| Structures, Harness & Mechanisms |
| Commercial |
| Military & Government |
| Other |
| Satellite Mass | 10-100kg |
| 100-500kg | |
| 500-1000kg | |
| Below 10 Kg | |
| above 1000kg | |
| Orbit Class | GEO |
| LEO | |
| MEO | |
| Satellite Subsystem | Propulsion Hardware and Propellant |
| Satellite Bus & Subsystems | |
| Solar Array & Power Hardware | |
| Structures, Harness & Mechanisms | |
| End User | Commercial |
| Military & Government | |
| Other |


Market Definition
- Application - Various applications or purposes of the satellites are classified into communication, earth observation, space observation, navigation, and others. The purposes listed are those self-reported by the satellite’s operator.
- End User - The primary users or end users of the satellite is described as civil (academic, amateur), commercial, government (meteorological, scientific, etc.), military. Satellites can be multi-use, for both commercial and military applications.
- Launch Vehicle MTOW - The launch vehicle MTOW (maximum take-off weight) means the maximum weight of the launch vehicle during take-off, including the weight of payload, equipment and fuel.
- Orbit Class - The satellite orbits are divided into three broad classes namely GEO, LEO, and MEO. Satellites in elliptical orbits have apogees and perigees that differ significantly from each other and categorized satellite orbits with eccentricity 0.14 and higher as elliptical.
- Propulsion tech - Under this segment, different types of satellite propulsion systems have been classified as electric, liquid-fuel and gas-based propulsion systems.
- Satellite Mass - Under this segment, different types of satellite propulsion systems have been classified as electric, liquid-fuel and gas-based propulsion systems.
- Satellite Subsystem - All the components and subsystems which includes propellants, buses, solar panels, other hardware of satellites are included under this segment.
| Keyword | Definition |
|---|---|
| Attitude Control | The orientation of the satellite relative to the Earth and the sun. |
| INTELSAT | The International Telecommunications Satellite Organization operates a network of satellites for international transmission. |
| Geostationary Earth Orbit (GEO) | Geostationary satellites in Earth orbit 35,786 km (22,282 mi) above the equator in the same direction and at the same speed as the earth rotates on its axis, making them appear fixed in the sky. |
| Low Earth Orbit (LEO) | Low Earth Orbit satellites orbit from 160-2000km above the earth, take approximately 1.5 hours for a full orbit and only cover a portion of the earth’s surface. |
| Medium Earth Orbit (MEO) | MEO satellites are located above LEO and below GEO satellites and typically travel in an elliptical orbit over the North and South Pole or in an equatorial orbit. |
| Very Small Aperture Terminal (VSAT) | Very Small Aperture Terminal is an antenna that is typically less than 3 meters in diameter |
| CubeSat | CubeSat is a class of miniature satellites based on a form factor consisting of 10 cm cubes. CubeSats weigh no more than 2 kg per unit and typically use commercially available components for their construction and electronics. |
| Small Satellite Launch Vehicles (SSLVs) | Small Satellite Launch Vehicle (SSLV) is a three-stage Launch Vehicle configured with three Solid Propulsion Stages and a liquid propulsion-based Velocity Trimming Module (VTM) as a terminal stage |
| Space Mining | Asteroid mining is the hypothesis of extracting material from asteroids and other asteroids, including near-Earth objects. |
| Nano Satellites | Nanosatellites are loosely defined as any satellite weighing less than 10 kilograms. |
| Automatic Identification System (AIS) | Automatic identification system (AIS) is an automatic tracking system used to identify and locate ships by exchanging electronic data with other nearby ships, AIS base stations, and satellites. Satellite AIS (S-AIS) is the term used to describe when a satellite is used to detect AIS signatures. |
| Reusable launch vehicles (RLVs) | Reusable launch vehicle (RLV) means a launch vehicle that is designed to return to Earth substantially intact and therefore may be launched more than one time or that contains vehicle stages that may be recovered by a launch operator for future use in the operation of a substantially similar launch vehicle. |
| Apogee | The point in an elliptical satellite orbit which is farthest from the surface of the earth. Geosynchronous satellites which maintain circular orbits around the earth are first launched into highly elliptical orbits with apogees of 22,237 miles. |


Research Methodology
Mordor Intelligence follows a four-step methodology in all our reports.
- Step-1: Identify Key Variables: In order to build a robust forecasting methodology, the variables and factors identified in Step-1 are tested against available historical market numbers. Through an iterative process, the variables required for market forecast are set and the model is built on the basis of these variables.
- Step-2: Build a Market Model: Market-size estimations for the historical and forecast years have been provided in revenue and volume terms. For sales conversion to volume, the average selling price (ASP) is kept constant throughout the forecast period for each country, and inflation is not a part of the pricing.
- Step-3: Validate and Finalize: In this important step, all market numbers, variables and analyst calls are validated through an extensive network of primary research experts from the market studied. The respondents are selected across levels and functions to generate a holistic picture of the market studied.
- Step-4: Research Outputs: Syndicated Reports, Custom Consulting Assignments, Databases & Subscription Platforms.


