North America Remote Sensing Satellites Market Size and Share
Market Overview
| Study Period | 2017 - 2030 |
|---|---|
| Forecast Data Period | 2025 - 2030 |
| Historical Data Period | 2017 - 2023 |
| Market Size (2025) | USD 20.68 Billion |
| Market Size (2030) | USD 30.27 Billion |
| Growth Rate (2025 - 2030) | 7.92% CAGR |
| Market Concentration | High |
Major Players*Disclaimer: Major Players sorted in no particular order Image © Mordor Intelligence. Reuse requires attribution under CC BY 4.0. | |

North America Remote Sensing Satellites Market Analysis by Mordor Intelligence
The North America Remote Sensing Satellites Market size is estimated at 20.68 billion USD in 2025, and is expected to reach 30.27 billion USD by 2030, growing at a CAGR of 7.92% during the forecast period (2025-2030).
The North American remote sensing satellites industry is experiencing unprecedented growth driven by technological advancements and increasing demand for earth observation satellites capabilities. The integration of artificial intelligence and machine learning in satellite data analytics has revolutionized how information is collected and analyzed from space. Private companies and government agencies are increasingly collaborating to develop advanced satellite technologies, with companies like SpaceX demonstrating the viability of large satellite constellations through its Starlink program, which operated over 3,000 small satellites in low Earth orbit as of September 2022. The emergence of software-defined payloads and advanced imaging technologies has enabled more flexible and capable satellite systems.
The military and defense sector continues to be a primary driver of market growth, with significant investments in satellite technology for surveillance and satellite reconnaissance capabilities. The United States maintains its position as the world's largest defense spender, with a defense budget of $773 billion in 2022, a substantial portion of which is allocated to space-based capabilities. Recent developments include Astranis Space Technologies' February 2023 contract with the US military to integrate military communications waveforms on satellite payloads, demonstrating the growing intersection of commercial and defense space capabilities. The industry has also witnessed increased emphasis on secure satellite communications and enhanced imaging capabilities for military applications.
Commercial applications are expanding rapidly, particularly in areas such as environmental monitoring, agriculture, and urban planning. In January 2023, Lockheed Martin unveiled its new LM 400 multi-mission spacecraft, designed to support various commercial and government applications including remote sensing satellites, communications, and persistent surveillance. The industry has seen significant advancement in synthetic aperture radar (SAR) technology, exemplified by Capella Space's March 2023 launch of commercial radar imaging satellites capable of providing high-resolution imagery regardless of weather conditions or time of day. These developments are enabling new commercial use cases and expanding market opportunities.
The industry is characterized by increasing collaboration between private companies, government agencies, and academic institutions. Of the total remote sensing satellites manufactured and launched in recent years, approximately 93% were dedicated to government or military purposes, while 7% served commercial applications. This distribution highlights the significant role of government contracts and defense applications in driving market growth, while also indicating potential opportunities for expansion in the commercial sector. The trend toward public-private partnerships has accelerated innovation and reduced development cycles, leading to more efficient and cost-effective satellite solutions.
North America Remote Sensing Satellites Market Trends and Insights
The global demand for satellite miniaturization is rising
- The ability of small satellites to perform nearly all the functions of a traditional satellite at a fraction of its cost has increased the viability of building, launching, and operating small satellite constellations. Small satellites are increasingly preferred for scientific research, military, and defense sectors over commercial applications. During 2017-2022, a total of 596 nanosatellites were placed in orbit by various players in the region.
- The demand from North America is primarily driven by the United States, which manufactures the largest number of small satellites each year. Though the launches from the country have decreased over the last three years, there is huge potential in the country's industry, and the ongoing investments in the startups and the nano and microsatellite development projects are expected to boost the region's revenue growth.
- NASA supports nano and microsatellite developers under several support initiatives. For instance, under the CubeSat Launch initiative (CSLI), NASA provides access to space for small satellites and CubeSats developed by NASA centers and programs, educational institutions, and non-profit organizations. This provides CubeSat developers access to a low-cost pathway to conduct research in the areas of science, exploration, technology development, education, and operations. The Canadian government is emphasizing the development of necessary skill sets for nanosatellite development at the university level. For instance, Wyvern, a Canadian startup, aims at providing relatively low-cost access to hyperspectral imaging taken from low Earth orbit with the help of CubeSats.
,-Number-of-Launches,-North-America,-2017---2022.svg)


Investment opportunities are increasing in the market
- In North America, government expenditure for space programs reached approximately USD 103 billion in 2021. The region is the epicenter of space innovation and research, with the presence of the world's biggest space agency, NASA. In 2022, the US government spent nearly USD 62 billion on its space programs, making it the highest spender on space programs in the world. In terms of research and investment grants, the region's governments and the private sector have dedicated funds for research and innovation in the space sector. Agencies spend available budgetary resources by making financial promises called obligations. For instance, till February 2023, NASA provided USD 333 million as research grants.
- According to the Canadian government, the Canadian space sector employs 10,000 people and adds around USD 2.3 billion to the Canadian GDP. The government reported that 90% of Canadian space firms are small and medium-sized businesses. The Canadian Space Agency (CSA) budget is modest, and the estimated budgetary spending for 2022-23 was USD 329 million. The Canadian government envisions ensuring the total coverage of high-speed internet throughout the country by 2030.
- In July 2019, the Canadian government announced an investment of USD 64.7 million in Telesat to provide better broadband internet access to rural and remote communities. Telesat aimed to utilize its financial aid to build and test technologies that use LEO satellites to boost connectivity. The MoU stated a potential investment of CAD 600 million for gaining privileged access to the satellite network and helping deliver affordable high-speed internet services worth CAD 1.2 billion by 2029.

OTHER KEY INDUSTRY TRENDS COVERED IN THE REPORT
- Increased adoption of nano and minisatellites are poised to generate market demand
Segment Analysis: Satellite Mass
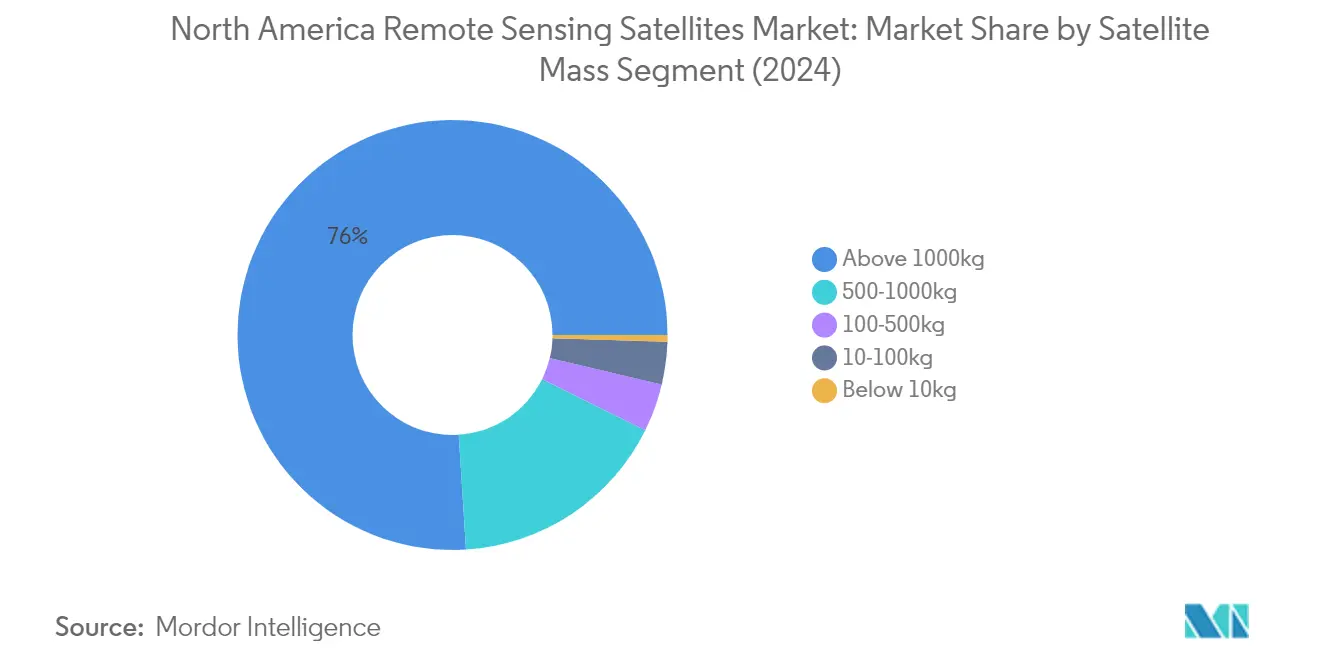
Above 1000kg Segment in North America Remote Sensing Satellites Market
The above 1000kg satellite segment dominates the North America remote sensing satellites market, accounting for approximately 76% of the total market value in 2024. These large satellites are primarily designed for operational purposes with extended lifespans ranging between 5 and 10 years, carrying larger satellite imaging payloads and more transponders for communication purposes. These operational satellites incorporate redundancy across all major subsystems to support accidental failures and extend lifespan, while utilizing radiation-hardened space-grade electronics. The segment's dominance is further strengthened by the presence of larger deployable solar panels that generate more power to support all subsystems and larger loads, along with high-powered propulsion systems necessary for orbital elevation and attitude correction due to greater atmospheric drag.

10-100kg (Microsatellite) Segment in North America Remote Sensing Satellites Market
The microsatellite segment is experiencing the fastest growth trajectory in the market, with an expected growth rate of approximately 14% during 2024-2029. Microsatellites have emerged as a cost-effective alternative, offering shorter development timelines that significantly reduce overall mission costs. These satellites can achieve around 80% of program goals at just 20% of the cost compared to larger satellites. The segment's growth is driven by their flexibility in responding to new technological opportunities and mission requirements. The success of microsatellites in the region is supported by a robust framework for design and manufacture, particularly in the United States, where these satellites are tailored to serve specific application profiles, including earth observation satellites.
Remaining Segments in Satellite Mass
The other satellite mass segments, including 500-1000kg (medium-sized satellites), 100-500kg (minisatellites), and below 10kg (nanosatellites), each serve distinct market needs and applications. Medium-sized satellites are particularly valuable for surveillance and intelligence gathering missions, while minisatellites compete with larger satellites in many applications through their use of miniature but redundant electronics. Nanosatellites, though smaller in market share, are gaining importance in scientific research and educational initiatives, offering opportunities for rapid deployment and constellation formation. These segments collectively contribute to the market's diversity and technological advancement, providing options for various mission requirements and budget constraints.
Segment Analysis: Orbit Class
LEO Segment in North America Remote Sensing Satellites Market
Low Earth Orbit (LEO) dominates the North America remote sensing satellites market, commanding approximately 80% market share in 2024. This significant market position is attributed to the increasing adoption of LEO satellites in modern communication technologies and their crucial role in earth observation satellites applications. Operating at altitudes below 1000 km, these satellites are widely deployed for communications, military reconnaissance, espionage, and various imaging applications. The competitive landscape in the LEO segment is particularly intense in North America, with major players like Amazon's Kuiper Systems and OneWeb's Starlink competing to provide global broadband connectivity from space. The segment's dominance is further strengthened by the shorter signal runtimes and lower latency compared to other orbital classes, making them ideal for time-sensitive applications and real-time data transmission.
MEO Segment in North America Remote Sensing Satellites Market
The Medium Earth Orbit (MEO) segment is emerging as the fastest-growing segment in the North America remote sensing satellites market, with projections indicating robust growth through 2024-2029. Operating at an altitude of around 20,000 km, MEO satellites are increasingly preferred for global navigation systems and earth observation applications. The segment's growth is primarily driven by expanding military applications, where these satellites provide critical navigation services and intelligence capabilities. Recent developments include Raytheon Technologies and Boeing's Millennium Space Systems' collaboration on the Missile Track Custody MEO Overhead Persistent Infrared Sensor payload for the US Space Force. The US Space Force's plans to deploy a constellation of 16 missile-warning and missile-tracking satellites in MEO further demonstrate the segment's growing importance in national security applications.
Remaining Segments in Orbit Class
The Geostationary Earth Orbit (GEO) segment continues to play a vital role in the North America remote sensing satellites market, particularly in applications requiring continuous coverage of specific geographic areas. GEO satellites, positioned approximately 35,786 km above the Earth's equator, are essential for various applications including communications, navigation, surveillance, remote sensing, weather forecasting, satellite broadcasting, and Internet services. These satellites offer unique advantages in terms of providing constant coverage over specific regions, making them particularly valuable for weather monitoring and long-term Earth observation missions. The segment maintains its significance through continuous technological advancements and integration with other orbital systems to provide comprehensive space-based services.
Segment Analysis: Satellite Subsystem
Propulsion Hardware and Propellant Segment in North America Remote Sensing Satellites Market
The propulsion hardware and propellant segment continues to dominate the North American remote sensing satellites market, commanding approximately 79% market share in 2024. This segment's prominence is primarily driven by the increasing launch of mass satellite constellations into space, where propulsion systems play a crucial role in transferring spacecraft to orbit and adjusting their positions. The development of advanced propulsion technologies, including both chemical and electric propulsion systems, has further strengthened this segment's market position. Recent innovations in environmentally friendly propulsion technologies, such as those implemented by companies like Hypernova and Sidus Space Inc., have contributed to the segment's growth. These systems are essential for both small satellites and large satellites, providing capabilities for orbit transfer, stabilization, and maintaining proper satellite positioning throughout their operational lifetime.
Satellite Bus & Subsystems Segment in North America Remote Sensing Satellites Market
The satellite bus & subsystems segment is emerging as the fastest-growing segment in the market, projected to grow at approximately 17% during 2024-2029. This remarkable growth is driven by significant technological advancements in miniaturized electronics and the increasing demand for flexible, multi-mission spacecraft platforms. The segment's expansion is further supported by private players investing heavily in research and development to exploit new market opportunities. Recent developments, such as Lockheed Martin's LM 400 multi-mission spacecraft, demonstrate the industry's focus on creating adaptable satellite buses that can support multiple missions, including satellite imaging, communications, radar, and persistent surveillance. The trend toward miniaturization of electronic components has enabled the creation of lightweight and affordable satellite buses while providing advanced technological capabilities comparable to older generation satellites.
Remaining Segments in Satellite Subsystem
The solar array & power hardware and structures, harness & mechanisms segments continue to play vital roles in the North American remote sensing satellites market. The solar array & power hardware segment is crucial for providing sustainable power solutions to satellites, with ongoing innovations in solar panel technologies and power management systems enhancing satellite operational efficiency. Meanwhile, the structures, harness & mechanisms segment focuses on providing robust structural support and mechanical systems essential for satellite functionality, including payload integration and deployment mechanisms. Both segments are experiencing technological advancements, particularly in materials science and manufacturing processes, contributing to the development of more efficient and reliable satellite systems. These segments are integral to the overall satellite ecosystem, working in conjunction with propulsion and bus systems to ensure optimal satellite performance and longevity.
Segment Analysis: End User
Military & Government Segment in North America Remote Sensing Satellites Market
The Military & Government segment dominates the North America remote sensing satellites market, commanding approximately 93% market share in 2024. This substantial market presence is driven by increasing defense spending across major economies in the region, particularly the United States, where the growing importance of the US Space Force has enabled it to take control of all military satellite communications. The segment's strength is further reinforced by the integration of space systems with air, land, and sea platforms, as military forces increasingly rely on satellites for operations. The US Space Force's ongoing collaborations with major defense companies such as Lockheed Martin Corporation and Raytheon Technologies Corporation for developing key projects like missile tracking systems continues to drive segment growth. High military budget spending, coupled with continuous technological advancements in satellite capabilities, maintains this segment's dominant position in the market.
Commercial Segment in North America Remote Sensing Satellites Market
The Commercial segment demonstrates strong growth potential in the North America remote sensing satellites market, with projections indicating significant expansion from 2024 to 2029. This growth is primarily driven by the increasing adoption of remote sensing technologies for various commercial applications, particularly in terms of radiative, spatial, and spectral resolution capabilities. The segment's expansion is supported by the rising importance of hyperspectral imaging (HSI) systems across multiple research programs in fields such as soil analysis, forestry, agriculture, urban development, and cryosphere studies. Commercial satellites have become crucial technological assets, serving diverse purposes from entertainment to basic utility services in many countries. The segment's growth is further bolstered by ongoing developments in satellite refueling capabilities and repair services, creating significant opportunities for market expansion and innovation in commercial space operations.
Remaining Segments in End User
The Other segment in the North America Remote Sensing Satellites market primarily comprises academic institutions and research organizations. While this segment represents a smaller portion of the market compared to military and commercial users, it plays a crucial role in advancing satellite technology and research applications. Academic institutions contribute significantly to scientific research and technological innovation, particularly in areas where commercial or government-operated satellites may not provide the necessary specialized data. These organizations often collaborate with government agencies and commercial entities on various research projects, fostering innovation and development in satellite technology. The segment's impact on the market is particularly notable in specialized research applications and educational initiatives that advance the overall field of remote sensing technology.
Competitive Landscape
Top Companies in North America Remote Sensing Satellites Market
The remote sensing satellites market in North America is characterized by continuous product innovation and strategic developments by major players. Companies are focusing on developing advanced satellite technologies, particularly in areas like high-resolution satellite imaging, synthetic aperture radar satellite capabilities, and enhanced satellite data analytics solutions. Operational agility is demonstrated through rapid satellite deployment capabilities and flexible manufacturing processes that allow customization based on specific mission requirements. Strategic moves in the industry primarily revolve around partnerships with government agencies, particularly military and defense departments, while expansion strategies include establishing new manufacturing facilities and research centers. Companies are also investing in developing smaller, more cost-effective satellite platforms while maintaining high-performance capabilities to address diverse market needs.
Market Dominated by Defense-Focused Large Players
The North American remote sensing satellite market exhibits a relatively concentrated structure dominated by large defense contractors and aerospace conglomerates with established government relationships. These major players, particularly those with significant defense contracts, maintain their market positions through extensive manufacturing capabilities, proprietary technologies, and long-standing relationships with government agencies. The market shows a clear distinction between established players focusing on large, sophisticated satellites and emerging companies specializing in smaller, more specialized satellite solutions.
The industry has witnessed limited merger and acquisition activity, with companies preferring strategic partnerships and joint ventures to expand capabilities and market reach. This trend is particularly evident in collaborations between traditional aerospace companies and technology firms, combining satellite manufacturing expertise with advanced data analytics capabilities. The market structure favors companies with proven track records in delivering reliable satellite systems, particularly for military and government applications, creating significant barriers for new entrants.
Innovation and Partnerships Drive Future Success
Success in the remote sensing satellite market increasingly depends on companies' ability to innovate while maintaining cost competitiveness. Incumbent players must focus on developing more efficient manufacturing processes, incorporating advanced technologies like artificial intelligence and machine learning in satellite operations, and expanding their service offerings beyond traditional satellite manufacturing. Companies need to establish strong partnerships with software and analytics firms to provide end-to-end solutions, from satellite manufacturing to data processing and analysis.
For contenders looking to gain market share, focusing on niche applications and developing specialized capabilities in areas like small satellite manufacturing or specific types of remote sensing technology offers the most promising path forward. The regulatory environment, particularly regarding space debris and frequency allocation, will play a crucial role in shaping future market dynamics. Companies must also address growing concerns about space sustainability and demonstrate their commitment to responsible space operations. The ability to provide integrated solutions that combine satellite capabilities with ground segment operations and data analytics will become increasingly important for maintaining competitive advantage. Additionally, the development of earth observation satellites will be crucial in meeting the diverse needs of various sectors.
North America Remote Sensing Satellites Industry Leaders
Capella Space Corp.
LeoStella
Lockheed Martin Corporation
Northrop Grumman Corporation
Planet Labs Inc.
- *Disclaimer: Major Players sorted in no particular order


Recent Industry Developments
- April 2023: NASA has awarded a sole source Blanket Purchase Agreement (BPA) to Capella Space Corporation of San Francisco to provide high-resolution Synthetic Aperture Radar (SAR) (0.5 meter to 1.2 meters) commercial Earth observation data products.
- March 2023: Rocket Lab's Electron rocket launched CapellaSpace's pair of commercial radar imaging satellites into orbit that are capable of seeing through clouds, in daylight or darkness, to monitor the planet below.
- February 2023: NASA and geographic information service provider Esri will grant wider access to the space agency’s geospatial content for research and exploration purposes through the Space Act Agreement.


North America Remote Sensing Satellites Market Report Scope
10-100kg, 100-500kg, 500-1000kg, Below 10 Kg, above 1000kg are covered as segments by Satellite Mass. GEO, LEO, MEO are covered as segments by Orbit Class. Propulsion Hardware and Propellant, Satellite Bus & Subsystems, Solar Array & Power Hardware, Structures, Harness & Mechanisms are covered as segments by Satellite Subsystem. Commercial, Military & Government are covered as segments by End User.| 10-100kg |
| 100-500kg |
| 500-1000kg |
| Below 10 Kg |
| above 1000kg |
| GEO |
| LEO |
| MEO |
| Propulsion Hardware and Propellant |
| Satellite Bus & Subsystems |
| Solar Array & Power Hardware |
| Structures, Harness & Mechanisms |
| Commercial |
| Military & Government |
| Other |
| Satellite Mass | 10-100kg |
| 100-500kg | |
| 500-1000kg | |
| Below 10 Kg | |
| above 1000kg | |
| Orbit Class | GEO |
| LEO | |
| MEO | |
| Satellite Subsystem | Propulsion Hardware and Propellant |
| Satellite Bus & Subsystems | |
| Solar Array & Power Hardware | |
| Structures, Harness & Mechanisms | |
| End User | Commercial |
| Military & Government | |
| Other |


Market Definition
- Application - Various applications or purposes of the satellites are classified into communication, earth observation, space observation, navigation, and others. The purposes listed are those self-reported by the satellite’s operator.
- End User - The primary users or end users of the satellite is described as civil (academic, amateur), commercial, government (meteorological, scientific, etc.), military. Satellites can be multi-use, for both commercial and military applications.
- Launch Vehicle MTOW - The launch vehicle MTOW (maximum take-off weight) means the maximum weight of the launch vehicle during take-off, including the weight of payload, equipment and fuel.
- Orbit Class - The satellite orbits are divided into three broad classes namely GEO, LEO, and MEO. Satellites in elliptical orbits have apogees and perigees that differ significantly from each other and categorized satellite orbits with eccentricity 0.14 and higher as elliptical.
- Propulsion tech - Under this segment, different types of satellite propulsion systems have been classified as electric, liquid-fuel and gas-based propulsion systems.
- Satellite Mass - Under this segment, different types of satellite propulsion systems have been classified as electric, liquid-fuel and gas-based propulsion systems.
- Satellite Subsystem - All the components and subsystems which includes propellants, buses, solar panels, other hardware of satellites are included under this segment.
| Keyword | Definition |
|---|---|
| Attitude Control | The orientation of the satellite relative to the Earth and the sun. |
| INTELSAT | The International Telecommunications Satellite Organization operates a network of satellites for international transmission. |
| Geostationary Earth Orbit (GEO) | Geostationary satellites in Earth orbit 35,786 km (22,282 mi) above the equator in the same direction and at the same speed as the earth rotates on its axis, making them appear fixed in the sky. |
| Low Earth Orbit (LEO) | Low Earth Orbit satellites orbit from 160-2000km above the earth, take approximately 1.5 hours for a full orbit and only cover a portion of the earth’s surface. |
| Medium Earth Orbit (MEO) | MEO satellites are located above LEO and below GEO satellites and typically travel in an elliptical orbit over the North and South Pole or in an equatorial orbit. |
| Very Small Aperture Terminal (VSAT) | Very Small Aperture Terminal is an antenna that is typically less than 3 meters in diameter |
| CubeSat | CubeSat is a class of miniature satellites based on a form factor consisting of 10 cm cubes. CubeSats weigh no more than 2 kg per unit and typically use commercially available components for their construction and electronics. |
| Small Satellite Launch Vehicles (SSLVs) | Small Satellite Launch Vehicle (SSLV) is a three-stage Launch Vehicle configured with three Solid Propulsion Stages and a liquid propulsion-based Velocity Trimming Module (VTM) as a terminal stage |
| Space Mining | Asteroid mining is the hypothesis of extracting material from asteroids and other asteroids, including near-Earth objects. |
| Nano Satellites | Nanosatellites are loosely defined as any satellite weighing less than 10 kilograms. |
| Automatic Identification System (AIS) | Automatic identification system (AIS) is an automatic tracking system used to identify and locate ships by exchanging electronic data with other nearby ships, AIS base stations, and satellites. Satellite AIS (S-AIS) is the term used to describe when a satellite is used to detect AIS signatures. |
| Reusable launch vehicles (RLVs) | Reusable launch vehicle (RLV) means a launch vehicle that is designed to return to Earth substantially intact and therefore may be launched more than one time or that contains vehicle stages that may be recovered by a launch operator for future use in the operation of a substantially similar launch vehicle. |
| Apogee | The point in an elliptical satellite orbit which is farthest from the surface of the earth. Geosynchronous satellites which maintain circular orbits around the earth are first launched into highly elliptical orbits with apogees of 22,237 miles. |


Research Methodology
Mordor Intelligence follows a four-step methodology in all our reports.
- Step-1: Identify Key Variables: In order to build a robust forecasting methodology, the variables and factors identified in Step-1 are tested against available historical market numbers. Through an iterative process, the variables required for market forecast are set and the model is built on the basis of these variables.
- Step-2: Build a Market Model: Market-size estimations for the historical and forecast years have been provided in revenue and volume terms. For sales conversion to volume, the average selling price (ASP) is kept constant throughout the forecast period for each country, and inflation is not a part of the pricing.
- Step-3: Validate and Finalize: In this important step, all market numbers, variables and analyst calls are validated through an extensive network of primary research experts from the market studied. The respondents are selected across levels and functions to generate a holistic picture of the market studied.
- Step-4: Research Outputs: Syndicated Reports, Custom Consulting Assignments, Databases & Subscription Platforms.


