Market Overview
| Study Period | 2020 - 2031 |
|---|---|
| Forecast Data Period | 2026 - 2031 |
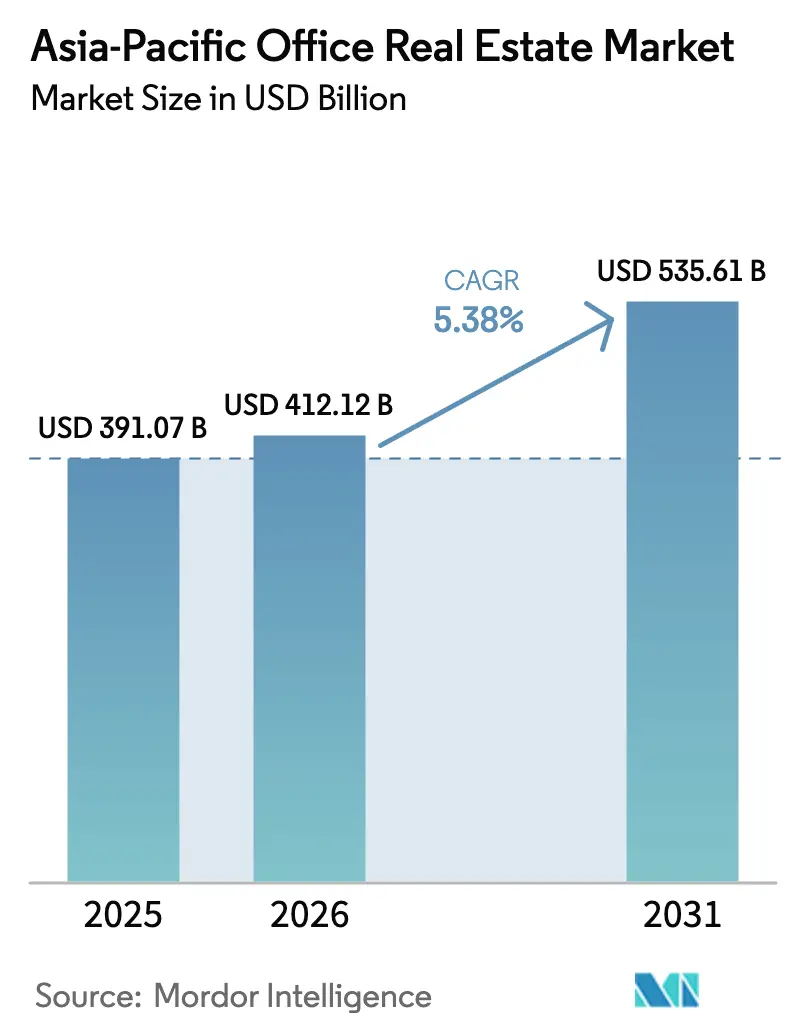
| Base Year Market Size (2025) | USD 391.07 Billion |
| Market Size (2026) | USD 412.12 Billion |
| Market Size (2031) | USD 535.61 Billion |
| Growth Rate (2026 - 2031) | 5.38% CAGR |
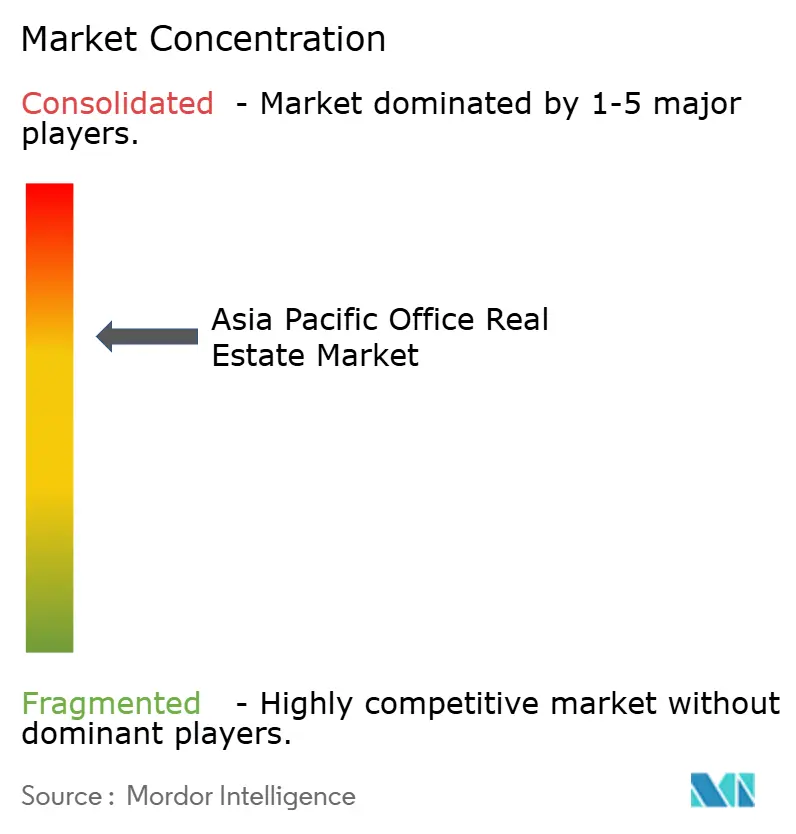
| Market Concentration | Medium |
Major Players *Disclaimer: Major Players sorted in no particular order Image © Mordor Intelligence. Reuse requires attribution under CC BY 4.0. | |
Asia-Pacific Office Real Estate Market Analysis by Mordor Intelligence
The Asia-Pacific Office Real Estate Market size is projected to expand from USD 391.07 billion in 2025 and USD 412.12 billion in 2026 to USD 535.61 billion by 2031, registering a CAGR of 5.38% between 2026 to 2031.
Growth is anchored in the region’s pivot toward knowledge-economy hubs, widespread adoption of sustainability-certified buildings, and a rental model that still accounts for more than three-quarters of transactional value. Green certification delivers consistent 1-4% rental premiums, encouraging landlords to prioritize WELL, LEED, and Green Mark ratings even as hybrid work keeps per-employee footprints at historically low levels. Institutional emphasis on Grade-A assets and asset-management technologies continues to compress yields in Singapore, Tokyo, and Sydney while offering wider spreads in Jakarta and Mumbai. Forward pipelines remain disciplined because construction-cost inflation in 2024 rose 6-15%, and policy-rate hikes in India, Australia, and Japan lifted borrowing costs for leveraged developers.
Key Report Takeaways
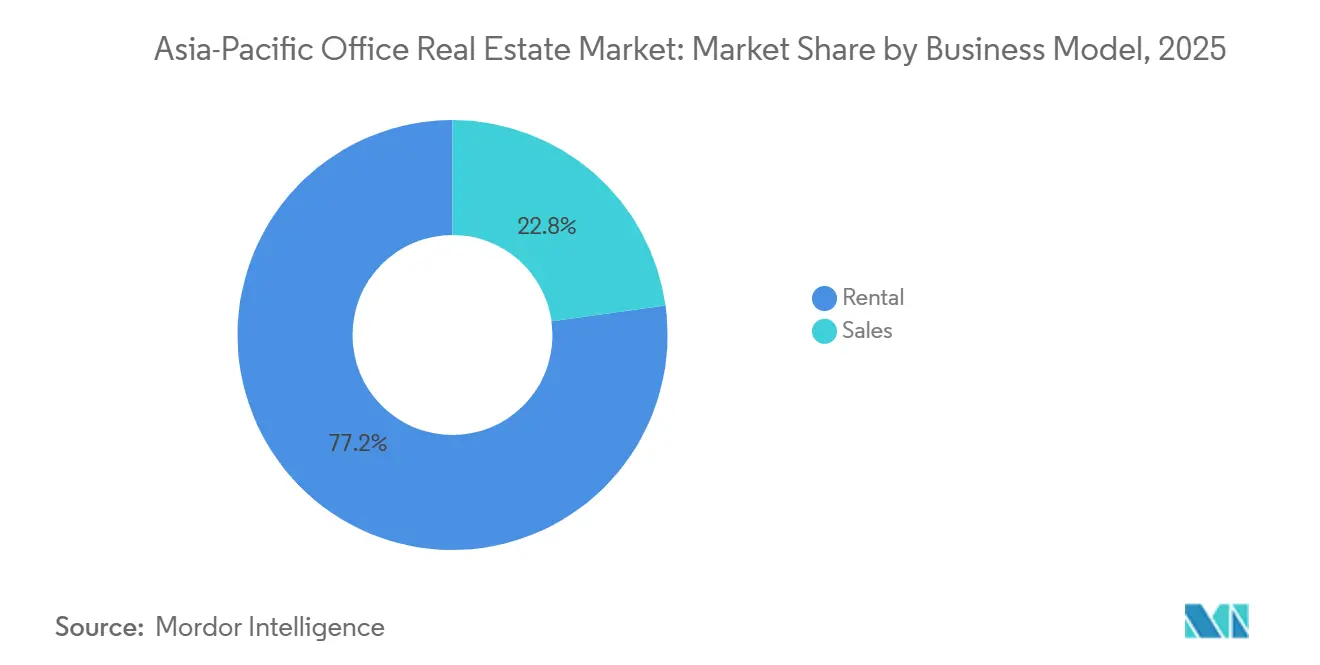
- By business model, rental commanded 77.2% of the 2025 value, while sales transactions are projected to expand the fastest at a 6.71% CAGR through 2031.
- By building grade, Grade-A stock held 64.1% of the 2025 value and is also the fastest-growing category at a 6.35% CAGR through 2031.
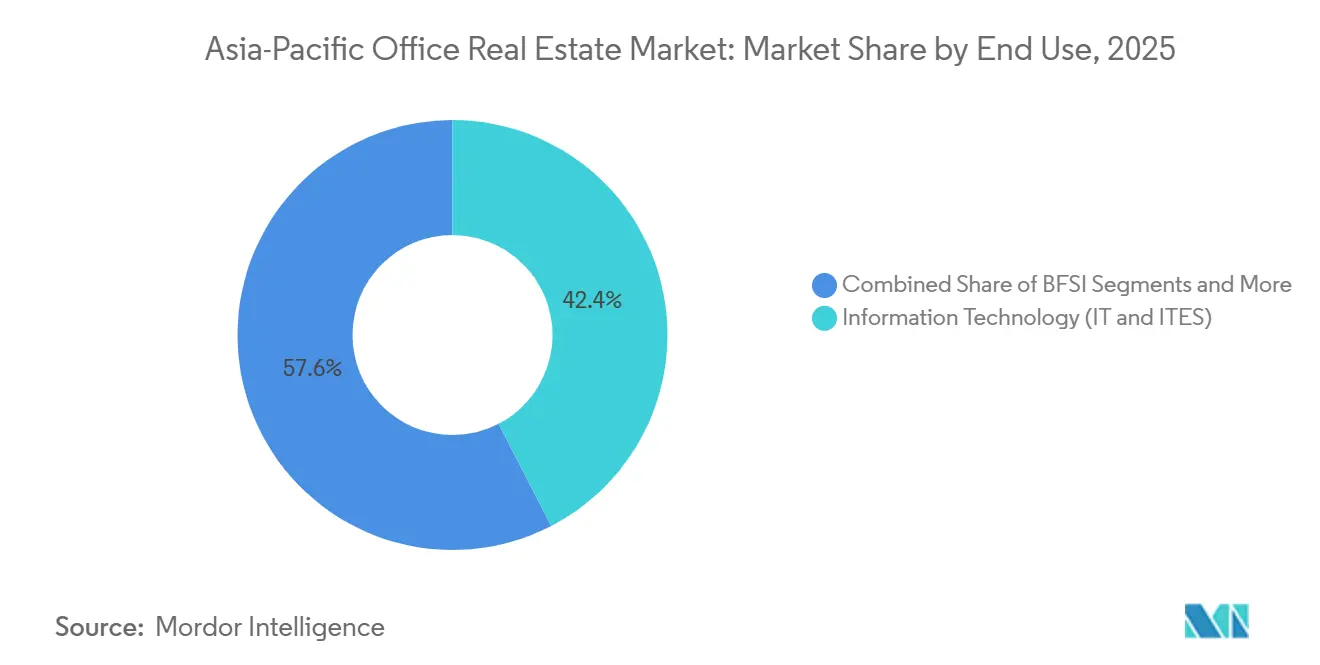
- By end use, IT and IT-enabled services accounted for 42.4% of 2025 demand, whereas life sciences led growth with a CAGR above 6.98% to 2031.
- By country, India captured 22.7% of regional value in 2025, while Indonesia records the steepest trajectory at a 7.29% CAGR through 2031.
Note: Market size and forecast figures in this report are generated using Mordor Intelligence’s proprietary estimation framework, updated with the latest available data and insights as of January 2026.
Asia-Pacific Office Real Estate Market Trends and Insights
Drivers Impact Analysis*
| Drivers | (~) % IMPACT ON CAGR FORECAST | Geographic Relevance | Impact Timeline |
|---|---|---|---|
| Tech, GCC, and life-sciences expansion in cost-advantaged markets | +1.5% | India, Vietnam, China coastal cities | Medium term (2-4 years) |
| Economic diversification and services growth in India and Southeast Asia sustaining net absorption | +1.2% | India (Bengaluru, Hyderabad, Pune), Indonesia, Vietnam, Philippines | Medium term (2-4 years) |
| Flight-to-quality and green premiums elevating Grade-A demand | +0.9% | Singapore, Tokyo, Sydney, Hong Kong | Medium term (2-4 years) |
| Flexible workspace models supporting hybrid operating patterns | +0.6% | Singapore, Hong Kong, Sydney, secondary India cities | Short term (≤2 years) |
| Data-led asset management improving operating margins | +0.4% | Singapore, Japan, Australia, China Tier-1 markets | Long term (≥4 years) |
| Source: Mordor Intelligence | |||
Economic Diversification and Services Growth In India And Southeast Asia: Sustaining Net Absorption
Global-capability centers added 1.9 million employees across Bengaluru, Hyderabad, and Pune in 2024, and state incentives such as Karnataka’s “Beyond Bengaluru” scheme continue to reduce stamp duty for compliant developers[1]Government of Karnataka, “Beyond Bengaluru Program,” karnataka.gov.in . Jakarta, Ho Chi Minh City, and Manila replicate this pattern with robust population growth and constrained Grade-A supply that keeps vacancy near single digits. Employers favor these metros for deep talent pools and tax perks, which together extend the demand runway well beyond 2028. Consequently, net absorption outpaces new completions in cost-advantaged corridors even while some Tier-1 Chinese submarkets struggle with oversupply. The dynamic signals durable occupier confidence despite the macro-rate environment.
Flight-To-Quality And Green Premiums Elevating Grade-A Demand
More than 51% of regional inventory carried a formal sustainability label in 2024 after Singapore required Green Mark certification for new projects above 5,000 m²[2]Building and Construction Authority, “Green Mark 2021 Framework,” bca.gov.sg . Tokyo and Hong Kong each report green penetration above 90%, and landlords command premiums that vary from 1 % in secondary nodes to 4 % in prime CBDs. For every five square feet of tenants' requests for fully certified assets, only two square feet are presently available, so occupiers lock in longer leases or pre-commit to projects under construction. Tight certified supply accelerates the obsolescence cycle for older buildings and incentivizes capital recycling into retrofit funds. As disclosure mandates tighten across Australia and Japan, green premiums are expected to widen, reinforcing the landlord flight-to-quality thesis.
Tech, GCC, And Life-Sciences Expansion in Cost-Advantaged Markets
Technology firms and captive centers absorbed 44% of India’s third-quarter 2024 leasing, led by million-square-foot campus deals from Cognizant, HCLTech, and Infosys. Microsoft, UBS, and Flutter each secured more than 500,000 ft² in Hyderabad and Bengaluru to capitalize on labor arbitrage and fiscal holidays. Life sciences demand in Hyderabad’s Genome Valley, Singapore’s Biopolis, and Shanghai’s Zhangjiang draws multinationals that need wet-lab infrastructure, pushing pre-let ratios above 60%. Mainland China shows a shift toward consolidated, hyper-efficient campuses driven by the country’s dual-carbon mandate, compressing footprints in secondary nodes. This sector mix raises average rents but introduces cyclical sensitivity to global tech hiring.
Flexible Workspace Models Supporting Hybrid Operating Patterns
Average lease tenor has dropped from 10 years before the pandemic to 3-5 years in 2024 as enterprises embed hybrid schedules. Landlords, therefore, align with operators such as WeWork through management contracts that transfer vacancy risk in exchange for revenue shares. Managed-office penetration reached 12% of Grade-A space in Singapore and Hong Kong by mid-2024, double the 2022 level, and activity-based layouts now allocate only 80-120 ft² per employee, making densification viable. Despite smaller footprints, 70% of firms still require staff to attend at least three days each week, so demand does not collapse; instead, it shifts to flexible floors within premium towers. Owners of traditional long-lease buildings lacking amenity depth face longer downtime between tenants.
Restraints Impact Analysis*
| Restraint | (~) % IMPACT ON CAGR FORECAST | Geographic Relevance | Impact Timeline |
|---|---|---|---|
| Elevated financing costs and construction inflation compressing supply economics | -1.1% | Australia, India, Indonesia, Japan | Medium term (2-4 years) |
| Hybrid work and densification reducing per-employee space needs | -0.8% | Australia, Japan, Singapore | Short term (≤2 years) |
| Oversupply and slow permitting for conversions in some CBDs | -0.6% | Guangzhou, Shenzhen, Melbourne | Long term (≥4 years) |
| Source: Mordor Intelligence | |||
Hybrid Work and Densification: Reducing Per-Employee Space Needs
Average allocations fell from 150-200 ft² per employee before 2020 to 100-150 ft² in 2024, a 33% contraction that immediately softens headline demand. Sydney and Melbourne report 30-40% vacancy in older towers as tenants retreat to fewer, amenity-rich floors. Survey data show peak occupancy above 80% in only 43% of monitored buildings, leaving structurally underused stock. Tokyo companies now average 1.3 staff per desk, letting occupiers surrender entire floors while maintaining headcount. Buildings without transit adjacency or wellness features suffer the sharpest occupancy erosion, pressuring rents and reducing asset liquidity.
Elevated Financing Costs and Construction Inflation Compressing Supply Economics
Construction-cost escalation reached 15% in Australia, 12% in India, and 8% in China during 2024, fueled by steel, cement, and labor price spikes. Meanwhile, benchmark policy rates hold at 6.5% in India, 4.35% in Australia, and 0.25% in Japan, increasing interest expense for new projects. Developers in Jakarta and Mumbai paused excavation while renegotiating loan covenants because capitalized yields no longer cleared hurdle rates. Retrofit ambitions are also cool, as payback periods for LEED Gold upgrades now exceed 10 years at prevailing finance costs unless green premiums widen further. Slower pipeline deliveries limit future supply but can delay market equilibrium.
*Our forecasts treat driver/restraint impacts as directional, not additive. The impact forecasts reflect baseline growth, mix effects, and variable interactions.
Segment Analysis
By Business Model: Rental Dominance Anchors Institutional Capital
Rental transactions captured 77.2% of 2025 turnover, confirming that the Asia-Pacific office real estate market prefers predictable, lease-backed cash flows. Institutional owners value 5-7-year average lease lengths in India and 3-5-year terms in Southeast Asia that mute near-term revenue volatility. REITs rebalanced USD 3.5 billion of portfolios in 2024, typified by Keppel REIT’s purchase of a 50% interest in Mumbai’s Pinnacle Office Park for SGD 239 million (USD 177 million)[3]Keppel REIT, “Acquisition of Pinnacle Office Park,” keppelreit.com . Sales transactions, only 22.8% by value, are nonetheless forecast to advance at a 6.71% CAGR, led by strata-title deals in Jakarta, where the Golden Indonesia visa encourages offshore ownership. Rental yields compress to 3.0-3.5% in Tokyo and 3.5-4.5% in Singapore, while Mumbai and Jakarta still trade near 8-9.5%, attracting yield-hungry foreign funds despite currency risk.
Core investors continue to chase stabilized portfolios, whereas value-add capital focuses on assets that can be repositioned for flexible workspace or upgraded to higher green certifications. The differential between Grade-A and Grade-B rents widens most in Singapore and Tokyo, encouraging developers to monetize completed buildings outright even as they retain management contracts. Over the forecast horizon, the Asia-Pacific office real estate market size for rental assets is projected to climb steadily, while the sales tranche benefits from opportunistic pricing in select metros.


By Building Grade: Grade-A Assets Command A Rising Premium
Grade-A stock accounted for 64.1% of the 2025 value and leads growth at a 6.35% CAGR through 2031. Green Mark, WELL, and LEED credentials underpin 1-4% rent premiums, and Singapore already requires such certification for every new building over 5,000 m². Tokyo’s Grade-A vacancy rate printed at only 3% in the third quarter of 2024, the tightest reading regionally. Older Grade-B and Grade-C assets confront rising vacancy, with Guangzhou and Shenzhen above 22% because retrofits cost USD 15-25 per ft² and repay slowly under current interest rates. Many owners re-scope these buildings into managed offices to capture hybrid demand or weigh demolition if conversion economics fail.
The Asia-Pacific office real estate market share of Grade-A stock will continue to expand as tenants chase certified, amenity-rich towers that support environmental targets. In contrast, Grade-C supply may shrink through adaptive reuse or removal, creating a two-tier market where obsolescence accelerates for non-compliant assets. Investors with green-ready pipelines, therefore, command pricing power across almost every CBD.
By End Use: IT & ITES Propel Current Absorption While Life Sciences Accelerate
IT and ITES users delivered 42.4% of 2025 take-up, an anchor segment that maintains a 6.98% CAGR through 2031. GCC operators such as HCLTech and Infosys each executed million-square-foot leases in Hyderabad or Bengaluru during 2024, reflecting structural labor cost advantages. Banking and insurance occupiers rationalize back-office space yet still consolidate flagship premises in Singapore, Hong Kong, and Tokyo, leading to steady Grade-A absorption. Life-sciences footprints, while smaller in absolute terms, expand fastest as drug makers lease wet-lab-enabled floors in Genome Valley, Biopolis, and Zhangjiang. This specialty demand pulls average rents higher and supports longer lease tenors of 8-10 years because fit-out investments are capital-intensive.
Retail and conventional energy companies represent a shrinking slice of demand, displaced by e-commerce growth and decarbonization policies. The mix shift toward knowledge-heavy occupiers elevates rental income resilience but increases exposure to tech employment cycles. Nonetheless, the Asia-Pacific office real estate market size linked to technology tenants remains fundamental to absorption in India and Southeast Asia.

Geography Analysis
India’s 22.7% slice of the Asia-Pacific office real estate market rests on large-scale GCC expansion supported by state concessions, deep STEM talent, and rental yields of 7.5-9.0% in Mumbai and Bengaluru. Construction-cost inflation of 8-12% squeezes margins, but pre-leasing in Pune and Chennai stays robust, indicating durable occupier appetite for modern campuses. Telangana’s T-Hub and Karnataka’s “Beyond Bengaluru” accelerate decentralization toward Tier-2 nodes where land costs remain 40-50% below Tier-1 benchmarks, broadening the investable universe.
Indonesia’s trajectory is defined by scarce supply and regulatory liberalization. Jakarta reports 7.4% Grade-A vacancy, the lowest among Southeast Asian capitals, which pushes rents to IDR 400,000-500,000 per m² monthly (USD 25-31 per m²). The Omnibus Law cut project licensing timelines in half, and the Golden Indonesia visa confers 5- to 10-year residency to investors who inject at least USD 350,000, channeling fresh capital into strata-title office floors. Developers such as Autograph Tower and Plaza Office Tower 2 target technology and finance tenants, while offshore REITs absorb stabilized assets priced at 8-9.5% yields.
China, Japan, South Korea, and Australia illustrate diverging fundamentals. Oversupply keeps Guangzhou and Shenzhen vacancy above 22%, and conversion hurdles delay adaptive-reuse rollouts. Tokyo remains undersupplied with only 3% vacancy and continues to attract blue-chip tenants despite Japan’s first rate hike in 17 years. Seoul’s 8.5% vacancy is moderate, with Gangnam rents supported by Samsung, LG, and Hyundai consolidations. In Australia, hybrid work leaves 30-40% vacancy in older CBD towers; however, assets within walking distance of new metro lines trade at meaningful premiums as institutional buyers pivot toward transit-oriented strategies.
Competitive Landscape
The Asia-Pacific office real estate market features moderate fragmentation, with global advisories - JLL, CBRE, Cushman & Wakefield, Colliers, Knight Frank, and Savills - competing for brokerage and consulting mandates. JLL deepened PropTech capabilities in 2024 by acquiring a Mumbai-based software integrator that supplies tenant-experience and energy-dashboard solutions. CBRE simultaneously launched a region-wide ESG advisory, guiding occupiers through carbon-reduction roadmaps and green certifications. Cushman & Wakefield partnered with WeWork to operate enterprise-grade flexible suites in Singapore, Hong Kong, and Tokyo, diversifying landlord revenue streams.
Developers cluster into two strategic camps. CapitaLand, DLF, and Keppel REIT execute build-to-core plays—constructing Grade-A towers, leasing them to stabilization, and holding them for income. Mitsubishi Estate, Henderson Land, and China Resources Land focus on prime CBD redevelopment, integrating retail and residential components to capture mixed-use premiums. REITs rebalanced USD 3.5 billion of holdings in 2024, selling suburban assets to fund CBD acquisitions in Mumbai, Singapore, and Tokyo, reinforcing the flight-to-quality narrative.
Whitespace opportunities gravitate toward Tier-2 Indian cities, supply-constrained Southeast Asian capitals, and retrofit programs in Chinese CBDs if permitting relaxes. PropTech disruptors providing occupancy analytics, predictive maintenance, and tenant-engagement apps consistently cut operating expense ratios by up to 200 basis points, a gap that investors increasingly monetize. Regulation also shapes competition: Singapore’s tightened Green Mark rules and China’s dual-carbon timetable favor landlords with certified portfolios and embedded smart-building infrastructure, while owners of outdated stock face costly upgrades or accelerated depreciation.
Asia-Pacific Office Real Estate Industry Leaders
JLL
CBRE
Cushman & Wakefield
Colliers
Knight Frank
- *Disclaimer: Major Players sorted in no particular order

Recent Industry Developments
- June 2025: CBRE, the world’s largest commercial real estate services and investment firm, announced the expansion of its advisory services business to Indonesia and leadership appointments in the country.
- November 2024: CapitaLand Ascendas REIT bought three Singapore business parks for SGD 1.93 billion (USD 1.43 billion).
- October 2024: DLF started Downtown Gurugram Phase 5, a 1.8-million-ft² Grade-A campus, with 40% space pre-leased to two Fortune 500 firms.
- December 2024: Keppel REIT acquired a 50% interest in Pinnacle Office Park, Mumbai, for SGD 239 million (USD 177 million), marking its entry into India.


Asia-Pacific Office Real Estate Market Report Scope
Office real estate is the construction of buildings for leasing and selling purposes to companies from different sectors. This report aims to provide a detailed analysis of the office real estate market. It focuses on the office real estate sector's market insights, dynamics, technological trends, and government initiatives. The Asia-Pacific Office Real Estate Market is Segmented by Geography (China, Japan, India, Australia, South Korea, and the Rest of APAC). The report offers market size and forecasts for the Asia-Pacific Office Real Estate Market in value (USD billion) for all the above segments.
By Business Model
| Sales |
| Rental |
| By Business Model | Sales |
| Rental |


Key Questions Answered in the Report
How is hybrid work reshaping leasing strategy in Asia-Pacific?
The market is valued at USD 412.12 billion in 2026 and is projected to reach USD 535.61 billion by 2031.
How fast is Grade-A inventory growing across the region?
Grade-A stock is expanding at a 6.35% CAGR as occupiers target certified, energy-efficient buildings.
Which country offers the highest rental yields for premium office assets?
Jakarta and Mumbai provide 8-9.5% gross yields, outperforming Singapore and Tokyo where yields hover below 4%.
Why are green building certifications important for landlords?
Certified buildings achieve 1-4% rental premiums and higher tenant-retention rates, offsetting upfront retrofit costs.
How is hybrid work reshaping leasing strategy in Asia-Pacific?
Enterprises shorten lease terms to 3-5 years and favor flexible suites, prompting landlords to partner with workspace operators.
Where are investors finding the fastest growth opportunities?
Indonesia leads with a 7.29% CAGR, while Tier-2 Indian cities attract capital through state incentives and strong GCC demand.
Page last updated on:


