Market Overview
| Study Period | 2020 - 2031 |
|---|---|
| Forecast Data Period | 2026 - 2031 |
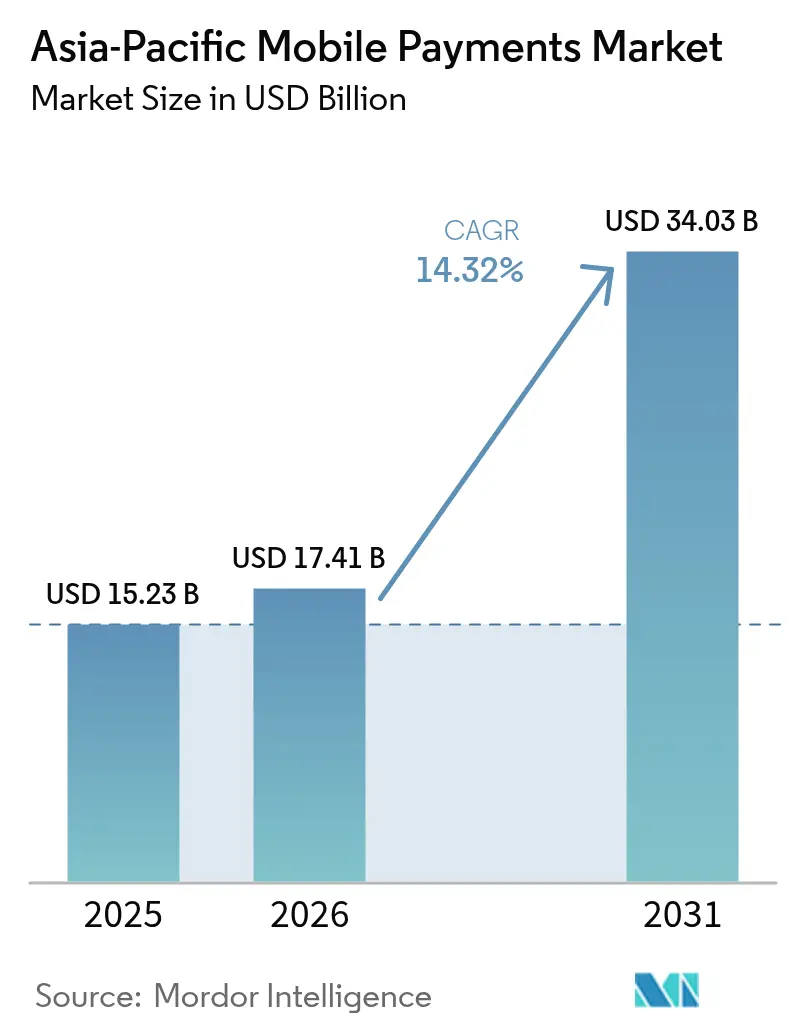
| Base Year Market Size (2025) | USD 15.23 Billion |
| Market Size (2026) | USD 17.41 Billion |
| Market Size (2031) | USD 34.03 Billion |
| Growth Rate (2026 - 2031) | 14.32% CAGR |
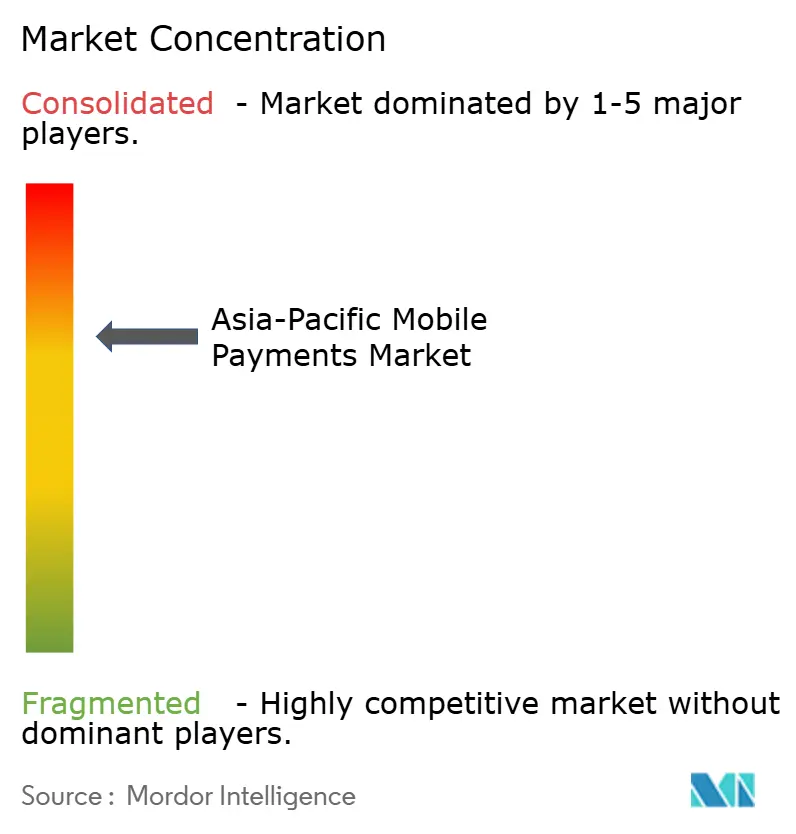
| Market Concentration | Medium |
Major Players *Disclaimer: Major Players sorted in no particular order Image © Mordor Intelligence. Reuse requires attribution under CC BY 4.0. | |
Asia-Pacific Mobile Payments Market Analysis by Mordor Intelligence
The Asia-Pacific mobile payments market size in 2026 is estimated at USD 17.41 billion, growing from 2025 value of USD 15.23 billion with 2031 projections showing USD 34.03 billion, growing at 14.32% CAGR over 2026-2031. Surging smartphone penetration, mandatory digital-payments infrastructure, and super-app ecosystems that embed commerce, logistics, and finance are amplifying wallet adoption across 2.3 billion consumers and 60 million merchants. Governments are compressing adoption cycles through zero-interchange regimes and unified QR standards, while central-bank digital-currency pilots such as the e-CNY move from sandbox to scale. Competition is intensifying as telecom-backed wallets, neobanks, and card networks race to own daily spend, prompting alliances focused on cross-border settlement, loyalty integration, and real-time risk scoring. Regulatory divergence on data localization and open-banking APIs will determine whether the region converges on seamless rails or remains a patchwork of bilateral links.
Key Report Takeaways
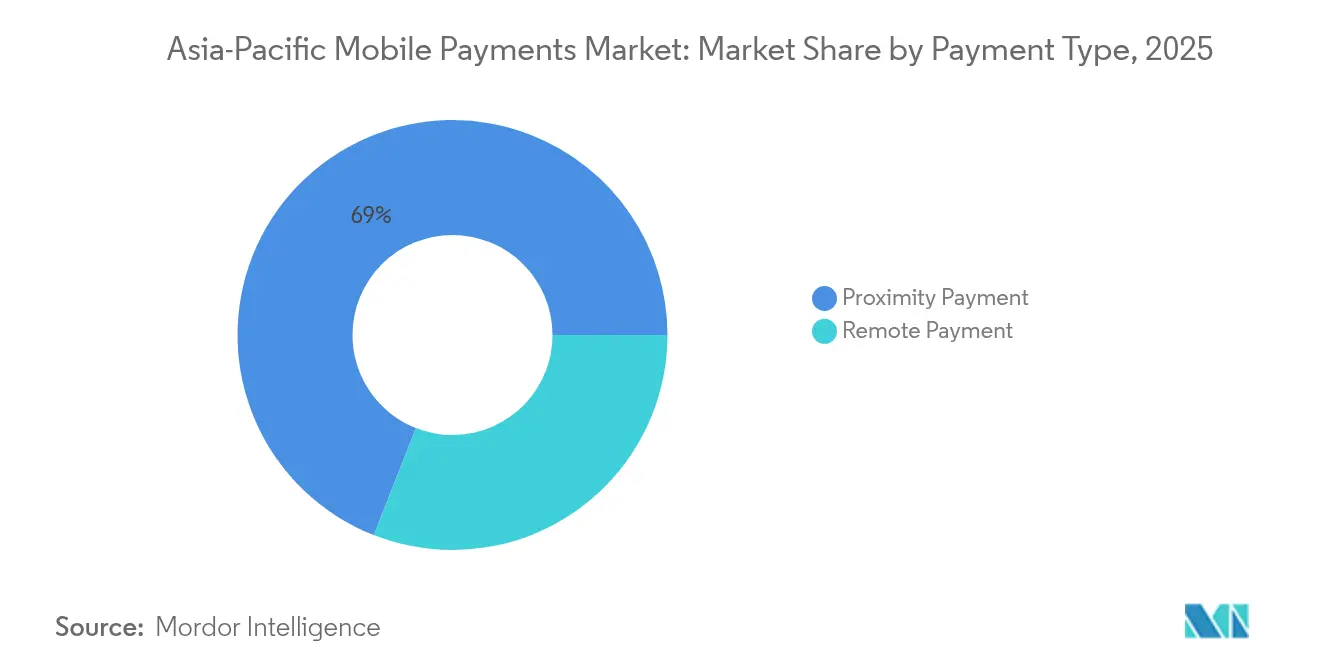
- By payment type, proximity payments led with a 69.04% Asia-Pacific mobile payments market share in 2025, whereas remote payments are on track to grow at a 15.52% CAGR through 2031.
- By payment mode, QR-code transactions commanded 44.21% of volume in 2025 and are forecast to expand at a 15.18% CAGR, easily outpacing NFC.
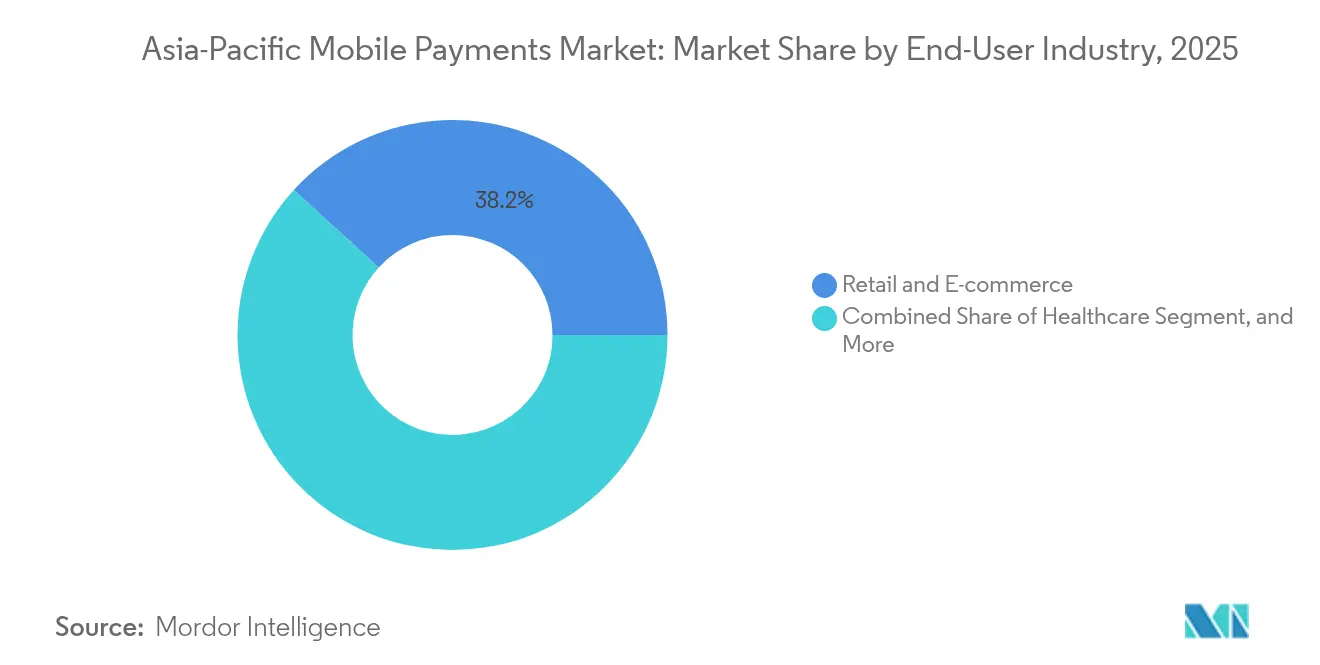
- By end-user industry, retail and e-commerce captured 38.21% of spend in 2025, while healthcare is advancing at a 15.06% CAGR and is the fastest-growing vertical.
- By transaction value, small-ticket purchases between USD 10 and USD 50 accounted for 41.27% of volume in 2025; micro-payments below USD 10 are poised for a 15.12% CAGR.
Note: Market size and forecast figures in this report are generated using Mordor Intelligence’s proprietary estimation framework, updated with the latest available data and insights as of 2026.
Asia-Pacific Mobile Payments Market Trends and Insights
Drivers Impact Analysis*
| Driver | (~) % Impact on CAGR Forecast | Geographic Relevance | Impact Timeline |
|---|---|---|---|
| Surge in smartphone and internet penetration | +2.5% | Asia-Pacific-wide, with highest impact in India, Indonesia, Philippines, Vietnam, Bangladesh | Medium term (2-4 years) |
| Government-led cashless initiatives | +3.2% | India (UPI mandate), China (e-CNY rollout), Singapore (SGQR), Thailand (PromptPay), Malaysia (DuitNow) | Short term (≤ 2 years) |
| Rapid expansion of e-commerce and super-apps | +2.8% | Southeast Asia (Indonesia, Vietnam, Philippines, Thailand), India, with spillover to China's lower-tier cities | Medium term (2-4 years) |
| Favourable fintech regulations and open banking | +2.1% | Singapore (SGFIN), India (Account Aggregator), Australia (Consumer Data Right), Japan (Payment Services Act revisions) | Long term (≥ 4 years) |
| Offline QR-code standardization for micro-merchants | +1.6% | India (Bharat QR), Singapore (SGQR), Indonesia (QRIS), Thailand (Thai QR), China (Alipay/WeChat offline protocols) | Medium term (2-4 years) |
| CBDC pilots integrating with mobile wallets | +1.4% | China (e-CNY integration with Alipay/WeChat Pay), India (digital rupee pilots), Thailand (retail CBDC trials), Singapore (Project Orchid) | Long term (≥ 4 years) |
| Source: Mordor Intelligence | |||
Surge in Smartphone and Internet Penetration
It is estimated that more than 600 million smartphone shipments will occur across the region in 2024, and sub-USD 150 models will comprise a notable share of sales in India, Indonesia, and Vietnam, widening wallet access for informal-sector workers. Mobile broadband coverage reached 78%, while India’s Bharat Net linked 250,000 village councils, bringing 400 million previously unbanked citizens online.[1]Department of Telecommunications, “Bharat Net Progress,” dot.gov.in Rapid 5G rollouts cut QR-scanning latency, and manufacturers such as Xiaomi, Oppo, and Samsung preload starter wallets with cash-back, converting first-time smartphone buyers to mobile payments within 90 days. As tier-2 and tier-3 cities receive affordable data plans, the addressable base for the Asia-Pacific mobile payments market widens, reinforcing network effects for super-apps.
Government-Led Cashless Initiatives
India’s Unified Payments Interface processed 100 billion transactions in 2024, a ten-fold jump from 2020, underpinned by zero merchant-discount rates and mandatory interoperability. China’s e-CNY pilot has expanded to 26 cities and incorporated offline NFC chips into SIM cards to ensure continuity during disasters.[2]People’s Bank of China, “Digital Yuan Pilot Program Report,” pbc.gov.cn Singapore’s SGQR merged 27 schemes into one code across 300,000 merchants and linked with India and Thailand for fee-free remittances.[3]Monetary Authority of Singapore, “SGQR Framework,” mas.gov.sg Thailand required PromptPay enrollment for subsidy recipients, routing 12 billion baht digitally in 2024. These top-down mandates accelerate behavioral change and compress multi-year adoption curves into quarters.
Rapid Expansion of E-Commerce and Super-Apps
Gross merchandise value in Southeast Asia climbed to USD 186 billion in 2024, with 68% of checkouts settled inside wallets rather than through cards or cash. GrabPay processed USD 22 billion across eight countries by cross-selling micro-loans and insurance to ride-hailing and food-delivery users. Alipay+ now connects 30 wallets, enabling tourists to pay at 90 million overseas merchants without FX conversion, while local users can shop from Chinese sellers seamlessly. The super-app flywheel combines payments, commerce, and logistics into a single interface, increasing switching costs and consolidating market share on scaled platforms.
Favourable Fintech Regulations and Open Banking
India’s Account Aggregator model allows consent-driven data sharing among 150 regulated entities, unlocking nano-credit for gig workers. Singapore’s SGFIN API forces banks to expose payment-initiation rails, lowering acquisition costs for neobanks. Australia extended its Consumer Data Right to payments, permitting third-party apps to trigger instant transfers from any account. Japan raised prepaid wallet caps to JPY 500,000, letting PayPay compete with banks for salary deposits. Together these reforms erode incumbents’ moat and fuel innovation in the Asia-Pacific mobile payments market.
Restraints Impact Analysis*
| Restraint | (~) % Impact on CAGR Forecast | Geographic Relevance | Impact Timeline |
|---|---|---|---|
| Payment fraud and data-breach concerns | -1.8% | Asia-Pacific-wide, with highest losses in India, Philippines, Indonesia, Vietnam | Short term (≤ 2 years) |
| Interoperability across fragmented rails | -1.2% | Southeast Asia (Indonesia, Malaysia, Thailand, Vietnam, Philippines), cross-border corridors between ASEAN nations | Medium term (2-4 years) |
| Interchange fee caps squeezing PSP margins | -0.9% | India (zero-MDR on UPI), Thailand (0.5% cap), Malaysia, with spillover to other ASEAN markets | Medium term (2-4 years) |
| NFC battery-drain and latency on low-end devices | -0.6% | India, Indonesia, Vietnam, Philippines, Bangladesh, markets where sub-USD 150 smartphones dominate | Long term (≥ 4 years) |
| Source: Mordor Intelligence | |||
Payment Fraud and Data-Breach Concerns
Consumers across the region lost USD 1.8 billion to payment fraud in 2024, with authorized push-payment scams and SIM-swap attacks comprising 54% of losses. India logged 1.35 million fraud complaints in the first half of 2024, spurring the central bank to require real-time velocity checks for UPI apps. The Philippines recorded a 38% rise in phishing incidents against GCash users, prompting tighter wallet KYC thresholds. Synthetic-identity schemes are rising as criminals blend genuine and fake credentials to open wallets, straining biometric databases. Platforms have responded with behavioral biometrics, device fingerprinting, and federated threat-intelligence feeds, yet the cost of defense is rising faster than fee revenue.
Interoperability Across Fragmented Rails
Despite UPI–PayNow and UPI–PromptPay links, most payment systems remain siloed, forcing small merchants to juggle up to seven QR codes. Singapore’s SGQR harmonized domestic schemes but lacks seamless cross-border wallet-to-wallet transfers without banking intermediaries. Indonesia’s QRIS covers 22 million merchants but does not yet clear in real time with Malaysia’s DuitNow or Thailand’s PromptPay. China’s UnionPay and Japan’s J-Debit run proprietary rails outside the ISO 20022 standard, complicating ASEAN’s connectivity program. Zero-MDR policies in India and Thailand dampen revenue incentives for building shared infrastructure, slowing progress toward a unified Asia-Pacific mobile payments market.
*Our forecasts treat driver/restraint impacts as directional, not additive. The impact forecasts reflect baseline growth, mix effects, and variable interactions.
Segment Analysis
By Payment Type: Proximity Dominates, Remote Surges
Proximity payments controlled 69.04% of the Asia-Pacific mobile payments market in 2025, reflecting entrenched habits of scanning QR stickers at grocery stores, transit gates, and quick-service outlets. Remote payments processed in-app, for bill pay and peer-to-peer transfers, are growing faster at a 15.52% CAGR, helped by deeper e-commerce penetration and mini-program checkouts that remove browser redirects. India’s UPI recorded 8.2 billion remote transactions in November 2024 alone, and WeChat Pay processes over 90% of China’s remote spend through embedded mini-programs. As merchants adopt purchase-protection policies and instant refunds, consumer trust in remote channels is rising.
Remote volume will catch up quickly as super-apps place one-tap pay buttons inside ride-hailing, food-delivery, and streaming screens. Japan’s PayPay introduced a remote-payment API in 2024 that allows marketplaces to debit wallets without redirecting users, trimming checkout time by 40%. Meanwhile, proximity adoption continues where cash-heavy micro-merchants accept static QR codes offline. The convergence of offline and online acceptance, along with tokenized card-on-file standards, positions remote flows to match proximity by value before 2031, underpinning the overall expansion of the Asia-Pacific mobile payments market.


By Payment Mode: QR Codes Lead, Wallets Diversify
QR-code transactions contributed 44.21% to the Asia-Pacific mobile payments market size in 2025 and are expected to advance at a 15.18% CAGR through 2031, driven by the zero hardware outlay for merchants and the capability to operate offline during network outages. Singapore’s SGQR and India’s Bharat QR demonstrate how unified standards compress onboarding costs and spur acceptance. NFC remains strong in Japan and South Korea but is less attractive in price-sensitive markets where sub-USD 150 smartphones lack chips or where battery drain deters always-on radios.
In-app wallets, such as Paytm, PhonePe, GrabPay, and GoPay, now bundle credit, insurance, and investment services, leveraging transaction data to underwrite nano-loans. Carrier billing has slipped below an 8% share as smartphone use tops 80% in urban areas. The blurring of payments and credit, exemplified by Grab’s PayLater and Paytm Postpaid, creates supervisory challenges for central banks that are still finalizing buy-now-pay-later rules.
By End-User Industry: Retail Leads, Healthcare Accelerates
Retail and e-commerce claimed 38.21% of Asia-Pacific mobile payments market share in 2025, fueled by on-invoice discounts, loyalty points, and instant refunds that make wallets stickier than cards. Grocery, fashion, and quick-commerce platforms use wallet subsidies to boost daily active users and repeat purchase rates.
Healthcare, expanding at a 15.06% CAGR, is the fastest-growing vertical as telemedicine portals integrate wallet copay, digital prescriptions, and insurance settlement. India’s Ayushman Bharat Digital Mission enrolled 400 million citizens, letting them pay clinics via UPI and receive subsidies instantly. In China, 3,000 hospitals now accept WeChat Pay for appointments and prescription refills, cutting admin overhead by 30%. Governments’ push to seed digital health-wallet IDs will keep healthcare ahead of entertainment, BFSI, and government services in incremental value added through 2031.
By Transaction Value Range: Small Tickets Prevail, Micro Surges
Transactions between USD 10 and USD 50 represented 41.27% of 2025 volume, covering groceries, fuel, and quick-service meals. Micro-payments under USD 10 are set for a 15.12% CAGR as street vendors, transit systems, and utility micropay protocols go live on UPI Lite and WeChat dual-offline features.
UPI Lite authorizes payments up to INR 500 (USD 6) without PINs, completing in under three seconds. China’s digital yuan uses token exchanges between offline devices, essential for rural areas or during disasters. While large-ticket flows above USD 200 remain just 18% of volume, heightened fraud risk keeps additional biometric checks in place, extending checkout friction and capping growth.
Geography Analysis
China and India generate more than 70% of regional volume yet embody contrasting governance philosophies. In China, Alipay and WeChat Pay integrate the e-CNY pilot, which processed CNY 1.8 trillion by mid-2024, while new data-localization rules restrict Ant Group’s cross-border flows. The mBridge corridor now links mainland rails with Hong Kong, Thailand, and the UAE, positioning e-CNY for trade invoicing. India’s UPI handled 16.73 billion monthly transactions by late 2024 and is exporting its stack to Singapore, Thailand, and the UAE, enabling fee-free remittances without correspondent banks. Zero-MDR pricing, however, compresses PSP margins, pushing PhonePe and Paytm toward merchant lending and data analytics.
Japan’s PayPay crossed 65 million users by pairing cashback with the My Number digital-ID system, attracting salary deposits and tax refunds. The Financial Services Agency lifted prepaid wallet caps to JPY 500,000, empowering wallets to rival bank accounts. South Korea’s Kakao Pay cleared KRW 120 trillion (USD 90 billion) in 2024 and has ventured into securities and crypto custody. Both markets are mature, so providers seek outbound tourism and B2B opportunities for incremental growth in the Asia-Pacific mobile payments market.
Southeast Asia remains a battleground of super-apps. GrabPay, GoPay, and ShopeePay compete on cashback, gaming, and micro-insurance to lock users into closed loops. The Philippines’ GCash hit 90 million users in 2024 and now anchors government disbursements, while stricter KYC aims to curb phishing. Thailand’s PromptPay distributed 12 billion baht in state subsidies and is piloting retail CBDC fusion. Malaysia’s DuitNow and Singapore’s PayNow became interoperable in 2024, aiding the 1.5 million cross-border workers. Indonesia’s QRIS standardized 22 million merchant codes but still lacks real-time settlement with neighbors, limiting cross-border commerce BI.GO.ID. Australia’s market is shaped by buy-now-pay-later rules; fee caps on Afterpay and Zip erode margins, triggering consolidation.
Competitive Landscape
The Asia-Pacific mobile payments market remains concentrated in China but fragmented elsewhere. Alipay and WeChat Pay hold a combined 92% share domestically, yet Ant Group’s forced restructuring cut cross-selling synergies and opened doors for regional challengers. Tencent monetizes its 1.3 billion social-media users through mini-programs and offline QR acceptance, but faces thin margins as ASEAN jurisdictions adopt interchange caps. In India, PhonePe owns 48% of UPI transactions, Google Pay 37%, and Paytm pivots toward merchant soundboxes and credit after regulatory scrutiny.
Scale advantages favor super-apps that bundle finance, commerce, and logistics. GrabPay processed USD 22 billion in 2024 across eight markets, and its PayLater product now spans ticketing and food delivery. Mastercard and Visa focus on real-time cross-border corridors, partnering with fintechs for single-API access to local methods. Neobanks such as Wise and Revolut attract expatriate workers with low-FX wallets, while blockchain stablecoins test low-cost remittances.
Technology differentiation pivots on AI-driven fraud mitigation and offline protocols. BioCatch’s behavioral biometrics reduce false positives by 60% and are being embedded in leading wallets. Offline dual-token systems, pivotal for disaster resilience, become procurement criteria for regulators in cyclone-prone nations. Compliance with PCI-DSS, ISO 20022, and local data-sovereignty rules remains non-negotiable; non-compliant operators risk license suspension, as evidenced by India’s 2024 purge of unlicensed wallets.
Asia-Pacific Mobile Payments Industry Leaders
Google LLC
Amazon.com Inc.
Paypal Inc.
Mastercard Inc.
Samsung Electronics Co., Ltd.
- *Disclaimer: Major Players sorted in no particular order

Recent Industry Developments
- September 2025: Indonesia’s Financial Services Authority granted Grab-backed PT Bank Fama a digital-bank license, enabling GrabPay to issue multi-currency wallets and micro-loans nationwide
- June 2025: The People’s Bank of China allowed WeChat Pay to offer full e-CNY settlement for inbound tourists in Hong Kong, removing the need for mainland bank accounts
- April 2025: The Bank of Thailand and Bank Negara Malaysia activated real-time cross-border QR payments between PromptPay and DuitNow, covering 1.2 million merchants across both countries
- February 2025: National Payments Corporation of India rolled out “UPI Tap,” an NFC-based enhancement that enables offline proximity transactions at more than 12 million Bharat QR merchants


Asia-Pacific Mobile Payments Market Report Scope
The Asia-Pacific mobile payments market report is segmented by Payment Type (Proximity Payment, and Remote Payment), Payment Mode (NFC Payments, QR-Code Payments, Carrier Billing/SMS, In-App Wallets), End-User Industry (BFSI, Retail and E-commerce, Transportation and Logistics, Healthcare, Government, Media and Entertainment, IT and Telecommunications, Other End-User Industries), Transaction Value Range (Micro, Small, Medium, Large), and Geography (China, India, Japan, South Korea, Philippines, Vietnam, Malaysia, Australia, Indonesia, Thailand, Singapore, Rest of Asia-Pacific). The Market Forecasts are Provided in Terms of Value (USD).
By Payment Type
| Proximity Payment |
| Remote Payment |
By Payment Mode
| NFC Payments |
| QR-Code Payments |
| Carrier Billing / SMS |
| In-App Wallets |
By End-User Industry
| BFSI |
| Retail and E-commerce |
| Transportation and Logistics |
| Healthcare |
| Government |
| Media and Entertainment |
| IT and Telecommunications |
| Other End-User Industries |
By Transaction Value Range
| Micro (Below USD 10) |
| Small (USD 10–50) |
| Medium (USD 50–200) |
| Large (Above USD 200) |
By Geography
| China |
| India |
| Japan |
| South Korea |
| Philippines |
| Vietnam |
| Malaysia |
| Australia |
| Indonesia |
| Thailand |
| Singapore |
| Rest of Asia-Pacific |
| By Payment Type | Proximity Payment |
| Remote Payment | |
| By Payment Mode | NFC Payments |
| QR-Code Payments | |
| Carrier Billing / SMS | |
| In-App Wallets | |
| By End-User Industry | BFSI |
| Retail and E-commerce | |
| Transportation and Logistics | |
| Healthcare | |
| Government | |
| Media and Entertainment | |
| IT and Telecommunications | |
| Other End-User Industries | |
| By Transaction Value Range | Micro (Below USD 10) |
| Small (USD 10–50) | |
| Medium (USD 50–200) | |
| Large (Above USD 200) | |
| By Geography | China |
| India | |
| Japan | |
| South Korea | |
| Philippines | |
| Vietnam | |
| Malaysia | |
| Australia | |
| Indonesia | |
| Thailand | |
| Singapore | |
| Rest of Asia-Pacific |


Key Questions Answered in the Report
What is the current size of the Asia Pacific mobile payments market?
It stood at USD 17.41 billion in 2026 and is set to reach USD 34.03 billion by 2031.
Which payment mode grows fastest in Asia Pacific wallets?
QR-code payments are expanding at a 15.18% CAGR on the back of low hardware costs and offline capability.
How big is India’s contribution to regional mobile payments?
India’s UPI handled 16.73 billion transactions monthly by late 2024, giving the country a sizable share of regional volume.
Why is healthcare seeing rapid wallet adoption?
Telemedicine, digital insurance claims, and subsidy disbursements are pushing healthcare payments up at a 15.06% CAGR.
What fuels the rise of micro-payments under USD 10?
UPI Lite and dual-offline QR protocols let street vendors and transit systems accept low-value digital payments instantly.
Page last updated on:


