Radiation Dose Management Market Size and Share
Market Overview
| Study Period | 2020 - 2031 |
|---|---|
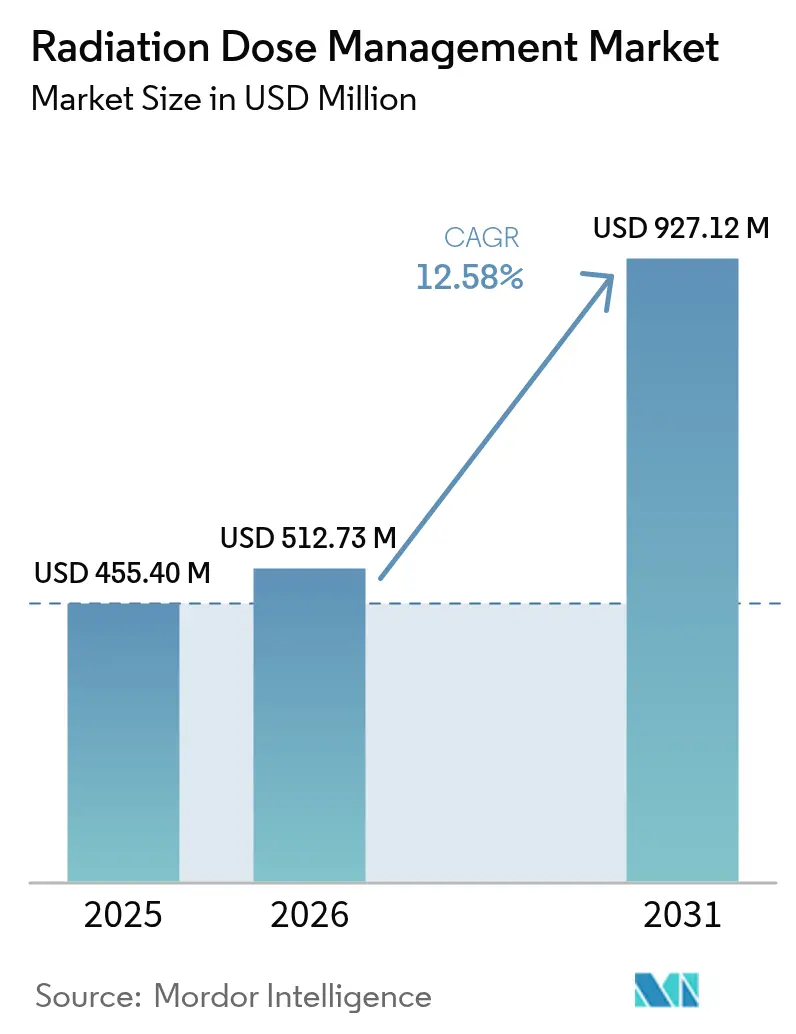
| Market Size (2026) | USD 512.73 Million |
| Market Size (2031) | USD 927.12 Million |
| Growth Rate (2026 - 2031) | 12.58% CAGR |
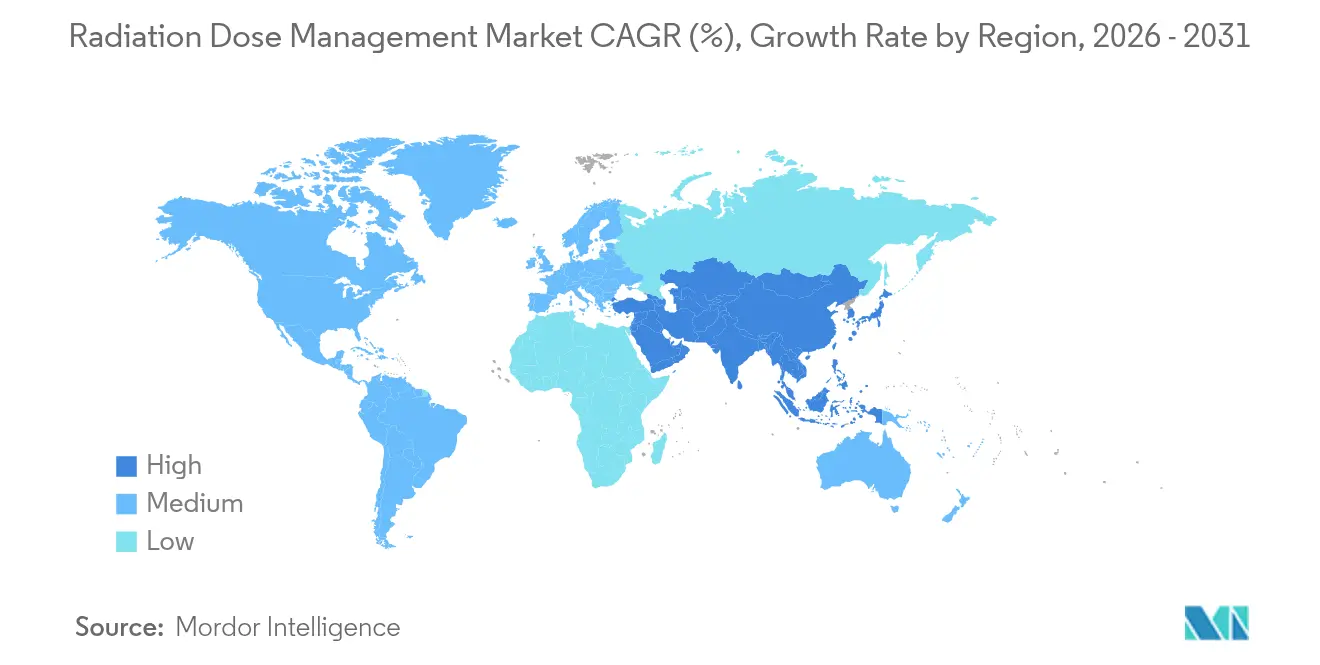
| Fastest Growing Market | Asia Pacific |
| Largest Market | North America |
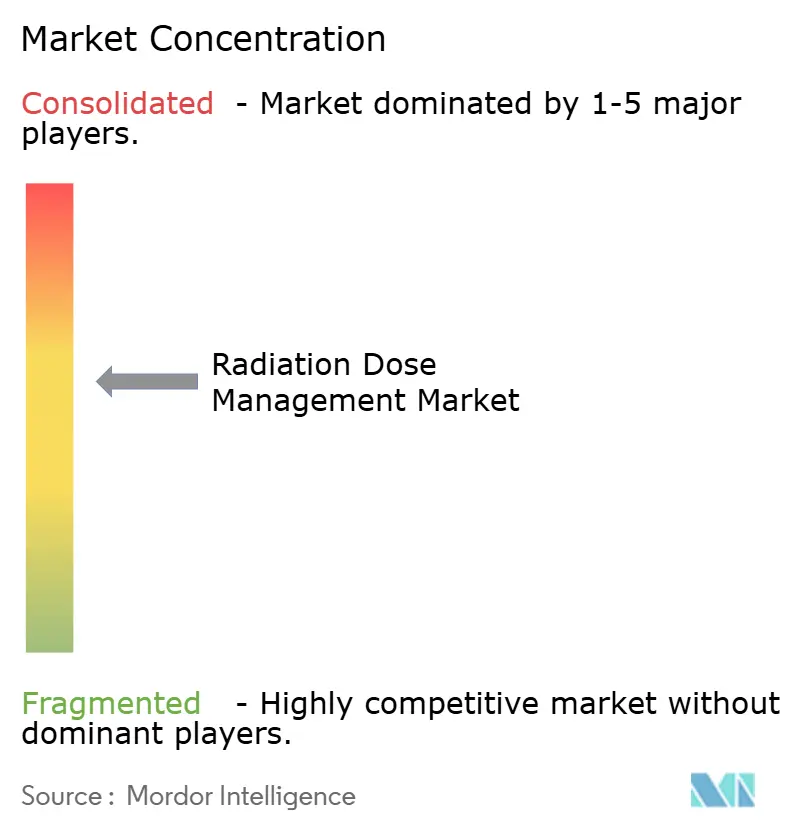
| Market Concentration | Medium |
Major Players *Disclaimer: Major Players sorted in no particular order Image © Mordor Intelligence. Reuse requires attribution under CC BY 4.0. | |
Radiation Dose Management Market Analysis by Mordor Intelligence
The radiation dose management market size is expected to grow from USD 455.40 million in 2025 to USD 512.73 million in 2026 and is forecast to reach USD 927.12 million by 2031 at 12.58% CAGR over 2026-2031. Growth rests on tighter radiation-safety regulations, the rapid shift to precision imaging in oncology, and the maturing of AI-based dose-optimization tools. Hospitals now treat compliance as a board-level priority because new diagnostic reference level mandates carry financial penalties, while CT and hybrid-imaging volumes keep rising in cancer care. Cloud analytics lower ownership costs for resource-constrained facilities, and integrated platforms replace point solutions as health systems seek seamless workflows. Competition intensifies as imaging OEMs bundle dose-tracking into existing equipment and pure-play vendors highlight AI capabilities, creating a landscape in which interoperability and real-time analytics sway purchasing decisions.
Key Report Takeaways
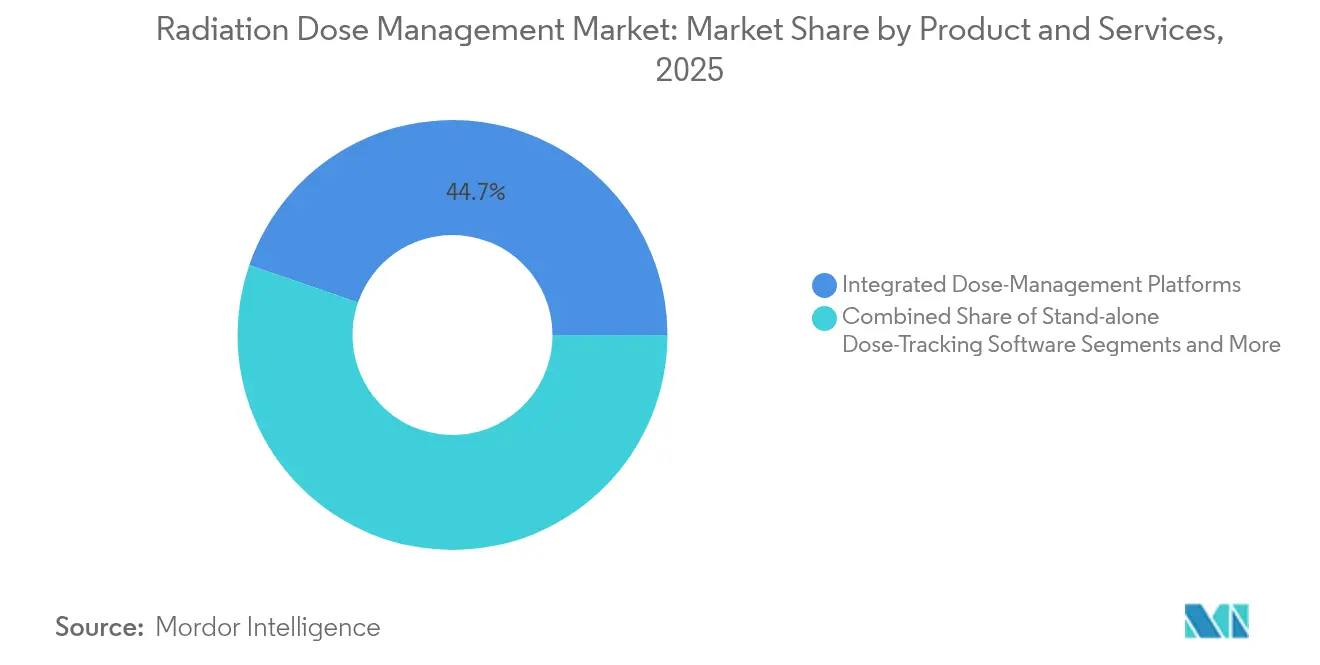
- By products & services, integrated dose-management platforms led with 44.72% radiation dose management market share in 2025 and are advancing at a 16.47% CAGR through 2031.
- By deployment mode, on-premise installations retained 58.88% share in 2025, while cloud and web-hosted solutions post the fastest 16.12% CAGR to 2031.
- By modality, computed tomography accounted for 39.55% of the radiation dose management market size in 2025, whereas nuclear medicine and PET-CT are forecast to expand at a 15.78% CAGR.
- By application, oncology captured 50.28% share of the radiation dose management market size in 2025; cardiology is projected to register the highest 13.74% CAGR through 2031.
- By end user, large hospitals above 300 beds held 56.10% of the radiation dose management market size in 2025, while ambulatory and imaging centers are growing at a 14.08% CAGR.
- By geography, North America commanded 32.85% radiation dose management market share in 2025, yet Asia-Pacific is set to record the quickest 14.62% CAGR during the forecast period.
Note: Market size and forecast figures in this report are generated using Mordor Intelligence’s proprietary estimation framework, updated with the latest available data and insights as of 2026.
Global Radiation Dose Management Market Trends and Insights
Drivers Impact Analysis*
| Driver | (~) % Impact on CAGR Forecast | Geographic Relevance | Impact Timeline |
|---|---|---|---|
| Stringent DRL Mandates for Radiology | +2.8% | Global, with early enforcement in North America & EU | Short term (≤ 2 years) |
| Rising CT & Hybrid-Imaging Procedure Volumes In Oncology Workflows | +3.1% | Global, concentrated in developed markets | Medium term (2-4 years) |
| Cloud-Based Analytics Lowering Total Cost Of Ownership | +1.9% | North America & EU primary, APAC emerging | Medium term (2-4 years) |
| AI-Powered Real-Time Dose-Alerting Gaining Regulatory Clearances | +2.4% | North America & EU leading, global expansion | Long term (≥ 4 years) |
| Shift To Photon-Counting CT Enabling Ultra-Low-Dose Protocols | +1.7% | Developed markets initially, gradual global rollout | Long term (≥ 4 years) |
| Upcoming G7 Carbon-Reduction Targets Driving Energy-Efficient Imaging Suites | +0.9% | G7 countries, spillover to allied nations | Long term (≥ 4 years) |
| Source: Mordor Intelligence | |||
Stringent DRL mandates for radiology
Regulators have moved from voluntary guidance to mandatory dose ceilings, forcing every imaging provider to embed tracking at the scanner level. The FDA now requires CT systems to display cumulative dose and maintain automated logs, a shift that steers procurement toward scanners with built-in monitoring.[1] Center for Devices and Radiological Health, “21 CFR 1020.33—Computed Tomography Equipment,” U.S. Food and Drug Administration, ecfr.gov The Joint Commission followed with 2024 accreditation clauses that oblige hospitals to audit radiation safety programs annually, spurring demand for reporting software.[2]Standards Interpretation Group, “Standards for Joint Commission Accreditation and Certification,” Joint Commission, jointcommission.org Europe mirrors this stance through the Medical Device Regulation, which ties market access to evidence of dose optimization. In the United States, CMS quality measures link reimbursement to compliance, so executives view dose management as revenue protection rather than an optional upgrade. Collectively, these rules turn the radiation dose management market into a must-have layer across all imaging modalities.
Rising CT and hybrid-imaging volumes in oncology workflows
Cancer care now relies on serial CT, PET-CT and SPECT-CT to monitor therapy response, raising cumulative patient exposure and intensifying oversight. A single PET-CT can exceed 20 mSv, edging close to annual occupational limits for staff, and patients typically undergo several scans per treatment cycle.[3]Mary Beth Farrell, “Total-Body PET/CT Applications in Cardiovascular Diseases,” Journal of Nuclear Medicine, jnmjournals.org Total-body PET systems mitigate exposure yet remain limited to specialized centers, keeping dose concerns high. Pediatric and young-adult oncology heightens the urgency because lifetime risk models penalize excess radiation. AI-driven protocol personalization enters here, refining settings per patient history and thus lowering total dose without compromising image quality. This workflow dependence on advanced monitoring cements oncology as the anchor segment for the radiation dose management market.
Cloud-based analytics lowering total cost of ownership
Subscription-based, cloud-hosted platforms remove six-figure capital barriers that once sidelined community hospitals. Philips’ partnership with Amazon Web Services illustrates how hyperscale infrastructure delivers enterprise-grade analytics at an operating-expense price point. Multi-site health systems gain benchmarking dashboards to spot outliers and harmonize protocols system-wide. While data-residency rules slow adoption in parts of Europe, hybrid architectures—local data storage plus cloud analytics—reduce that friction. The financial logic strengthens as AI models demand GPU resources beyond typical hospital IT budgets, making cloud deployment the default path for next-generation solutions. Consequently, cloud momentum propels a sizeable share of new spending in the radiation dose management market.
AI-powered real-time dose-alerting gaining regulatory clearances
In 2025 the FDA classified radiological CAD software as Class II, clarifying the pathway for AI tools that halt scans when thresholds are breached. Philips’ SmartSpeed Precise showcases dual AI engines that balance speed and image integrity, trimming exposure during acquisition. Machine-learning models ingest vast dose logs and patient attributes to recommend optimal protocols, replacing one-size-fits-all presets. As clearances become routine, vendors roll out real-time alert modules across CT, fluoroscopy and interventional suites, embedding AI at the point of care. This integration elevates safety while differentiating vendors in a crowded radiation dose management market.
Restraints Impact Analysis*
| Restraint | (~) % Impact on CAGR Forecast | Geographic Relevance | Impact Timeline |
|---|---|---|---|
| Budget Constraints In Community Hospitals & LMICs | -2.1% | Global, concentrated in emerging markets | Short term (≤ 2 years) |
| Integration Hurdles With Legacy PACS/RIS Ecosystems | -1.8% | Developed markets with established infrastructure | Medium term (2-4 years) |
| Radiologist Shortages Slowing Protocol Optimisation Adoption | -1.4% | Global, acute in rural and underserved areas | Long term (≥ 4 years) |
| Data-Sovereignty Concerns Limiting Cloud Deployment | -1.2% | EU, healthcare systems with strict privacy requirements | Medium term (2-4 years) |
| Source: Mordor Intelligence | |||
Budget constraints in community hospitals and LMICs
Facilities operating on slim margins weigh dose-tracking purchases against immediate patient-care needs. A full platform can cost USD 50,000–200,000, a figure difficult to justify without direct reimbursement incentives. Many low-to-middle-income nations still focus on expanding basic imaging capacity, so sophisticated monitoring remains secondary. While vendors offer leasing and SaaS terms, capital scarcity keeps uptake uneven and sustains a two-tier structure within the radiation dose management market.
Integration hurdles with legacy PACS/RIS ecosystems
Health systems often run imaging devices from multiple vendors, each producing proprietary dose files that complicate aggregation. Older PACS or RIS lack modern APIs, forcing middleware investments that at times exceed the monitoring software cost. Implementation delays can disrupt throughput, creating operational pushback even when clinical benefits are clear. DICOM variations further raise complexity, especially in multi-vendor fleets common to large networks. The need to retrofit legacy environments therefore slows platform rollouts and tempers growth in the radiation dose management market.
*Our forecasts treat driver/restraint impacts as directional, not additive. The impact forecasts reflect baseline growth, mix effects, and variable interactions.
Segment Analysis
By Products & Services: integrated platforms displace standalone tools
Integrated platforms accounted for 44.72% of the radiation dose management market in 2025 and are growing at 16.47% CAGR. This dominance stems from unified dashboards that track exposure, optimize protocols and auto-generate regulatory reports in one workflow. Health systems prefer fewer vendors, lower training overhead and single-sign-on usability. Standalone trackers retain niches—for example, nuclear-medicine dosimetry—yet face margin pressure because platform providers bundle equivalent modules at attractive prices. Managed services post the fastest gains as hospitals outsource medical-physics tasks. Vendors with deep clinical support therefore secure long-term contracts, reinforcing platform stickiness within the radiation dose management market.
Professional services also rise as institutions seek help interpreting benchmarks and closing compliance gaps. Advisory revenue complements software subscriptions, enlarging total customer lifetime value. Overall, the integrated-approach narrative reinforces a migration away from siloed applications toward ecosystems that scale across modalities, keeping integrated suites at the center of the radiation dose management market strategy.


By Deployment Mode: cloud marches forward despite privacy concerns
On-premise installations still hold 58.88% share, a testament to privacy rules and ingrained risk aversion, yet cloud solutions are climbing at 16.12% CAGR. Larger enterprises often adopt hybrid models that analyze data in the cloud while retaining images locally. This strategy respects residency laws while unlocking AI and advanced benchmarking. For community hospitals, pay-as-you-go pricing eliminates large capital outlays, widening access to the radiation dose management industry’s newest tools.
Total cost of ownership tilts further toward the cloud when GPU-intensive AI inference and continuous software updates enter the equation. Vendors showcase encrypted overlays and region-specific storage zones to soothe regulators. Although the debate on sovereignty persists, the performance and economic benefits keep migration steady. As a result, cloud architectures are projected to command a far larger slice of the radiation dose management market by 2030, especially in systems modernizing multiple sites simultaneously.
By Modality: nuclear medicine grows fastest as precision therapy scales
Computed tomography powered 39.55% of deployments in 2025 because its high per-scan dose demands vigilant tracking. Nonetheless, nuclear medicine and PET-CT are forecast to climb 15.78% CAGR through 2031 as radiopharmaceutical therapy and ultra-low-dose PET protocols spread. These applications require granular dosimetry to balance efficacy and safety, making them fertile ground for platform adoption.
Fluoroscopy and interventional X-ray also present sustained need, thanks to longer procedure times and staff-exposure considerations. Radiography and mammography, while mature, still benefit from automated alerts that curb repeat imaging. Altogether, modality diversity reinforces the necessity of flexible architecture, and vendors able to handle CT, PET-CT and fluoroscopy in one interface gain share in the radiation dose management market.
By Application: cardiology shows the briskest pace
Oncology held 50.28% of the radiation dose management market size in 2025, reflecting routine imaging throughout treatment cycles. Cardiology, however, leads growth at 13.74% CAGR as cardiac CT progresses from specialty to frontline triage. Hybrid scans combining coronary CTA with perfusion mapping elevate dose-monitoring stakes, pushing cardiology departments to adopt real-time alerts.
Evidence that optimized cardiac CT can replace stress testing leads payers to reimburse the modality more broadly, which in turn encourages volume. AI-guided reconstruction keeps image quality high while trimming exposure, making dose dashboards integral to everyday workflow. As a result, cardiology is poised to command an outsized share of incremental revenue inside the radiation dose management market over the forecast period.

By End User: outpatient centers accelerate under volume migration
Large hospitals above 300 beds contributed 56.10% of revenue in 2025, buoyed by comprehensive compliance obligations and bigger capital budgets. Still, ambulatory and imaging centers are advancing at 14.08% CAGR as payers favor lower-cost sites. These centers value software that shortens exam slots and streamlines peer comparison, aligning dose management with throughput gains.
Academic medical centers and government institutions add specialized requirements such as research dose-logging or military data standards, sustaining niche demand. Yet the decisive tilt toward outpatient care positions ambulatory facilities as prime adopters over the next five years, broadening the install base of the radiation dose management market well beyond tertiary hospitals.
Geography Analysis
North America owned 32.85% of the radiation dose management market in 2025 on the strength of the Joint Commission’s enforcement and CMS linking optimization to reimbursements. Early FDA clearances for AI tools give U.S. health systems first mover advantage, and Canada follows with its own dose-reporting standards. Mexico shows rising traction in private hospital chains, though adoption still lags the United States. Legacy PACS saturation occasionally slows rollouts, yet widespread EHR connectivity supports enterprise-wide benchmarking, keeping the region firmly ahead in absolute spending.
Asia-Pacific is the fastest-growing arena, posting a 14.62% CAGR through 2031. India’s expansive hospital-building program and China’s digital-health investments lead volumes, while Japan confronts aging demographics that drive imaging intensity. Australia and South Korea mirror developed-market patterns with hybrid deployment preferences and quick uptake of AI modules. Southeast Asian countries prioritize scanner procurement first but increasingly bundle dose management to satisfy new national guidelines. This broad spectrum of maturity turns APAC into a patchwork where vendors must adapt pricing and deployment models locally, yet the aggregated opportunity remains the most dynamic segment of the radiation dose management market.
Europe grows steadily as MDR harmonization simplifies vendor certification across member states. Germany, France and the United Kingdom spearhead installations, with Nordic nations achieving near-universal compliance due to integrated care systems. Southern Europe catches up as fiscal constraints ease and digital health funding rises. Data-sovereignty considerations encourage hybrid solutions that couple local storage with cloud analytics, a configuration vendors now bake into proposals by default. Brexit’s regulatory divergence adds paperwork but has not curtailed demand in the UK, where NHS modernization plans include dose safety metrics. Collectively, European procurement maintains a disciplined, safety-first posture that sustains predictable expansion of the radiation dose management market.

Competitive Landscape
Competition is moderate, with imaging OEMs leveraging installed scanners to upsell proprietary dose dashboards. Philips integrates SmartSpeed Precise into its broader AI Manager suite, while GE Healthcare and Siemens Healthineers embed exposure logs directly in console software. Pure-play vendors such as Sectra, Qaelum and Novarad carve space through vendor-neutral analytics that slot into multi-brand fleets. The rise of cloud deployment sharpens consolidation because large platforms can scale AI training across anonymized datasets, creating network effects difficult for smaller rivals to match.
Strategic moves illustrate this race. Philips launched the RADIQAL trial in 2025 to validate coronary CT dose reduction across three continents, aiming to cement its leadership in cardiology workflows. Sectra expanded its SaaS model to mid-size U.S. systems, lowering entry costs and capturing accounts previously beyond reach. Siemens Healthineers partnered with leading academic centers to co-develop pediatric dose-alert algorithms, locking in early adopters likely to influence guideline committees.
Hybrid deployment becomes a differentiator in regions with strict privacy statutes. Vendors offering local data vaults plus cloud-based AI gain traction in Germany and France, while 100% cloud suites thrive in the United States. As a result, the radiation dose management market sees winner-take-most dynamics where interoperability, clinical-grade AI and flexible deployment decide share shifts. The combined top-five vendor share sits near 65%, indicating moderate concentration yet leaving room for innovators specializing in nuclear medicine or outpatient-center workflows.
Radiation Dose Management Industry Leaders
Bayer AG
Bracco Imaging S.P.A.
GE Healthcare
Koninklijke Philips N.V.
Medsquare
- *Disclaimer: Major Players sorted in no particular order

Recent Industry Developments
- June 2025: IMAGE Information Systems released iQ-DOSE 2.0, adding new visualizations and workflow automation to support physicists and radiologists.
- May 2025: Royal Philips initiated the RADIQAL multicenter trial enrolling 824 coronary artery disease patients to evaluate dose and image-quality trade-offs.
- March 2025: Hamad Medical Corporation launched a radiation-dose monitoring program that supplies radiologists with detailed exposure analytics to adjust protocols.


Research Methodology Framework and Report Scope
Market Definitions and Key Coverage
Our study defines the global radiation dose management market as software platforms and linked professional services that capture, analyze, and report ionizing-radiation exposure from diagnostic and interventional imaging equipment, principally CT, fluoroscopy, radiography/mammography, nuclear medicine, and PET-CT. These tools help providers document compliance, benchmark protocols, and optimize patient and staff safety.
Scope exclusion: hardware dosimeters, area monitors, and radiation-shielding products fall outside this assessment.
Segmentation Overview
- By Products & Services
- Stand-alone Dose-Tracking Software
- Integrated Dose-Management Platforms
- Professional & Managed Services
- By Deployment Mode
- On-premise
- Cloud / Web-hosted
- By Modality
- Computed Tomography (CT)
- Fluoroscopy & Interventional X-ray
- Nuclear Medicine / PET-CT
- Radiography & Mammography
- By Application
- Oncology
- Cardiology
- Orthopaedics & Trauma
- By End User
- Hospitals (>300 beds)
- Ambulatory & Imaging Centres
- Others (Academic, CRO, Government)
- By Geography
- North America
- United States
- Canada
- Mexico
- Europe
- Germany
- United Kingdom
- France
- Italy
- Spain
- Rest of Europe
- Asia-Pacific
- China
- Japan
- India
- Australia
- South Korea
- Rest of Asia-Pacific
- Middle East and Africa
- GCC
- South Africa
- Rest of Middle East and Africa
- South America
- Brazil
- Argentina
- Rest of South America
- North America
Detailed Research Methodology and Data Validation
Primary Research
Mordor analysts interviewed medical physicists, radiology administrators, modality OEM product managers, and health-IT integrators across North America, Europe, Asia-Pacific, and the Middle East. These conversations tested usage rates, price points, and cloud migration timelines that were only partially visible in desk findings, enabling us to reconcile assumptions before final modeling.
Desk Research
We gathered foundational data from public sources such as the International Atomic Energy Agency, the National Council on Radiation Protection and Measurements, Eurostat health-technology files, the American College of Radiology registries, and peer-reviewed journals that track imaging procedure frequencies. Company 10-Ks, hospital procurement disclosures, and D&B Hoovers snapshots supplied revenue signals and install-base clues.
Regulatory notices, patent analytics from Questel, and trade-association white papers enriched understanding of adoption drivers and regional policy timing. The sources listed are illustrative; many additional publications were reviewed to complete our evidence base.
Market-Sizing & Forecasting
A top-down demand pool was built from national CT, fluoroscopy, and PET-CT exam volumes, multiplied by typical software spend per scanner and annual service fees; sampled vendor revenue roll-ups provided a bottom-up cross-check. Key variables like imaging procedure growth, active scanner install base, hospital bed additions, radiation-safety mandates, and cloud penetration drive year-on-year adjustments. Multivariate regression with ARIMA smoothing projects each variable, while scenario analysis tests high-regulation and low-procedure cases. Gaps in vendor reporting were bridged with regional channel checks and weighted averages from disclosed contract values.
Data Validation & Update Cycle
Outputs pass variance screens, peer review, and a second analyst audit. The model refreshes annually, with interim updates triggered by material regulatory or M&A events, so clients receive the latest vetted view.
Why Mordor's Radiation Dose Management Baseline Earns Trust
Published estimates often diverge because firms mix hardware with software, apply dissimilar currency conversions, or freeze variables for too long. Our disciplined scope, yearly refresh, and transparent variable selection reduce such drift.
Key gap drivers include bundled inclusion of personal dosimeters, omission of subscription revenues, or extrapolating one region to the globe. We disclose every assumption, which lets users trace each figure back to a clear input.
Benchmark comparison
| Market Size | Anonymized source | Primary gap driver |
|---|---|---|
| USD 455.4 million (2025) | Mordor Intelligence | - |
| USD 751.4 million (2024) | Global Consultancy A | Combines hardware dosimetry and service bundles |
| USD 343 million (2023) | Trade Journal B | Excludes cloud-subscription revenues; constant-currency base |
| USD 372.8 million (2023) | Industry Association C | Treats North America share as global proxy |
The comparison shows that, by matching scope to true software-centric spending and refreshing inputs each year, Mordor offers a balanced, reproducible baseline that decision-makers can rely on.


Key Questions Answered in the Report
What is driving current growth in the radiation dose management market?
Stringent regulatory mandates, rising CT and hybrid-imaging volumes in oncology, and the availability of AI-powered real-time alerting collectively underpin the 12.58% CAGR expected through 2031.
Which region is expanding fastest?
Asia-Pacific is forecast to grow at 14.62% CAGR due to large-scale hospital modernization in India, China’s digital-health investments and increasing regulatory harmonization.
How large is the opportunity for cloud-based solutions?
Cloud and web-hosted deployments are growing at 16.12% CAGR as subscription pricing, lower capital outlay and access to GPU-enabled AI tilt ownership economics.
Why are ambulatory imaging centers adopting dose management platforms?
Outpatient centers seek throughput gains, shorter exam slots and regulatory compliance; these needs align with the workflow optimization features embedded in modern platforms.
Which modality will see the highest adoption growth?
Nuclear medicine and PET-CT deployments are projected to rise 15.78% CAGR, propelled by precision radiopharmaceutical therapies that require granular dosimetry.
Page last updated on:


