Market Overview
| Study Period | 2020 - 2031 |
|---|---|
| Forecast Data Period | 2026 - 2031 |
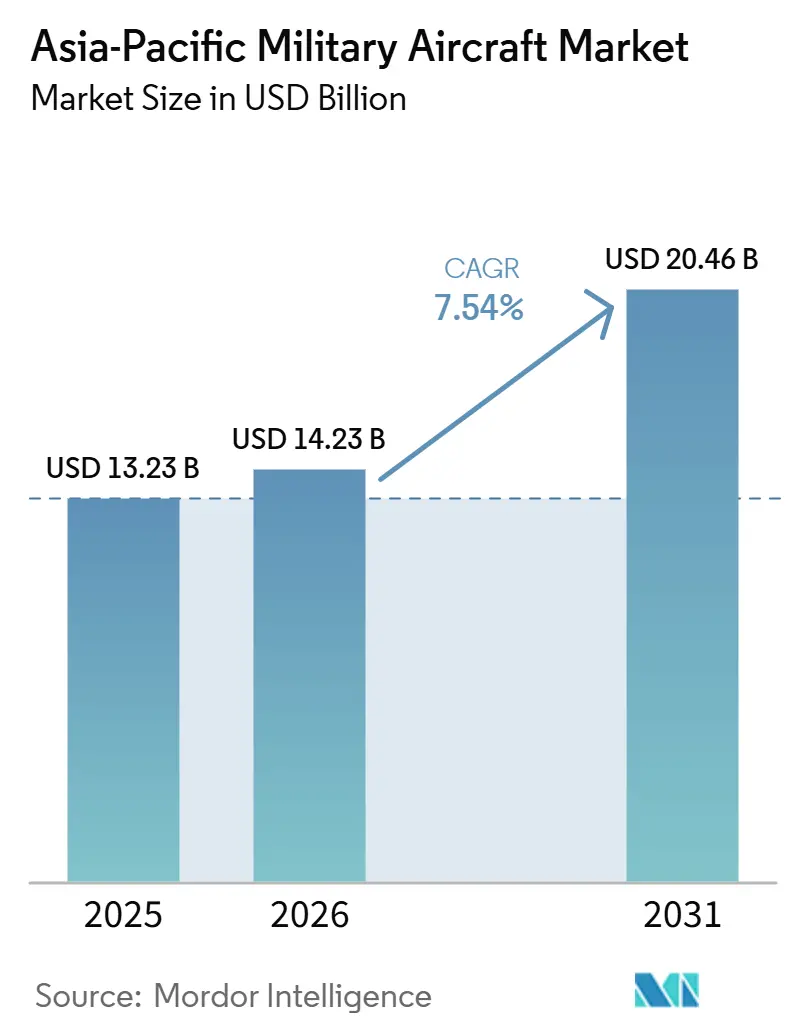
| Base Year Market Size (2025) | USD 13.23 Billion |
| Market Size (2026) | USD 14.23 Billion |
| Market Size (2031) | USD 20.46 Billion |
| Growth Rate (2026 - 2031) | 7.54% CAGR |
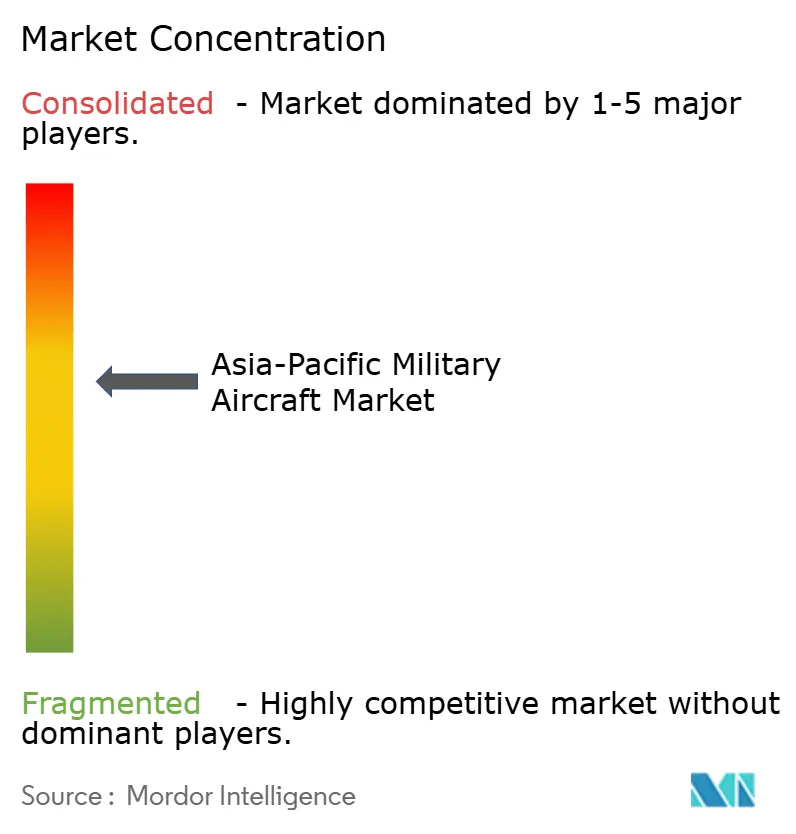
| Market Concentration | Medium |
Major Players *Disclaimer: Major Players sorted in no particular order Image © Mordor Intelligence. Reuse requires attribution under CC BY 4.0. | |
Asia-Pacific Military Aircraft Market Analysis by Mordor Intelligence
The Asia-Pacific military aircraft market size is expected to grow from USD 13.23 billion in 2025 to USD 14.23 billion in 2026, and is forecast to reach USD 20.46 billion by 2031, at a 7.54% CAGR over 2026-2031. This strong trajectory exceeds global defense outlays and is propelled by persistent flashpoints in the South China Sea and Taiwan Strait that compel governments to prioritize air superiority, multi-domain integration, and resilient supply chains. Fixed-wing programs dominate spending, yet demand for multi-role platforms that blend electronic warfare, intelligence, and strike capability is reshaping specifications. Indigenous production mandates in India, South Korea, and Indonesia pull global primes into local partnerships that deepen technology transfer while compressing delivery schedules. At the same time, naval air arms and joint forces commands drive fresh requirements for maritime strike and carrier-capable aircraft, creating new niches for both manned and unmanned systems. Export-control barriers on engines and avionics have spurred parallel investments in regional R&D, broadening the supplier mix and challenging the cost-performance calculus that long favored Western primes.
Key Report Takeaways
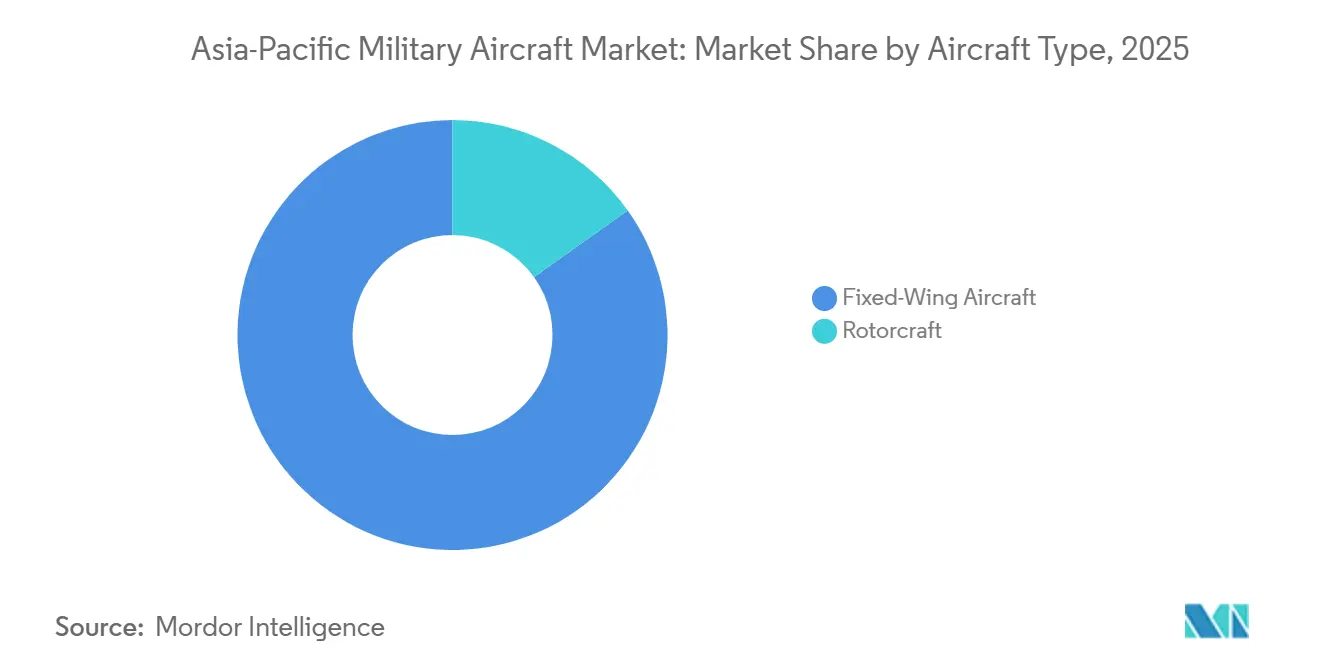
- By aircraft type, fixed-wing platforms held 84.83% of the Asia-Pacific military aircraft market share in 2025, while rotorcraft are projected to grow at a 8.28% CAGR through 2031.
- By end-user service, Air Force end-user commanded 64.12% of spending in 2025, whereas Joint/Special Operations units are projected to grow at a 9.11% CAGR to 2031.
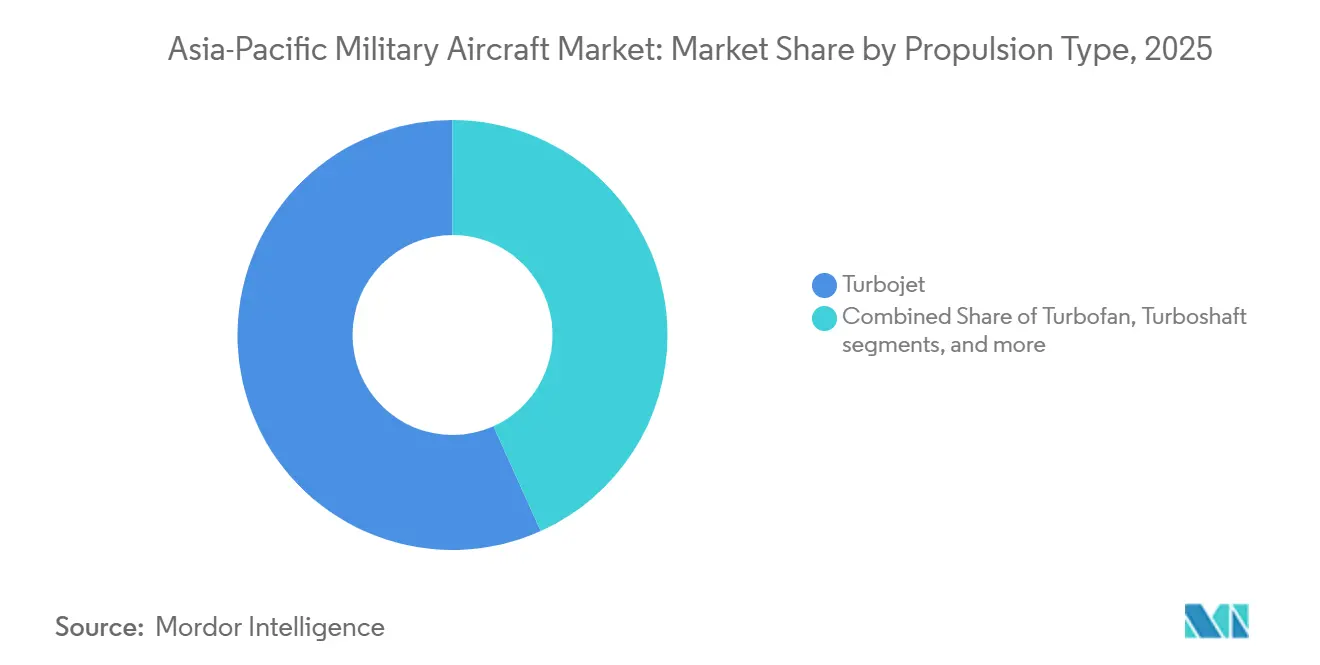
- By propulsion type, turbojet systems accounted for 56.74% of the Asia-Pacific military aircraft market in 2025. Yet turboprop platforms are forecast to grow at a 8.63% CAGR through 2031, due to demand for cost-effective trainers and light-attack aircraft.
- By geography, China is projected to account for 43.12% of the regional market share in 2025. In comparison, Australia is expected to grow at a 10.07% CAGR through 2031.
Note: Market size and forecast figures in this report are generated using Mordor Intelligence’s proprietary estimation framework, updated with the latest available data and insights as of 2026.
Asia-Pacific Military Aircraft Market Trends and Insights
Drivers Impact Analysis*
| Driver | (~) % Impact on CAGR Forecast | Geographic Relevance | Impact Timeline |
|---|---|---|---|
| Rapid fleet-modernization programs | +1.8% | China, India, Japan, South Korea, Australia | Medium term (2-4 years) |
| Indigenous fighter development initiatives | +1.2% | India, South Korea, Indonesia, Japan | Long term (≥ 4 years) |
| Shift-to-multi-domain operations doctrine | +0.9% | Region-wide, led by Australia, Japan, Singapore | Medium term (2-4 years) |
| Growing maritime security threats | +0.7% | South China Sea states, Taiwan, Philippines | Short term (≤ 2 years) |
| Defense offset policies favoring local production | +0.6% | India, Indonesia, Thailand, Malaysia | Long term (≥ 4 years) |
| Hydrogen–electric propulsion R&D pilots | +0.4% | Japan, Australia, South Korea | Long term (≥ 4 years) |
| Source: Mordor Intelligence | |||


Rapid Fleet-Modernization Programs Accelerate Procurement Cycles
Aging fighters from the 1980s and 1990s reach critical airframe-hour thresholds, compelling early retirements and driving urgent procurement of F-35, Rafale, and KF-21 aircraft. Tokyo’s decision to phase out the F-15J variants ahead of schedule mirrors Canberra’s accelerated Black Hawk buy, which replaced the Taipan fleet to restore readiness.[1]Bloomberg News, “Australia Selects Lockheed Martin Black Hawk Helicopters,” Bloomberg, bloomberg.com Faster replacement timetables shorten evaluation windows, favoring proven multi-role designs with quick delivery slots. The resulting volume of concurrent projects lifts supplier revenues and sustains robust spares pipelines.
Indigenous Fighter Development Initiatives Reshape Industrial Base
New-generation programs such as India’s AMCA and South Korea’s KF-21 elevate domestic industrial policy above per-unit cost efficiencies. Governments frame aviation projects as strategic pillars for national R&D, job creation, and export growth, thereby securing budgetary support and insulating programs from the pressures of election cycles.[2]Financial Times Reporters, “India Approves Advanced Medium Combat Aircraft Program,” Financial Times, ft.com Western OEMs answer with co-development roles and deeper local value-addition to retain market presence.
Shift to Multi-Domain Operations Doctrine Drives Integrated Platform Requirements
Interoperability with cyber, maritime, and space assets now guides platform selection. The F-35B’s network-centric suite influenced Singapore’s 2024 order, showing how sensor fusion and secure data links trump top speed or payload.[3]Defense News Staff, “Singapore Confirms F-35B Selection for Next Generation Fighter,” Defense News, defensenews.com Retrofit contracts to upgrade radars and EW suites give legacy fleets a second life while guaranteeing recurring revenue for avionics suppliers.
Growing Maritime Security Threats Accelerate Naval Aviation Procurement
Carrier-capable jets and long-range patrol craft are moving from niche to essential for littoral states facing gray-zone challenges. Manila’s modernization plan emphasizes that fighters can police exclusive economic zones, a trend echoed by Australia’s push for long-range strikes as part of the AUKUS initiative.[4]Reuters Staff, “Philippines Accelerates Military Modernization Amid South China Sea Tensions,” Reuters, reuters.com Demand now spans anti-submarine helicopters, maritime drones, and ship-borne fighters, broadening the Asia-Pacific military aircraft market.
Restraints Impact Analysis*
| Restraint | (~) % Impact on CAGR Forecast | Geographic Relevance | Impact Timeline |
|---|---|---|---|
| Budget re-prioritization to cyber and space domains | -0.8% | Japan, Australia, South Korea, Singapore | Short term (≤ 2 years) |
| Protracted certification timelines for new-gen trainers | -0.6% | India, Indonesia, Thailand, Malaysia | Medium term (2-4 years) |
| Rotorcraft sustainment skill-gap in Tier-2 economies | -0.5% | Southeast Asian markets | Long term (≥ 4 years) |
| Export-control choke-points on advanced engines | -0.3% | All of Asia-Pacific except China | Medium term (2-4 years) |
| Source: Mordor Intelligence | |||
Budget Re-prioritization to Cyber and Space Domains Constrains Aviation Outlays
Japan's decision to substantially increase funding for satellite constellations and cyber units in 2024, while maintaining flat budgets for aircraft procurement, signifies a strategic shift toward achieving information dominance. This reallocation aligns with a broader regional trend, as countries like Australia and South Korea also prioritize investments in space and cyber capabilities. The shift underscores the growing significance of intelligence, surveillance, secure communications, and cyber resilience in contemporary warfare. Consequently, traditional aviation programs, particularly those involving trainer aircraft and upgrades to legacy fleets, are experiencing near-term budgetary constraints. These limitations may slow pilot training and delay modernization efforts, posing challenges for aerospace manufacturers focused on conventional platforms.
Protracted Certification Timelines for New-Generation Trainers Slow Fleet Renewal
Next-generation trainer aircraft programs in India and Indonesia are facing extended regulatory reviews, resulting in delays in induction timelines and necessitating the continued operation of older fleets beyond their intended service lives. This prolonged use of aging platforms is increasing maintenance costs and placing additional pressure on logistics and support systems. Consequently, suppliers are adjusting their cash-flow forecasts and may prioritize more viable export opportunities to mitigate the impact of these delays. These challenges are affecting domestic readiness and could undermine regional aerospace competitiveness. If unresolved, the delays may also hinder pilot training capacity and overall operational preparedness in both countries.
*Our forecasts treat driver/restraint impacts as directional, not additive. The impact forecasts reflect baseline growth, mix effects, and variable interactions.
Segment Analysis
By Aircraft Type: Fixed-Wing Dominance Masks Rotorcraft Innovation
Fixed-wing models accounted for an 84.83% market share in 2025 as multirole fighters replaced single-mission jets at a brisk 8.04% CAGR through 2031. This market size advantage stems from large orders from Japan, South Korea, and Australia, which favor the F-35, KF-21, and Rafale fleets. Concurrently, electronic warfare variants and intelligence platforms expand in lower volumes, yet they carry high contract values, sustaining supplier margins.
Rotorcraft procurement follows a different curve, where modular designs that switch from lift to combat duty in minutes attract fiscally constrained buyers. Orders for the MH-60M, AW139, and multi-role maritime helicopters increase as governments accept lower speeds in exchange for vertical lift versatility. Leasing and power-by-the-hour contracts are gaining traction, reducing capital expenditures while increasing aftermarket service demand.
The rotorcraft renaissance benefits from lower operating costs and faster crew training cycles. However, the segment trails in absolute dollars, its adaptability to search-and-rescue and humanitarian missions secures steady funding even in flat defense budgets. Emerging hybrid-electric demonstrators hint at future efficiency breakthroughs that could further narrow the performance gap with jets.


By End-User Service: Joint Operations Drive Procurement Evolution
Air Forces maintained 64.12% control of spending in 2025, yet Joint and Special Operations commands are outpacing them at a 9.11% CAGR, signaling a doctrinal pivot toward cross-service synergy. Their rising share of the Asia-Pacific military aircraft market size derives from aircraft optimized for rapid infiltration, electronic attack, and precision strike across land and sea domains.
Joint units demand lighter footprints, shorter field runways, and plug-and-play sensor kits. This customer mix rewards manufacturers offering flexible basing concepts and quick-change mission pallets. Army Aviation turns to reconnaissance drones and light-attack helicopters to complement fixed-wing squadrons, while Naval wings order carrier-ready fighters and ASW helicopters to secure maritime chokepoints.
By Propulsion Type: Turboprop Renaissance Challenges Jet Supremacy
Turbojet engines accounted for 56.74% of the 2025 Asia-Pacific military aircraft market, primarily driven by fighter fleets requiring supersonic performance. Yet turboprop aircraft are growing at 8.63% CAGR through 2031 as air arms prioritize endurance and low hourly costs for training and counter-insurgency roles.
Platforms such as the A-29 Super Tucano and T-6C Texan II offer protracted loiter times that jets cannot match, making them ideal for border patrol and pilot pipeline development. Fuel efficiency becomes a decisive metric amid volatile energy prices, shifting some procurement away from afterburning engines toward simpler designs. Advanced hybrid concepts under study could amplify this shift by incorporating silent operations and reducing thermal signatures for specialized missions.
Geography Analysis
China accounted for 43.12% of the market share in 2025, leveraging its vast industrial base to accelerate development of the J-20 and Y-20 programs, positioning state-owned group AVIC as both a domestic supplier and an exporter to Belt and Road partners. The push expands the Asia-Pacific military aircraft market, yet raises interoperability concerns for neighbors wary of Chinese avionics architectures.
India balances its sovereign ambitions with near-term readiness, blending the development of Tejas and AMCA with the import of Rafale, C-295, and MH-60R platforms. High local-content rules spur joint ventures that broaden the Asia-Pacific military aviation industry ecosystem. Offsets that once centered on the fuselage work now cover radar, EW, and composite wings, deepening domestic know-how.
US alliance partners Japan and Australia secure fifth-generation capability through the F-35 while anchoring regional MRO hubs. This fosters Australia's growth at a 10.07% CAGR through 2031. Mitsubishi Heavy Industries is expanding final-assembly capacity near Nagoya, and Boeing is building a new F-15 and F/A-18 sustainment center in Singapore, to shorten logistical tails for Southeast Asian operators. Singapore, Thailand, and Malaysia diversify their supplier pools to secure favorable terms, alternating among US, European, and Israeli vendors in highly contested tenders.
Competitive Landscape
The Asia-Pacific military aircraft market exhibits moderate concentration, with the top five companies holding just under 60% of the combined revenue, leaving room for regional challengers. Lockheed Martin, Boeing, and Airbus stay ahead through their depth of technology and robust upgrade roadmaps. Yet, their lead narrows as Korea Aerospace Industries, Hindustan Aeronautics, and AVIC secure government backing and export prospects.
Primes increasingly offer intellectual property sharing, local assembly, and supplier development funds to fulfill indigenous content requirements. Lockheed Martin's decision to embed more F-35 work in Japan and Boeing's Singapore MRO investment illustrate how industrial cooperation now trumps unit price in award criteria.
Emerging white-space opportunities center on training services, data analytics-based maintenance, and mission systems retrofits, where smaller firms can circumvent the majors' hardware dominance. Unmanned system startups target gaps in ISR and loitering munition capabilities, challenging legacy business models that rely on large airframes and multi-year production orders.
Asia-Pacific Military Aircraft Industry Leaders
Lockheed Martin Corporation
The Boeing Company
Airbus SE
Korea Aerospace Industries, Ltd.
Hindustan Aeronautics Limited
- *Disclaimer: Major Players sorted in no particular order

Recent Industry Developments
- July 2026: Japan, the UK, and Italy announced the extension of the contract for the joint development of a next-generation fighter jet through the end of 2027.
- September 2025: India restarted its procurement process for light helicopters for the Army and Air Force. The MoD issued a new request for information (RFI) in August for approximately 200 Reconnaissance and Surveillance Helicopters (RSH), continuing an acquisition program that began in 2008.
- September 2025: Airbus Helicopters signed a contract with the Royal Thai Air Force (RTAF) for two H225 multi-role helicopters. These aircraft will enhance the RTAF's search and rescue (SAR) and emergency medical services (EMS) capabilities, thereby strengthening its national security and humanitarian support capabilities.
- March 2025: The Indian MoD signed two contracts with Hindustan Aeronautics Limited for the supply of 156 Light Combat Helicopters (LCH), Prachand, along with training and associated equipment worth INR 62,700 crore (USD 7.52 billion), excluding taxes. The first contract covers 66 LCHs for the Indian Air Force, while the second contract includes 90 LCHs for the Indian Army.
- January 2025: Japan awarded Kawasaki Heavy Industries a contract to produce 17 CH-47 Chinook heavy-lift helicopters for its armed forces. The contract includes JPY 71.4 billion (USD 463.28 million) for five CH-47J custom-built Japanese variant aircraft and JPY 161.1 billion (USD 1.04 billion) for 12 CH-47JA extended-range variant platforms.


Asia-Pacific Military Aircraft Market Report Scope
The Asia-Pacific military aircraft market encompasses the procurement, production, modernization, maintenance, and lifecycle support of military aircraft operated by defense and security forces across the Asia-Pacific region. The market includes fixed-wing aircraft and rotorcraft designed for defense, combat, transport, surveillance, reconnaissance, training, maritime security, special operations, and humanitarian missions. It also covers aircraft upgrades, mission system integration, propulsion systems, avionics, and aftermarket support services associated with military aviation platforms.
The Asia-Pacific military aircraft market is segmented by aircraft type, end-user service, propulsion type, and geography. By aircraft type, the market is segmented into fixed-wing aircraft and rotorcraft. By end-user service, the market is segmented into Air Force, Army Aviation, Naval/Marine Corps Aviation, Joint/Special Operations, and Paramilitary and Coast Guard. By propulsion type, the market is segmented into turbofan, turbojet, turboprop, turboshaft, and fully electric/hybrid-electric. The report also covers the market sizes and forecasts for the Asia-Pacific military aircraft market in six countries across the region. For each segment, the market size is provided in terms of value (USD).
By Aircraft Type
| Fixed-Wing Aircraft | Multi-role Aircraft |
| Training Aircraft | |
| Transport Aircraft | |
| Others | |
| Rotorcraft | Multi-Mission Helicopters |
| Transport Helicopters | |
| Others |
By End-User Service
| Air Force |
| Army Aviation |
| Naval/Marine Corps Aviation |
| Joint/Special Operations |
| Paramilitary and Coast Guard |
By Propulsion Type
| Turbofan |
| Turbojet |
| Turboprop |
| Turboshaft |
| Fully Electric/Hybrid-Electric |
By Geography
| China |
| India |
| Japan |
| South Korea |
| Indonesia |
| Australia |
| Rest of Asia-Pacific |
| By Aircraft Type | Fixed-Wing Aircraft | Multi-role Aircraft |
| Training Aircraft | ||
| Transport Aircraft | ||
| Others | ||
| Rotorcraft | Multi-Mission Helicopters | |
| Transport Helicopters | ||
| Others | ||
| By End-User Service | Air Force | |
| Army Aviation | ||
| Naval/Marine Corps Aviation | ||
| Joint/Special Operations | ||
| Paramilitary and Coast Guard | ||
| By Propulsion Type | Turbofan | |
| Turbojet | ||
| Turboprop | ||
| Turboshaft | ||
| Fully Electric/Hybrid-Electric | ||
| By Geography | China | |
| India | ||
| Japan | ||
| South Korea | ||
| Indonesia | ||
| Australia | ||
| Rest of Asia-Pacific | ||


Market Definition
- Aircraft Type - All the military aircraft and rotorcraft which are used for various applications are included in this study.
- Sub-Aircraft Type - For this study, sub-aircraft types such as fixed-wing aircraft and rotorcraft based on their application are considered.
- Body Type - Multi-Role Aircraft, Transport, Training Aircraft, Bombers, Reconnaissance Aircraft, Multi-Mission Helicopters, Transport Helicopters and various other aircraft and rotorcraft are considered in this study.
| Keyword | Definition |
|---|---|
| IATA | IATA stands for the International Air Transport Association, a trade organization composed of airlines around the world that has an influence over the commercial aspects of flight. |
| ICAO | ICAO stands for International Civil Aviation Organization, a specialized agency of the United Nations that supports aviation and navigation around the globe. |
| Air Operator Certificate (AOC) | A certificate granted by a National Aviation Authority permitting the conduct of commercial flying activities. |
| Certificate Of Airworthiness (CoA) | A Certificate Of Airworthiness (CoA) is issued for an aircraft by the civil aviation authority in the state in which the aircraft is registered. |
| Gross Domestic Product (GDP) | Gross domestic product (GDP) is a monetary measure of the market value of all the final goods and services produced in a specific time period by countries. |
| RPK (Revenue Passenger Kilometres) | The RPK of an airline is the sum of the products obtained by multiplying the number of revenue passengers carried on each flight stage by the stage distance - it is the total number of kilometers traveled by all revenue passengers. |
| Load Factor | The load factor is a metric used in the airline industry that measures the percentage of available seating capacity that has been filled with passengers. |
| Original Equipment Manufacturer (OEM) | An original equipment manufacturer (OEM) traditionally is defined as a company whose goods are used as components in the products of another company, which then sells the finished item to users. |
| International Transportation Safety Association (ITSA) | International Transportation Safety Association (ITSA) is an international network of heads of independent safety investigation authorities (SIA). |
| Available Seats Kilometre (ASK) | This metric is calculated by multiplying Available Seats (AS) in one flight, defined above, multiplied by the distance flown. |
| Gross Weight | The fully-loaded weight of an aircraft, also known as “takeoff weight,” which includes the combined weight of passengers, cargo, and fuel. |
| Airworthiness | The ability of an aircraft, or other airborne equipment or system, to operate in flight and on the ground without significant hazard to aircrew, ground crew, passengers or to other third parties. |
| Airworthiness Standards | Detailed and comprehensive design and safety criteria applicable to the category of aeronautical product (aircraft, engine or propeller). |
| Fixed Base Operator (FBO) | A business or organization that operates at an airport. An FBO provides aircraft operating services like maintenance, fueling, flight training, charter services, hangaring, and parking. |
| High Net worth Individuals (HNWIs) | High Net worth Individuals (HNWIs) are individuals with over USD 1 million in liquid financial assets. |
| Ultra High Net worth Individuals (UHNWIs) | Ultra High Net worth Individuals (UHNWIs) are individuals with over USD 30 million in liquid financial assets. |
| Federal Aviation Administration (FAA) | The division of the Department of Transportation is concerned with aviation. It operates Air Traffic Control and regulates everything from aircraft manufacturing to pilot training to airport operations in the United States. |
| EASA (European Aviation Safety Agency) | The European Aviation Safety Agency is a European Union agency established in 2002 with the task of overseeing civil aviation safety and regulation. |
| Airborne Warning and Control System (AW&C) aircraft | Airborne Warning and Control System (AEW&C) aircraft is equipped with a powerful radar and on-board command and control center to direct the armed forces. |
| The North Atlantic Treaty Organization (NATO) | The North Atlantic Treaty Organization (NATO), also called the North Atlantic Alliance, is an intergovernmental military alliance between 30 member states – 28 European and two North American. |
| Joint Strike Fighter (JSF) | Joint Strike Fighter (JSF) is a development and acquisition program intended to replace a wide range of existing fighter, strike, and ground attack aircraft for the United States, the United Kingdom, Italy, Canada, Australia, the Netherlands, Denmark, Norway, and formerly Turkey. |
| Light Combat Aircraft (LCA) | A light combat aircraft (LCA) is a light, multirole jet/turboprop military aircraft, commonly derived from advanced trainer designs, designed for engaging in light combat. |
| Stockholm International Peace Research Institute (SIPRI) | Stockholm International Peace Research Institute (SIPRI) is an international institute that provides data, analysis, and recommendations for armed conflict, military expenditure, and arms trade as well as disarmament and arms control. |
| Maritime Patrol Aircraft (MPA) | A maritime patrol aircraft (MPA), also known as maritime reconnaissance aircraft is a fixed-wing aircraft designed to operate for long durations over water in maritime patrol roles, in particular, anti-submarine warfare (ASW), anti-ship warfare (AShW), and search and rescue (SAR). |
| Mach Number | The Mach number is defined as the ratio of true airspeed to the speed of sound at the altitude of a given aircraft. |
| Stealth Aircraft | Stealth is a Common term applied to low observable (LO) technology and doctrine, that makes an aircraft near invisible to radar, infrared or visual detection. |


Research Methodology
Mordor Intelligence follows a four-step methodology in all our reports.
- Step-1: Identify Key Variables: In order to build a robust forecasting methodology, the variables and factors identified in Step-1 are tested against available historical market numbers. Through an iterative process, the variables required for market forecast are set and the model is built on the basis of these variables.
- Step-2: Build a Market Model: Market-size estimations for the historical and forecast years have been provided in revenue and volume terms. For sales conversion to volume, the average selling price (ASP) is kept constant throughout the forecast period for each country, and inflation is not a part of the pricing.
- Step-3: Validate and Finalize: In this important step, all market numbers, variables and analyst calls are validated through an extensive network of primary research experts from the market studied. The respondents are selected across levels and functions to generate a holistic picture of the market studied.
- Step-4: Research Outputs: Syndicated Reports, Custom Consulting Assignments, Databases & Subscription Platforms


