Market Overview
| Study Period | 2020 - 2031 |
|---|---|
| Forecast Data Period | 2026 - 2031 |
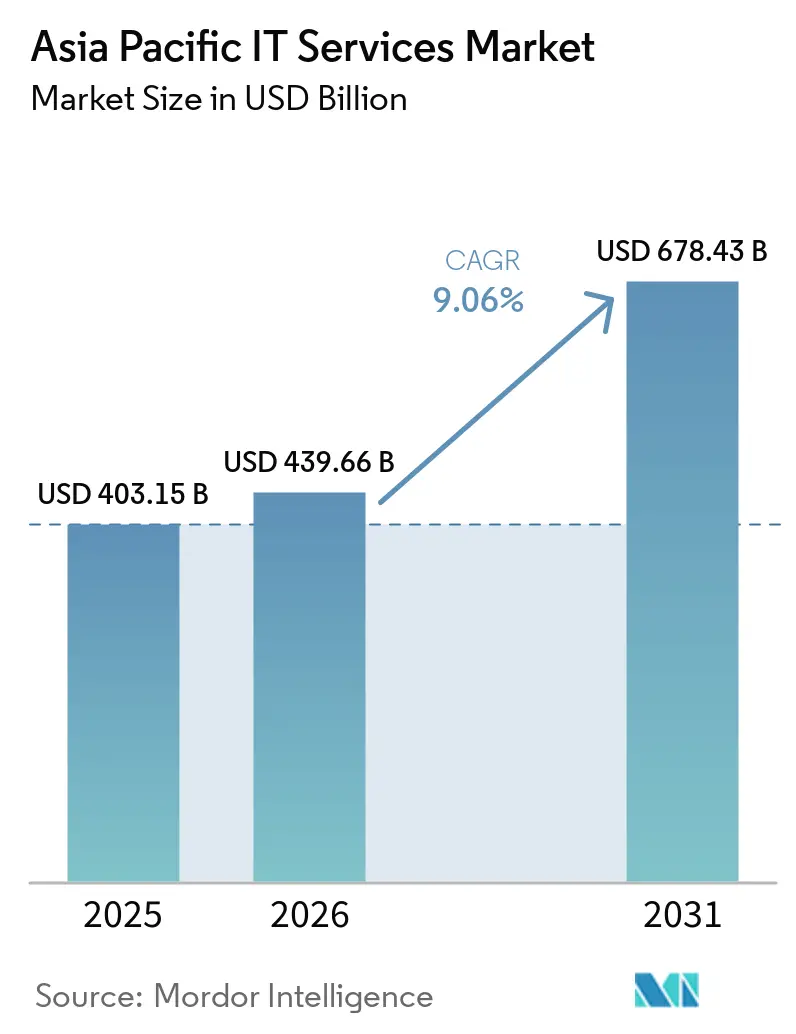
| Base Year Market Size (2025) | USD 403.15 Billion |
| Market Size (2026) | USD 439.66 Billion |
| Market Size (2031) | USD 678.43 Billion |
| Growth Rate (2026 - 2031) | 9.06% CAGR |
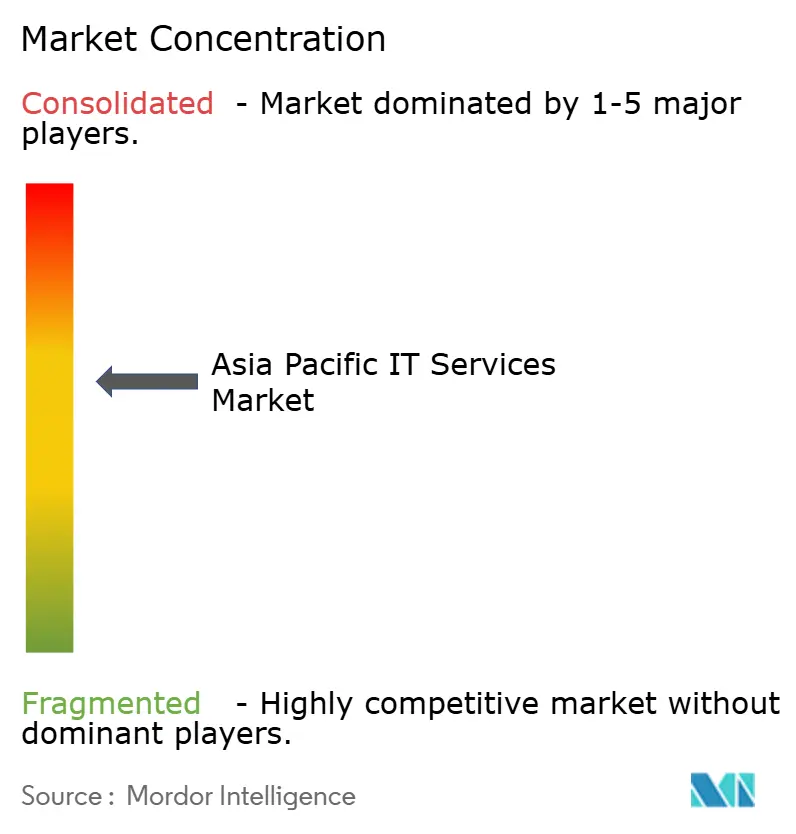
| Market Concentration | Medium |
Major Players *Disclaimer: Major Players sorted in no particular order Image © Mordor Intelligence. Reuse requires attribution under CC BY 4.0. | |
Asia Pacific IT Services Market Analysis by Mordor Intelligence
The Asia Pacific IT Services Market size is projected to expand from USD 403.15 billion in 2025 and USD 439.66 billion in 2026 to USD 678.43 billion by 2031, registering a CAGR of 9.06% between 2026 to 2031. This expansion underscores how enterprises are shifting budgets from legacy hardware toward cloud-native platforms, AI-enabled automation, and industry-specific managed services. Sovereign-cloud regulations that restrict cross-border data flows are prompting multinationals to build in-country data centers and forge joint ventures with local providers, while the rapid uptake of generative AI is catalyzing demand for advisory, integration, and ongoing model-management offerings. Cost-efficiency mandates continue to push mid-tier manufacturers and retailers toward infrastructure outsourcing, and smart-city projects across ASEAN are generating multi-year contracts for infrastructure-as-a-service and edge-computing deployments that extend beyond traditional consulting. Competitive intensity is rising as Indian global-delivery leaders, international consultancies, and hyperscale cloud platforms race to embed AI and cybersecurity capabilities in every client engagement, widening opportunities for specialists focused on healthcare interoperability, fintech fraud analytics, and sustainable-IT advisory.
Key Report Takeaways
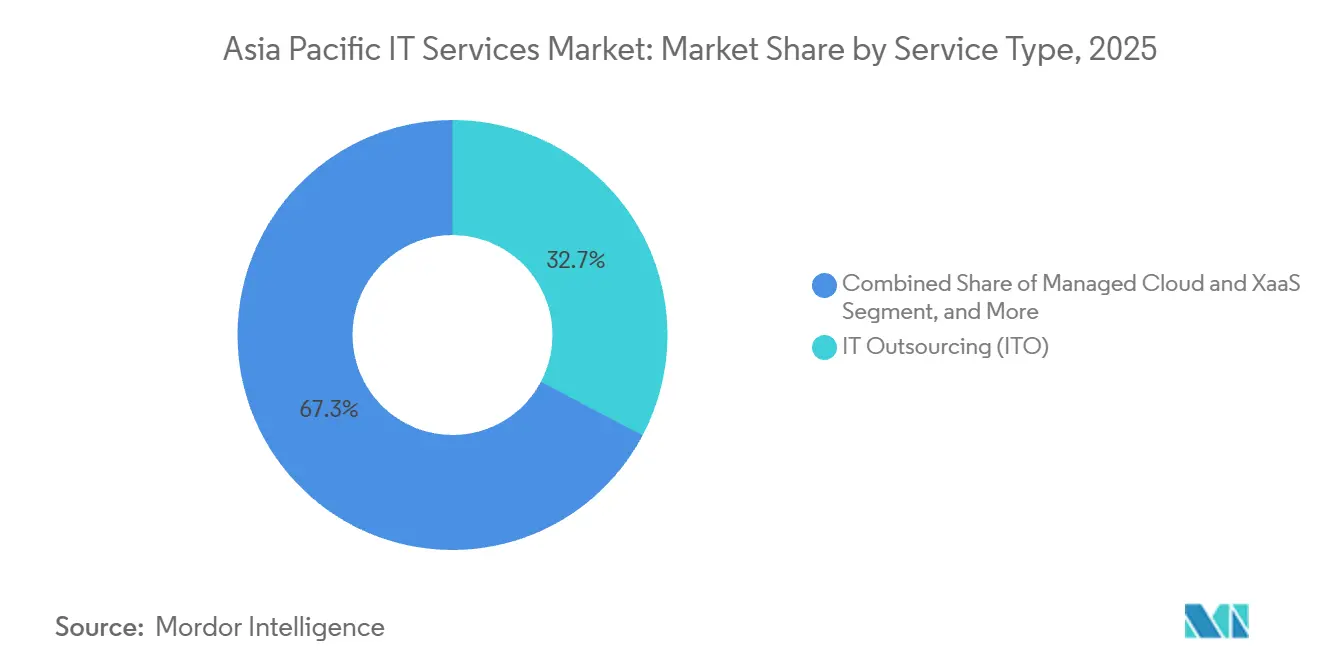
- By service type, IT outsourcing led with 32.74% of the Asia-Pacific IT Services market share in 2025, whereas managed cloud and XaaS is advancing at a 10.11% CAGR through 2031.
- By deployment model, public cloud accounted for 49.73% of spending in 2025 of the Asia-Pacific IT Services market, while hybrid and multi-cloud is forecast to grow at a 10.46% CAGR to 2031.
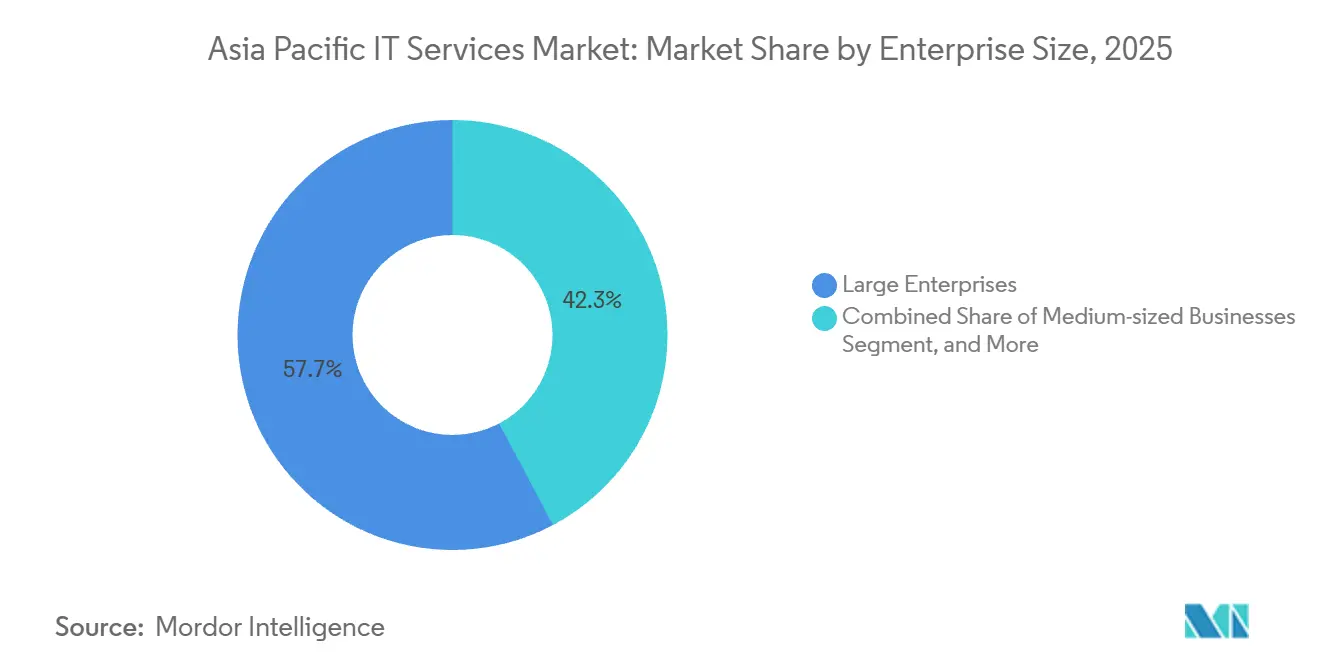
- By enterprise size, large enterprises held 57.74% of revenue in 2025 of the Asia-Pacific IT Services market, but small and micro businesses are projected to expand at a 10.66% CAGR over the same period.
- By end-user industry, banking, financial services, and insurance captured 24.62% of the Asia-Pacific IT Services market size in 2025, whereas healthcare and life sciences is set to rise at a 10.27% CAGR through 2031.
- By country, China retained a 28.74% share in 2025 of the Asia-Pacific IT Services market, yet India is expected to post the fastest growth at a 10.43% CAGR between 2026 and 2031.
Note: Market size and forecast figures in this report are generated using Mordor Intelligence’s proprietary estimation framework, updated with the latest available data and insights as of January 2026.
Asia Pacific IT Services Market Trends and Insights
Drivers Impact Analysis*
| Driver | (~) % Impact on CAGR Forecast | Geographic Relevance | Impact Timeline |
|---|---|---|---|
| Rapid digital transformation across industries | +2.3% | Global, with highest intensity in China, India, Japan, South Korea | Medium term (2-4 years) |
| Sovereign-cloud mandates reshaping in-region delivery | +1.8% | China, Singapore, India, Indonesia, Malaysia, Vietnam, Thailand, Australia | Long term (≥ 4 years) |
| AI and Gen-AI managed-services boom | +2.1% | Global, early adoption in Singapore, Japan, South Korea, Australia | Short term (≤ 2 years) |
| Cost-efficiency push driving ITO and BPO adoption | +1.5% | India, Philippines, Indonesia, Malaysia, Thailand | Medium term (2-4 years) |
| Smart-city mega-projects in ASEAN and India | +0.9% | Indonesia, Malaysia, Thailand, India, Singapore | Long term (≥ 4 years) |
| Climate-tech and green-IT compliance outsourcing | +0.7% | Japan, South Korea, Singapore, Australia, with spillover to ASEAN | Long term (≥ 4 years) |
| Source: Mordor Intelligence | |||
Rapid Digital Transformation Across Industries
Financial institutions, manufacturers, and retailers are rebuilding core systems around API-driven microservices to support real-time analytics and omnichannel engagement, redirecting substantial capital toward cloud migration and integration consulting. A regional survey found that 73% of organizations plan to raise transformation budgets, yet capability gaps persist, with only 42% of Thai executives maintaining detailed roadmaps. This mismatch fuels steady demand for advisory partners that can bridge legacy mainframes and cloud platforms. Banks in Singapore and Japan are rolling out real-time payments and AI-based credit scoring, while retailers invest in edge analytics for dynamic pricing to counter e-commerce rivals. The resulting project pipeline spans cloud migration, data-platform unification, and omnichannel customer-experience design, each feeding multi-year managed-service contracts focused on optimization and support.
AI and Generative-AI Managed-Services Boom
Generative AI adoption is accelerating as firms seek to boost developer productivity and automate call-center workflows. Weekly usage among knowledge workers reached 78% in 2024, the highest global rate, yet just one-third of companies have formal governance, opening the door for managed service providers that bundle model selection, fine-tuning, and responsible-AI controls. Pilot programs in India demonstrated 43-45% productivity gains, prompting rapid scaling across software, insurance, and telecom firms. Providers that deliver pre-trained vertical models, continuous monitoring, and cost-optimized inference infrastructure are capturing premium margins. Early adopter markets such as Singapore and South Korea are now moving from proofs of concept to enterprise-wide rollouts, driving double-digit growth in AI-operations outsourcing.
Sovereign-Cloud Mandates Reshaping In-Region Delivery
China’s Cybersecurity and Data Security Laws require domestic storage of sensitive information, compelling foreign multinationals to co-locate within approved facilities or partner with local hyperscalers.[1]Cyberspace Administration of China, “Cybersecurity Law of the People’s Republic of China,” CAC.GOV.CN Similar regulations in Singapore, India, and Indonesia enforce residency for selected data classes, forcing global service providers to redesign delivery models around multi-country footprints and localized talent. The regulatory patchwork raises compliance-cost visibility and favors regionally diversified vendors able to provide sovereign-cloud reference architectures, automated data-classification tools, and cross-border logging. Demand for consulting on residency mapping, encryption techniques, and joint-venture structuring is rising, while infrastructure-as-a-service providers that can guarantee in-country disaster recovery gain share.
Cost-Efficiency Push Driving ITO and BPO Adoption
Margin pressure in manufacturing, retail, and telecom is intensifying interest in outcome-based outsourcing. India’s software services exports hit USD 199 billion in fiscal 2024, buoyed by infrastructure management and business-process outsourcing. The Philippines earned USD 29.5 billion from BPO in 2023, and is now pivoting toward data analytics and digital-marketing services to capture higher value. Deloitte reports that 59% of regional enterprises outsource primarily for cost reduction, yet 47% also cite skill access, indicating that vendors able to mix automation, domain expertise, and competitive pricing gain preference. Emerging hubs such as Indonesia and Malaysia are attracting back-office work by combining lower wages with government incentives, diversifying the Asia-Pacific IT Services market delivery landscape.
Restraints Impact Analysis*
| Restraint | (~) % Impact on CAGR Forecast | Geographic Relevance | Impact Timeline |
|---|---|---|---|
| Severe talent shortages and wage inflation in tier-1 hubs | -1.4% | India, Singapore, China, Japan, South Korea, Australia | Short term (≤ 2 years) |
| Escalating cybersecurity and data-sovereignty compliance costs | -1.1% | Global, with highest burden in China, Singapore, India, Australia | Medium term (2-4 years) |
| Legacy tech-debt in state-owned enterprises | -0.8% | China, India, Indonesia, Malaysia, Thailand, Vietnam | Long term (≥ 4 years) |
| Geopolitical digital blocs fragmenting supply chains | -0.6% | China, Taiwan, South Korea, with spillover to ASEAN | Medium term (2-4 years) |
| Source: Mordor Intelligence | |||
Severe Talent Shortages and Wage Inflation in Tier-1 Hubs
Cloud architects, cybersecurity analysts, and AI engineers remain in short supply, driving double-digit wage jumps in Bengaluru, Shenzhen, and Singapore. Korn Ferry forecasts a regional deficit of 4.7 million skilled professionals by 2030, with India alone lacking up to 1.5 million experts. Providers face margin compression as labor costs rise 10-15% annually and clients resist billing-rate hikes. To mitigate, vendors are automating routine service-desk tasks, reskilling mid-level engineers in cloud security, and shifting delivery to secondary cities in Vietnam and the Philippines. While these measures relieve pressure, the supply-demand imbalance is projected to persist through 2027, constraining growth in high-complexity services.
Escalating Cybersecurity and Data-Sovereignty Compliance Costs
Average data-breach costs in Asia-Pacific climbed to USD 3.05 million in 2024, while Singapore incidents averaged USD 4.87 million, ranking among the world’s highest.[2] IBM Security, “Cost of a Data Breach Report 2024,” IBM.COM Responding, enterprises plan 15-20% budget increases for zero-trust architecture, identity management, and incident response. Mandatory audits under China’s Cybersecurity Law and India’s forthcoming Data Protection Bill add operational overhead, especially for mid-market firms. Although managed-security providers benefit, capital diverted to compliance can slow broader digital-transformation rollouts, tempering the Asia-Pacific IT Services market expansion until regulatory regimes stabilize.
*Our forecasts treat driver/restraint impacts as directional, not additive. The impact forecasts reflect baseline growth, mix effects, and variable interactions.
Segment Analysis
By Service Type: Managed Cloud and XaaS Gain Momentum
Managed cloud and XaaS services are forecast to grow at a 10.11% CAGR as enterprises opt for elastic consumption over fixed-capacity contracts. The Asia-Pacific IT Services market size for IT outsourcing remained dominant in 2025, holding a 32.74% share and underpinning infrastructure management and application support requirements. However, demand is tilting toward outcome-based bundles that integrate infrastructure, platform, and software layers under unified SLAs. Vendors differentiate through industry blueprints, Kubernetes orchestration, and cloud-cost optimization. Meanwhile, IT consulting retains strategic relevance for large-scale modernization projects, particularly in banking core-system replacement and plant-floor digitization within automotive manufacturing. Business-process outsourcing continues to attract retailers and telecom operators seeking cost efficiency in finance and human resources workflows. Support and maintenance services face price erosion as self-service portals and AIOps reduce ticket volumes, yet they sustain recurring revenue and client stickiness. Collectively, these dynamics pivot the Asia-Pacific IT Services market toward as-a-service delivery, reshaping partner ecosystems around cloud-centric reference architectures.
In parallel, hyperscalers are embedding managed-service toolkits into their marketplaces, enabling smaller providers to white-label monitoring, backup, and security features without investing in proprietary platforms. Flexera recorded that 89% of global enterprises pursue multi-cloud strategies, a pattern mirrored in Asia-Pacific where clients engage managed providers to navigate interoperability across Amazon Web Services, Microsoft Azure, and Google Cloud. This multi-cloud complexity sustains above-average revenue growth for integration specialists even as commoditization pressures intensify in traditional infrastructure outsourcing.


By Deployment Model: Hybrid Architectures Ascend
Hybrid and multi-cloud environments are expanding at a 10.46% CAGR, reflecting regulatory, latency, and cost considerations. Public cloud accounted for 49.73% of spending in 2025, but many financial institutions and governments maintain sensitive workloads on private infrastructure to comply with residency mandates. The Asia-Pacific IT Services market share attached to on-premises systems is steadily declining, yet manufacturing and energy companies still prioritize local processing for latency-critical applications such as machine-vision inspection and SCADA control. Hybrid architectures provide a pragmatic bridge, allowing gradual migration while preserving existing investments. HashiCorp reported that 72% of Asia-Pacific enterprises had integrated at least two cloud providers by 2024, underscoring the premium placed on interoperability tooling. Service partners now bundle policy-as-code governance, FinOps, and workload-placement analytics, enabling clients to optimize spend while satisfying compliance auditors.
Edge computing is further amplifying hybrid demand, particularly in logistics and retail where near-real-time analytics enhance route optimization and in-store personalization. Vendors that can extend single-pane observability across edge, private-cloud, and hyperscale regions are commanding higher margins. As AI inference moves closer to data sources, hybrid models become indispensable, reinforcing their centrality to the Asia-Pacific IT Services market trajectory.
By Enterprise Size: SMB Digitalization Accelerates
Large enterprises remained the chief spenders in 2025, yet small and micro businesses are on track for a 10.66% CAGR through 2031, lifting their weight in the Asia-Pacific IT Services industry. Government stimulus has been pivotal; Singapore’s SME Go Digital grants subsidize cloud subscriptions and cybersecurity audits, while India’s MSME schemes underwrite ERP and e-commerce integrations.[3]Infocomm Media Development Authority, “SME Go Digital Programme,” IMDA.GOV.SG Software-as-a-service platforms offering subscription-based accounting, inventory, and customer-experience modules eliminate upfront capital hurdles, and service providers are responding with one-invoice bundles that combine cloud tenancy, managed security, and a 24-hour helpdesk. Though average deal sizes remain modest, the sheer volume of SMBs across Asia accelerates overall market expansion.
Medium-sized firms occupy a transitional zone, requiring enterprise-grade resiliency yet constrained by limited in-house IT staff. Partners that provide pre-configured industry templates and managed compliance checks hold an advantage. Large enterprises held 57.74% of revenue in 2025. For large enterprises, the focus has shifted from first-time cloud migration to optimization, FinOps, and AI-enabled service-desk automation, moderating their spending growth but generating high-margin advisory opportunities.
By End-User Industry: Healthcare IT Surges
Healthcare and life sciences lead growth at a 10.27% CAGR as telemedicine, electronic health records, and AI diagnostics become mainstream. Banking, financial services, and insurance accounted for 24.62% of the Asia-Pacific IT Services market in 2025, driven by core-banking and anti-fraud modernization, yet its growth is now steady rather than explosive. Government mandates, such as India’s Ayushman Bharat Digital Mission and Singapore’s National Electronic Health Record, are compelling providers to build interoperable, security-hardened platforms. Vendors specializing in HL7 FHIR integration, identity assurance, and privacy-preserving analytics are thriving.
Manufacturing continues to allocate budgets to predictive maintenance and supply-chain visibility, leveraging 5G and industrial IoT to minimize downtime. Retail and e-commerce firms are adopting headless commerce architectures to enable hyper-personalized marketing, while telecom carriers pivot toward 5G network orchestration, driving demand for cloud-native OSS/BSS transformation. Energy utilities invest in smart-grid telemetry and carbon-footprint reporting, aligning IT roadmaps with net-zero pledges. Collectively, these vertical dynamics diversify revenue sources for providers and reduce concentration risk, supporting resilient growth across the Asia-Pacific IT Services market.
Geography Analysis
China held 28.74% of the Asia-Pacific IT Services market in 2025, reflecting massive enterprise demand and state-driven digitalization. Domestic hyperscalers Alibaba Cloud, Tencent Cloud, and Huawei Cloud continue to expand in-country regions, reinforcing data-sovereignty insularity. Yet annual growth is moderating as regulatory burdens slow foreign participation and the economy approaches digital-infrastructure saturation. In contrast, India is poised for a 10.43% CAGR through 2031 as it balances global outsourcing leadership with a booming internal market. Domestic banks, retailers, and healthcare providers are ramping cloud and AI investments, while export revenue from IT and business-process services surpassed USD 199 billion in fiscal 2024.
Japan’s steady expansion stems from Digital Agency-orchestrated interoperability and cybersecurity reforms, though legacy mainframes and demographic constraints temper spending velocity. South Korea’s USD 160 billion Digital New Deal underwrites smart-factory and AI R&D, benefiting integrators that can embed 5G, edge AI, and cloud analytics. Indonesia’s digital-economy roadmap targets USD 360 billion by 2030, and hyperscalers have announced multi-billion-dollar data-center investments to support e-commerce and fintech growth.
Malaysia’s MyDIGITAL blueprint and cloud-first mandates accelerate migration across government and regulated industries, with Amazon Web Services pledging USD 6.2 billion for local regions that satisfy residency rules. Singapore continues to spend heavily per capita, leveraging its Smart Nation program to digitize healthcare, transport, and citizen services. Taiwan’s semiconductor ecosystem invests in Industry 4.0 to maintain manufacturing leadership, while Australia’s Digital Economy Strategy channels funds into cybersecurity hardening and data-governance modernization.[4]Department of Industry, “Digital Economy Strategy,” INDUSTRY.GOV.AU Emerging markets such as Vietnam, the Philippines, and New Zealand contribute incremental momentum as public-sector cloud adoption and SME digitization gather pace, rounding out a geographically diversified growth profile for the Asia-Pacific IT Services industry.
Competitive Landscape
The Asia-Pacific IT Services market remains moderately fragmented. Indian leaders Tata Consultancy Services, Infosys, Wipro, HCL Technologies, and Tech Mahindra continue to capture large transformation deals, leveraging scale and domain expertise. Global integrators Accenture, Capgemini, Cognizant, and the Big Four consulting brands compete on innovation velocity, evidenced by over 1,200 AI and cloud patents disclosed by Accenture in 2024. Hyperscalers Amazon Web Services, Google Cloud, and Microsoft Azure invest billions in regional data centers to secure infrastructure-as-a-service margins and cross-sell analytics, AI, and cybersecurity bundles.
In China, Alibaba Cloud, Tencent Cloud, and Huawei Cloud dominate sovereign-cloud workloads, benefiting from policy preferences and deep ecosystem integration. Japanese incumbents NTT DATA, Fujitsu, NEC, and Hitachi Vantara are repositioning around AI-powered managed services, deploying proprietary platforms to defend domestic share. South Korean conglomerates Samsung SDS and LG CNS extend cloud and systems-integration practices, while regional specialists Singtel NCS, PCCW Solutions, Datacom, and Viettel Group excel in public-sector and telecom verticals, capitalizing on local procurement norms.
Mergers and acquisitions remain active as vendors pursue higher-margin niches and geographic reach. Recent examples include cloud-security boutiques absorbed by large integrators to bolster zero-trust portfolios, and edge-analytics startups acquired to address manufacturing 5G use cases. White-space persists among mid-market clients that require packaged solutions without global-provider price tags. Providers offering vertical micro-solutions such as logistics visibility, fintech fraud detection, and decarbonization analytics are gaining traction, exploiting gaps left by mega-vendors focused on Fortune 500 accounts. Intellectual-property ownership, multi-cloud orchestration skill sets, and data-residency compliance frameworks continue to serve as primary differentiators in competitive tenders throughout the Asia-Pacific IT Services market.
Asia Pacific IT Services Industry Leaders
Accenture plc
Tata Consultancy Services Ltd.
Infosys Ltd.
Wipro Ltd.
HCL Technologies Ltd.
- *Disclaimer: Major Players sorted in no particular order

Recent Industry Developments
- December 2025: Amazon Web Services confirmed a USD 6.2 billion commitment to expand data-center capacity in Malaysia through 2038, aligned with the nation’s cloud-first strategy.
- November 2025: Tata Consultancy Services earmarked USD 1 billion to enhance AI, cloud, and cybersecurity offerings across Asia-Pacific, unveiling new delivery centers in Thailand, Vietnam, and the Philippines.
- October 2025: Microsoft Azure pledged USD 1.7 billion for Indonesian data-center infrastructure and cloud-skills training for 2.5 million citizens.
- September 2025: Infosys expanded its Bangalore campus to host 25,000 additional personnel focused on digital-transformation delivery.


Research Methodology Framework and Report Scope
Market Definitions and Key Coverage
Our study defines the Asia-Pacific IT services market as the annual spend that enterprises and public entities devote to external providers for consulting, implementation, outsourcing, support, and managed cloud or X-as-a-Service offerings that help create, operate, or optimize information systems. Spend is tracked in USD value terms across eleven major APAC economies and four service families (consulting and integration, IT outsourcing, business process services, and managed/hosted cloud).
Scope exclusion: stand-alone software license sales and telecom carriage revenues are not counted.
Segmentation Overview
- By Service Type
- IT Consulting and Implementation
- IT Outsourcing (ITO)
- Business-Process Outsourcing (BPO)
- Managed Cloud and XaaS
- Support, Maintenance and Other Services
- By Deployment Model
- On-premises / Captive
- Public Cloud
- Private Cloud
- Hybrid / Multi-cloud
- By Enterprise Size
- Large Enterprises
- Medium-sized Businesses
- Small and Micro Businesses
- By End-user Industry
- Banking, Financial Services and Insurance (BFSI)
- Manufacturing and Industrial
- Government and Public Sector
- Healthcare and Life Sciences
- Retail, E-Commerce and Consumer Goods
- Telecom and Media
- Transportation and Logistics
- Energy and Utilities
- Other End-user Industries
- By Country
- China
- India
- Japan
- South Korea
- Indonesia
- Malaysia
- Singapore
- Taiwan
- Thailand
- Australia
- Rest of Asia-Pacific
Detailed Research Methodology and Data Validation
Primary Research
Mordor analysts interviewed regional CIOs, cloud procurement heads, and delivery-center managers across China, India, Australia, and ASEAN, then validated assumptions in follow-up surveys with mid-sized manufacturers and banks. These conversations clarified price realizations, utilization shifts, and country-specific regulation impacts that documents rarely expose.
Desk Research
We began with region-level ICT expenditure series from sources such as the World Bank, International Telecommunication Union, national statistics bureaus (e.g., MIIT-China, METI-Japan), and trade bodies like the Asia Cloud Computing Association, which supplied baseline spend pools and growth signals. Company 10-Ks, investor decks, tender portals, and news captured through Dow Jones Factiva and D&B Hoovers enriched deal values, contract wins, and provider financials. Academic journals and patent databases (Questel) clarified emerging tech demand. The references noted here are illustrative; many additional publications supported data gathering and sense-checks.
Market-Sizing and Forecasting
A top-down model converted national IT spend into serviceable spend using indicators such as: 1) public-cloud revenue share of enterprise IT budgets, 2) offshore delivery center utilization rates, 3) wage-index movement for senior IT labor, 4) SME managed-service penetration, and 5) government digital-transformation outlays. Provider roll-ups and sampled ASP x volume checks delivered selective bottom-up mirrors that anchored totals. Multivariate regression, blending GDP growth, cloud-capex curves, and tech-talent supply, generated the 2025-2030 outlook; gaps in country data were bridged by nearest-neighbor ratios validated in expert calls.
Data Validation and Update Cycle
Outputs undergo variance checks against independent benchmarks, peer review by a senior analyst, and anomaly flags before sign-off.
Reports refresh annually, with interim updates when material events, such as policy shifts or mega-deals, trigger a re-run of critical variables.
Why Mordor's Asia-Pacific IT Services Baseline Commands Reliability
Published estimates differ because publishers pick different service buckets, geographic cuts, and refresh cadences. By anchoring on clearly documented variables and rechecking with live market voices, Mordor provides a balanced midpoint buyers can trust.
Key gap drivers include inclusion of distributor mark-ups, varying treatment of captive data-center O&M, and whether smaller ASEAN markets are modeled or assumed.
Benchmark comparison
| Market Size | Anonymized source | Primary gap driver |
|---|---|---|
| USD 403.17 B (2025) | Mordor Intelligence | - |
| USD 408.5 B (2024) | Regional Consultancy A | Includes on-prem hardware support and counts earlier year without currency realignment |
| USD 340 B (2025) | Trade Journal B | Covers only proactive managed services in five core economies; excludes cloud advisory spend |
In sum, the disciplined mix of transparent scope choices, dual-track modeling, and yearly refreshes lets decision-makers rely on Mordor's figures as the most reproducible baseline for strategic planning.


Key Questions Answered in the Report
What is the expected value of the Asia-Pacific IT Services market by 2031?
The market is forecast to reach USD 678.43 billion by 2031, expanding at a 9.06% CAGR.
Which service type is growing fastest in Asia-Pacific IT Services?
Managed cloud and XaaS services are projected to increase at a 10.11% CAGR between 2026 and 2031.
How are sovereign-cloud regulations affecting providers?
Data-residency laws require in-country infrastructure and joint ventures, raising compliance costs but creating demand for localized cloud services.
Why is healthcare a high-growth vertical for IT services in Asia-Pacific?
Telemedicine rollouts, electronic health record mandates, and AI diagnostics are driving a 10.27% CAGR in healthcare and life-sciences spending.
Which country will post the fastest IT-services growth in Asia-Pacific?
India is expected to lead with a 10.43% CAGR from 2026 to 2031, supported by both export revenue and domestic digital adoption.
What are the main challenges limiting market growth?
Talent shortages, rising wages, and escalating cybersecurity compliance costs are dampening near-term expansion despite strong demand.
Page last updated on:


