
Market Overview
| Study Period | 2020 - 2031 |
|---|---|
| Forecast Data Period | 2026 - 2031 |
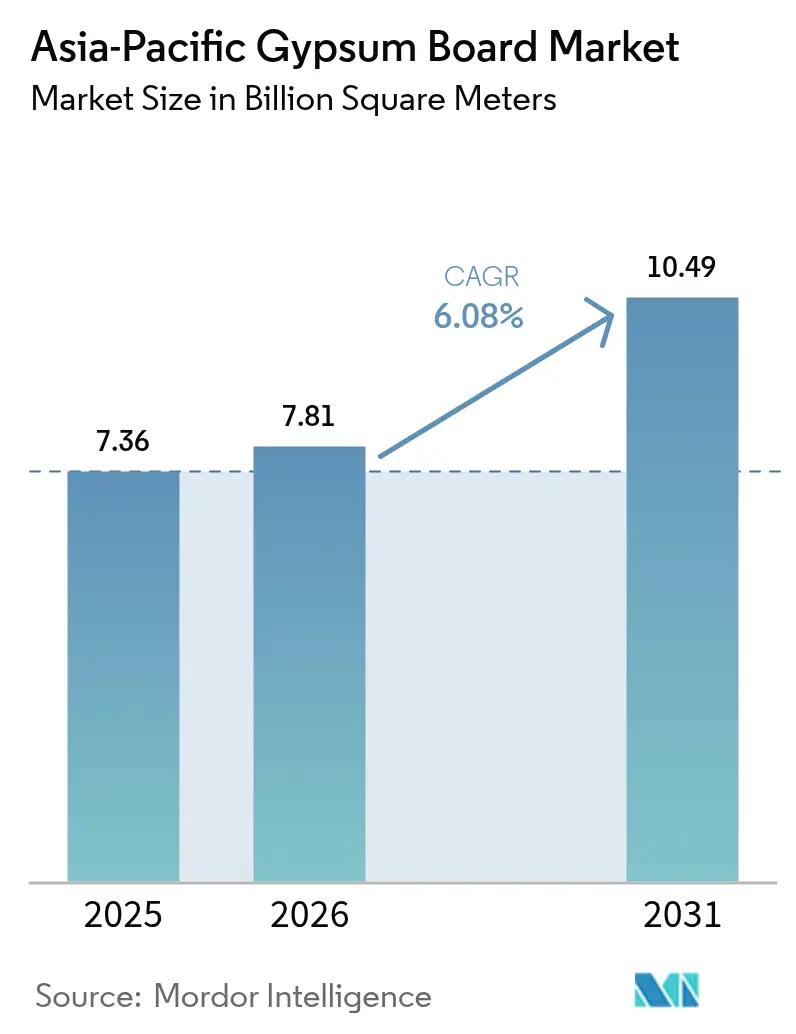
| Base Year Market Size (2025) | 7.36 Billion square meters |
| Market Volume (2026) | 7.81 Billion square meters |
| Market Volume (2031) | 10.49 Billion square meters |
| Growth Rate (2026 - 2031) | 6.08 % |
| Market Concentration | Medium |
Major Players *Disclaimer: Major Players sorted in no particular order Image © Mordor Intelligence. Reuse requires attribution under CC BY 4.0. | |
Asia-Pacific Gypsum Board Market Analysis by Mordor Intelligence
Asia-Pacific Gypsum Board Market size in 2026 is estimated at 7.81 billion square meters, growing from 2025 value of 7.36 billion square meters with 2031 projections showing 10.49 billion square meters, growing at 6.08% CAGR over 2026-2031. Robust building activity in China, India, and fast-growing Southeast Asian economies sustains this uptrend as developers favor lightweight, fire-resistant interior partitions. Demand concentrates in high-rise residential towers and government-funded public facilities where speed of erection, structural weight limitations, and stricter fire codes make gypsum board the default wall and ceiling substrate. Pre-decorated variants extend the Asia-Pacific gypsum board market into renovation work that prizes minimal site disruption, while thicker 5/8-inch panels win share in projects governed by enhanced acoustic and fire-rating requirements. Material innovations that combat humidity and lower embodied carbon reinforce the competitive edge of board producers that can certify performance through recognized green-building schemes.
Key Report Takeaways
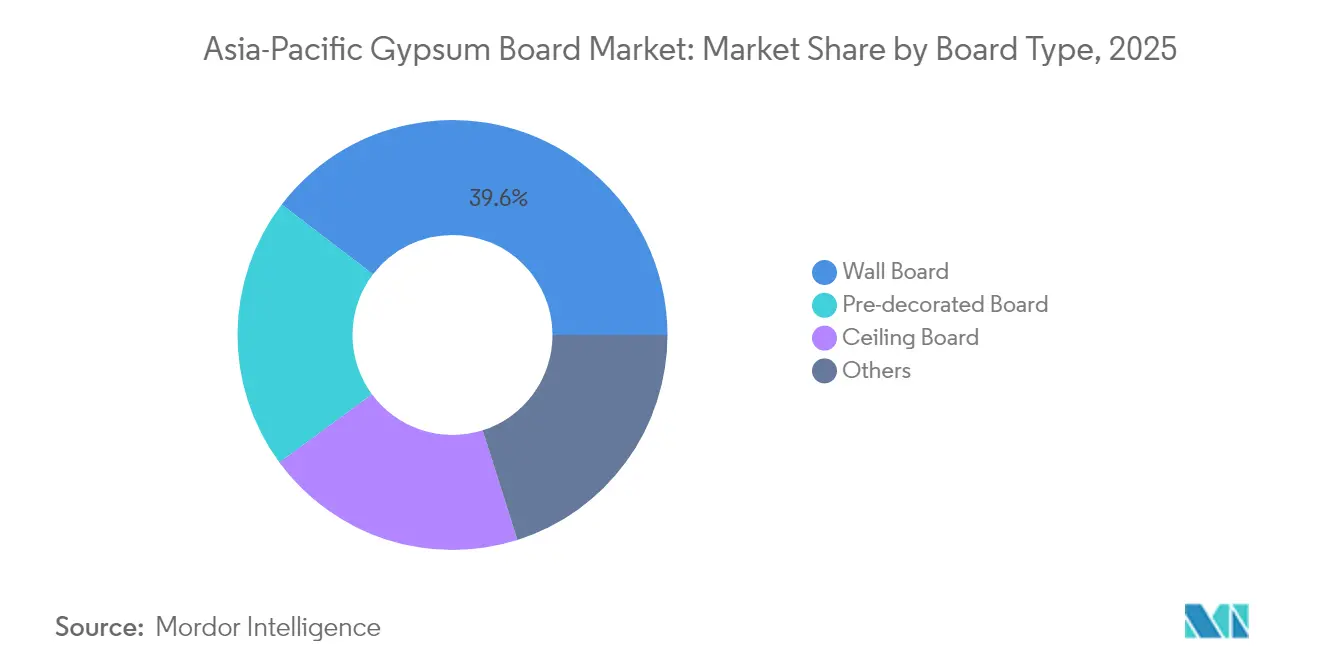
- By board type, wall board held the leading 39.62% Asia-Pacific gypsum board market share in 2025 while pre-decorated board is projected to register the fastest 6.78% CAGR through 2031.
- By thickness, the 1/2-inch category accounted for 52.61% of the Asia-Pacific gypsum board market size in 2025, whereas 5/8-inch panels are advancing at a 6.72% CAGR to 2031.
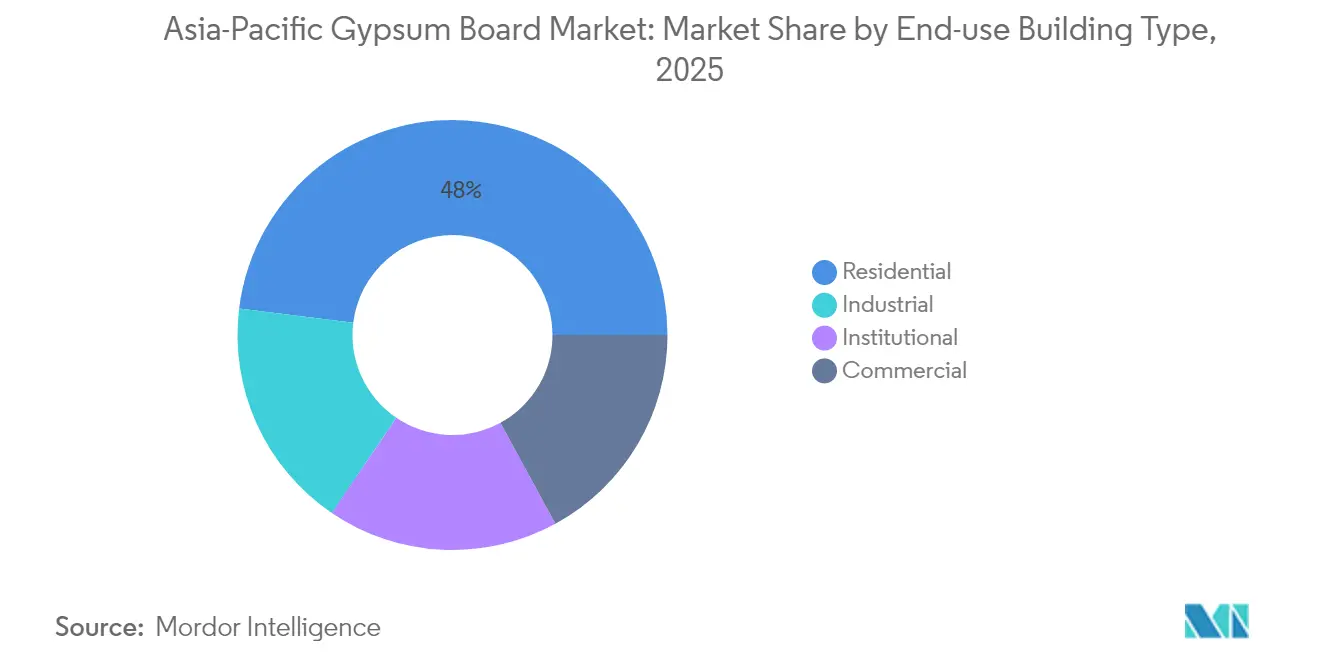
- By end-use, residential construction represented 48.03% of the Asia-Pacific gypsum board market size in 2025, and institutional projects are forecast to expand at a 6.94% CAGR through 2031.
- By geography, China commanded a 33.12% Asia-Pacific gypsum board market share in 2025 and is expected to grow at a 7.55% CAGR to 2031.
Note: Market size and forecast figures in this report are generated using Mordor Intelligence’s proprietary estimation framework, updated with the latest available data and insights as of 2026.
Asia-Pacific Gypsum Board Market Trends and Insights
Drivers Impact Analysis*
| Drivers | (~) % Impact on CAGR Forecast | Geographic Relevance | Impact Timeline |
|---|---|---|---|
| Rapid urbanization and residential construction boom | +1.8% | China, India, Vietnam, Indonesia core markets | Long term (≥ 4 years) |
| Government-led affordable-housing and infrastructure programs | +1.5% | China, India, Thailand, Philippines priority regions | Medium term (2-4 years) |
| Adoption of lightweight dry-construction techniques | +1.2% | Japan, South Korea, Australia early adopters, spreading to Southeast Asia | Medium term (2-4 years) |
| Demand for energy-efficient and fire-resistant interiors | +0.9% | Global, with early gains in Japan, Singapore, Hong Kong | Short term (≤ 2 years) |
| Notable growth in renovation projects | +0.7% | Japan, Australia mature markets, China tier-1 cities | Short term (≤ 2 years) |
| Source: Mordor Intelligence | |||
Rapid Urbanization and Residential Construction Boom
China, India, Vietnam, and Indonesia continue to add millions of urban residents every year, and the resulting demand for multifamily housing sustains bulk procurement of gypsum board for interior partitions[1]National Development and Reform Commission, “Report on the Implementation of the 2023 Plan for National Economic and Social Development and on the 2024 Draft Plan,” npcobserver.com . Developers prefer standardized dry-wall systems because they cut structural loads and accelerate floor turnover. Local authorities in secondary Chinese cities promote vertical density rather than horizontal sprawl, concentrating demand around transit hubs that rely on fire-rated wall assemblies. Similar verticalization appears in Ho Chi Minh City and Jakarta, where quick-build apartment towers shorten delivery cycles amid land-price inflation. Gypsum board adoption benefits as contractors phase out labor-intensive brickwork to mitigate skilled-mason shortages. Long-term demographic forecasts point to continued migration into peri-urban zones, supporting steady volume growth in the Asia-Pacific gypsum board market.
Government-Led Affordable Housing and Infrastructure Programs
Public spending packages earmarked for low-cost housing in China and India guarantee a baseline of unit starts that consume commodity wallboard even when commercial real-estate cycles soften. Subsidy frameworks typically fix maximum material cost per square meter, forcing suppliers to optimize production and logistics efficiencies. While budget ceilings limit penetration of premium finishes, safety clauses require fire- and moisture-resistant panels in corridors, stairwells, and wet areas. Green building mandates that all new Chinese projects meet at least one star under the ESGB system from 2025 onward, raising demand for low-emission formulations that satisfy cost caps. In Thailand and the Philippines, stimulus packages linked to post-pandemic recovery accelerate school and hospital projects that specify certified gypsum solutions.
Adoption of Lightweight Dry-Construction Techniques
Escalating labor costs in Japan and South Korea push contractors toward factory-made interior kits that slot together onsite, shaving up to 40% of man-hours compared with masonry methods. Southeast Asia follows suit as rising minimum wages and migrant-labor shortages drive interest in panelized systems. Codes are updating to recognize gypsum wall assemblies for structural separation, unlocking previously restricted mid-rise applications. Integrated packages that bundle boards, accessories, and training offer contractors predictable costs and shorter critical paths. Producers that supply complete systems capture a greater share of the Asia-Pacific gypsum board market.
Demand for Energy-Efficient and Fire-Resistant Interiors
A string of urban high-rise fires in 2024 sharpened enforcement of compartmentation rules in Hong Kong and Singapore, lifting demand for 5/8-inch Type X boards certified to withstand two-hour exposure. Rising electricity tariffs also move building owners to specify night-cooling strategies that exploit gypsum’s thermal mass when combined with phase-change materials. Product development now targets dual performance—fire plus energy efficiency—without pricing the panels out of reach for mainstream projects. Manufacturers that document life-cycle carbon reductions win procurement points under ISO 14001-aligned tender frameworks, increasing pull-through volumes.
Restraints Impact Analysis*
| Restraints | (~) % Impact on CAGR Forecast | Geographic Relevance | Impact Timeline |
|---|---|---|---|
| Susceptibility to moisture and mould in humid climates | -0.8% | Southeast Asia tropical regions, coastal China, Philippines, Malaysia | Long term (≥ 4 years) |
| Volatile gypsum and energy costs | -0.6% | Global, with acute impact in import-dependent markets like Japan, Philippines | Short term (≤ 2 years) |
| Competition from potential alternatives | -0.4% | Japan, South Korea, Australia early adopters, spreading to China tier-1 cities | Medium term (2-4 years) |
| Source: Mordor Intelligence | |||
Susceptibility to Moisture and Mould in Humid Climates
Average relative humidity in Kuala Lumpur exceeds 80% for most months, a level at which untreated gypsum readily absorbs water vapor and supports mould colonies. Indoor air-quality concerns have led several Southeast Asian developers to specify magnesium-oxide panels or cement boards for bathrooms and kitchens, diverting demand from standard gypsum. Manufacturers respond with hydrophobic additives and fiberglass facers, yet price premiums and installation learning curves slow adoption in budget housing. Persistent monsoon seasons and intermittent power supply, which curtail de-humidification, sustain this restraint across tropical geographies.
Volatile Gypsum and Energy Costs
Fuel prices spiked in 2024 after coal-supply disruptions in Qinhuangdao, inflating calcination expenses and compressing margins for kilns running on spot cargoes. Japan covers nearly all of its raw gypsum needs through imports, exposing board plants to freight and currency swings. Smaller Philippine mills curtailed output during the price surge, ceding share to integrated multinationals with captive quarries. Capital allocation for new lines was paused until energy markets stabilized, delaying the capacity needed to relieve regional tightness.
*Our forecasts treat driver/restraint impacts as directional, not additive. The impact forecasts reflect baseline growth, mix effects, and variable interactions.
Segment Analysis
By Board Type: Premium Growth in Pre-Decorated Products
Pre-decorated boards captured 6.78% CAGR growth prospects through 2031 as renovation schedules tighten across metro Japan and Australia. Wall board retained 39.62% Asia-Pacific gypsum board market share in 2025, anchoring bulk residential and office builds. Ceiling boards benefit from heightened acoustic requirements in open-plan campuses, while moisture-resistant panels gain favor in hospitality restrooms.
Advances in digital-print laminates and UV-cured coatings enable factory finishes that withstand abrasion during tenant turnover. Contractors reduce trades on site and cut punch-list delays, an advantage that offsets panels’ 30-40% higher unit price. Specialty boards—impact-resistant, lead-lined, or mold-inhibiting—address hospital and data-center niches, extending revenue diversity for suppliers active in the Asia-Pacific gypsum board market.



By Thickness: Codes Elevate 5/8-Inch Demand
The 5/8-inch category is forecast to expand at a 6.72% CAGR as revised high-rise codes in China require longer fire-separation ratings for elevator cores and exit routes. The 1/2-inch variant represented 52.61% of the Asia-Pacific gypsum board market size in 2025, owing to cost sensitivity in mass housing. Other thicknesses serve staggered-stud acoustical walls and multi-layer assemblies in cinemas.
Fire-test protocols increasingly reference performance at elevated temperatures for 120 minutes, pushing architects toward thicker facings or double-layer solutions. Demand also climbs in education facilities where speech intelligibility drives preference for dense panels that dampen low-frequency transmission. Producers retrofit lines with adjustable knife-sets to satisfy mixed runs and preserve yield.
By End-Use Building Type: Institutional Sector Leads Growth
Institutional projects—hospitals, schools, civic centers—are projected to grow at 6.94% CAGR, eclipsing commercial towers in incremental volume. Residential builds still delivered 48.03% of the Asia-Pacific gypsum board market size in 2025, underpinned by China’s ongoing social-housing completions. Commercial retrofits focus on flexible partition systems that keep pace with hybrid-work floor-plate redesigns.
Healthcare investments highlighted by China’s 14th Five-Year Health Plan stipulate mold resistance and clean-room compliant finishes, steering orders toward high-spec boards. Education ministries in India and Indonesia prioritize low-VOC interiors to improve learning outcomes, opening doors for suppliers that certify emissions below 0.5 mg/m²·h. Industrial demand remains a smaller slice, confined to battery plants and semiconductor fabs requiring non-combustible liners.
Geography Analysis
China held 33.12% of the Asia-Pacific gypsum board market in 2025 and is on pace for a 7.55% CAGR, helped by a USD 27.7 billion infrastructure allocation that keeps metro rail, social housing, and hospital pipelines active. Regulators tighten green-building codes, shifting preference toward boards with recycled content documentation. India emerges as the second-largest buyer as urban migration sustains multi-family starts; implementation of the National Building Code 2025 will further institutionalize fire-rated wall assemblies.
Japan’s mature stock pivots to refurbishment, emphasizing pre-decorated products that curtail tenant downtime. South Korea enforces advanced acoustic and thermal standards, supporting demand for higher-density gypsum composites in premium offices and data centers. Thailand, Vietnam, Indonesia, and the Philippines deliver double-digit volume gains as middle-class homeownership expands. Humid climate conditions in these markets elevate interest in fiberglass-faced panels resistant to mold proliferation.
Australia and New Zealand round out developed-economy demand, leveraging strict energy-efficiency mandates that reward high-recycled-content boards. The Rest of Asia-Pacific—Bangladesh, Pakistan, Sri Lanka, and Cambodia—presents nascent opportunities tied to industrial-park investments and donor-funded public facilities. Distribution reach and technical training remain constraints that global players address through joint ventures with local distributors.
Value Chain Analysis
The gypsum board value chain in Asia-Pacific starts with upstream raw materials, primarily natural gypsum and synthetic gypsum (including FGD gypsum), along with kraft paper liners, additives (starch, glass fiber, foaming agents), and energy for drying and calcination. Because gypsum boards carry a high weight-to-value profile, bulk raw gypsum movements in import-dependent markets rely heavily on maritime logistics, while rail and trucking dominate inbound feedstock flows and finished-board distribution into metro construction clusters. Energy price spikes and localized coal or power constraints can quickly raise kiln operating costs and disrupt throughput.
Midstream activities include gypsum calcination, board forming and continuous drying, and finishing work such as pre-decorated lamination or coatings. Systems bundling, including boards with metal framing and jointing compounds, also supports dry-construction adoption. Manufacturers and large contractors are increasingly shortening supply routes through regional sourcing and, where feasible, backward integration into gypsum and paper-liner procurement to stabilize costs and availability. Downstream, distribution is led by direct-to-project supply for high-volume residential and institutional builds, with dealer networks serving renovation demand, where pre-decorated boards reduce onsite trades and help accelerate turnover.
Competitive Landscape
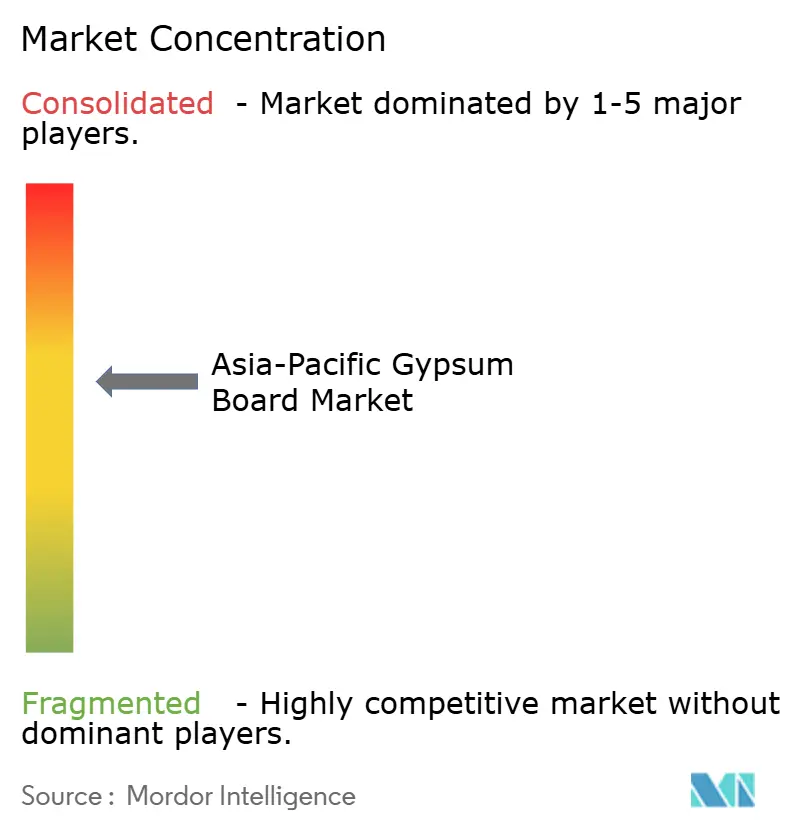
The Asia-Pacific gypsum board market remains moderately fragmented. Suppliers invest in smart kilns equipped with optical in-line scanners that cut reject rates below 4%. Energy cost volatility encourages conversions from coal to biomass or solar-assisted calcination, lowering Scope 1 emissions and unlocking ESG-linked financing. Product innovation centers on hydrophobic cores, phase-change microcapsules, and bio-based binders that shrink embodied carbon footprints. Market consolidation accelerates when mid-tier producers confront gypsum-ore supply constraints or struggle to fund environmental upgrades. Multinationals with balanced sheet strength acquire those assets for strategic entry into underserved provincial pockets. Partnerships with wall-framing system makers increase pull-through, positioning full-solution providers to capture additional market slices.
Asia-Pacific Gypsum Board Industry Leaders
Beijing New Building Material (BNBM)
Saint-Gobain
Knauf Group
Yoshino Gypsum Co., Ltd.
CSR Ltd
- *Disclaimer: Major Players sorted in no particular order

Market Opportunities and Future Outlook
White-space in the region clusters around (1) moisture- and mold-resistance upgrades for tropical Southeast Asian climates, (2) higher fire-rating and acoustic assemblies that favor thicker formats and certified systems, and (3) lower-embodied-carbon product lines aligned with procurement requirements in public and institutional projects. This opportunity is becoming more execution-led as producers invest in localized capacity and alternative gypsum feedstocks. For example, Balrampur Chini Mills approved a lactogypsum processing plant at Kumbhi, Uttar Pradesh, with capacity of about 7.6 million gypsum boards per year (April 2026), and Saint-Gobain India commissioned a near-net zero gypsum ceiling tiles plant in Visakhapatnam with 5 million square meters of annual capacity (March 2026).
A second opening is the shift toward circular-economy and integrated industrial-by-product utilization models that can reduce raw-material volatility while meeting sustainability-linked customer requirements. The June 2026 groundbreaking by Oriental Yuhong for a circular-economy gypsum board base in Shaoguan, Guangdong, built around an integrated power plant and building materials model for solid-waste utilization, shows how new supply is being structured around waste-to-material loops. For builders and distributors, these moves improve access to specialty boards (fire-rated, moisture-resistant, pre-finished) and make system-based selling, such as boards plus accessories and installation training, a more practical way to differentiate beyond commodity wallboard.
Recent Industry Developments
- July 2026: Saint-Gobain inaugurated a new plasterboard manufacturing plant in Kaiping, Guangdong Province, China, with annual capacity of 64 million square meters. The added capacity strengthens local supply for high-volume interior partition demand and reduces reliance on long-distance shipments into South China. It also increases competitive pressure on regional producers that compete on delivery speed and consistent board quality.
- September 2025: Knauf Group in India launched the GIFAfloor System, a gypsum panel-based flooring system positioned as an alternative to wet construction. The move broadens Knauf's gypsum-based solutions portfolio beyond wall and ceiling boards and supports faster, dry-construction project cycles. It also increases pull-through potential for complementary gypsum and finishing products on the same sites.
- August 2024: Turner & Townsend highlighted ongoing efforts to rebuild construction supply chains in Asia, emphasizing regionalization and supplier diversification to manage logistics volatility. For gypsum board producers and distributors, this supports the shift toward nearer-to-demand manufacturing footprints and more resilient inbound sourcing for gypsum, paper liners, and energy-intensive inputs. The same dynamics influence procurement practices on large residential and institutional projects that prioritize delivery reliability.


Research Methodology Framework and Report Scope
Market Definition and Coverage
This market covers gypsum board demand across Asia-Pacific, counted as the finished boards used for interior building systems such as walls and ceilings, and measured by installed area over the study period.
Scope exclusions: The sizing does not include gypsum plaster, jointing compounds, insulation layers, or downstream finishing services like painting and flooring.
Segmentation Overview
- By Board Type
- Wall Board
- Ceiling Board
- Pre-decorated Board
- Others
- By Thickness
- 1/2-inch
- 5/8-inch
- Other Thicknesses
- By End-use Building Type
- Residential
- Commercial
- Institutional
- Industrial
- By Geography
- China
- India
- Japan
- South Korea
- Thailand
- Philippines
- Vietnam
- Indonesia
- Malaysia
- Australia and New Zealand
- Rest of Asia-Pacific
Data Sources, Market Sizing, and Validation
Desk Research
Desk research was used to set the regional demand context and build clean assumptions on construction activity, materials use, and trade flows. We mainly relied on public datasets such as national statistics offices for building completions, building permits, and housing starts, which helps indicate where interior fit-out demand is moving.
To make the model more grounded, we also reviewed sources such as UN Comtrade for gypsum, paper, and board-related trade codes, building code and standards bodies for fire rating and drywall adoption patterns, and energy and environmental agencies that publish data tied to construction cycles and retrofit programs. Company annual reports, investor presentations, and reputable industry news were used to understand capacity additions, plant utilization commentary, and channel mix at a practical level. In a few places, paid databases were referenced only for company financials and shipment-level checks on import and export flows to sense direction and validate unusually large swings. The examples above are indicative, and many additional sources were reviewed to collect data, validate assumptions, and clarify open questions.
Primary Interviews and Surveys
Primary work was used to pressure-test the desk assumptions around how fast drywall is being adopted, how board thickness mixes shift by project type, and where pricing or supply constraints are changing buying behavior. We spoke with manufacturers, distributors, contractors, and specifiers across key Asia-Pacific construction markets so demand signals could be cross-checked across both supply and installation viewpoints.
Distribution of primary research fieldwork respondents
| Company type | Respondent position |
|---|---|
| Top tier: 26% | CXOs: 17% |
| Mid tier: 56% | Functional/Unit leaders: 24% |
| Smaller Players: 18% | Managers: 59% |
Market-Sizing & Forecasting
The core sizing logic uses a top-down build that reconstructs gypsum board area demand from construction activity and drywall penetration in interior partitions and ceiling applications, and then it is shaped by country-level normalization. We start with residential and non-residential construction indicators, and once these demand pools are built, conversion factors are applied to translate floor area and fit-out intensity into gypsum board square meters.
Key inputs used in the model include new build versus renovation split, urban housing completions, commercial floor space additions, drywall penetration versus masonry in interior walls, and average board usage per square meter by application (influenced by thickness mix and waste factors). Since the market is tracked in area terms, we also watch capacity additions and utilization commentary, import dependency for paper facing and gypsum inputs, and seasonality tied to construction cycles to keep the quarterly pattern consistent.
Forecasts were developed using scenario analysis, where construction outlooks and penetration trajectories are adjusted by country and then reviewed with primary inputs on project pipelines and specification shifts. Bottom-up approximations were used selectively, including sampled supplier capacity checks, channel checks on installation volumes, and price and mix logic to confirm that area growth does not exceed what manufacturing and trade flows can reasonably support. Where local data gaps existed, proxy indicators from similar markets were applied first, and then adjusted after expert feedback and variance checks.
Data Validation & Update Cycle
Validation is done through multiple checks so the final outputs align with real market signals. We compare the model results against independent indicators such as construction output trends, trade movements, and known capacity changes, and any large variances are investigated before numbers are finalized.
If an assumption creates an unusual jump in a country trend, it is re-checked, and targeted follow-ups are triggered with respondents to confirm whether the change is structural or temporary. A second analyst review is done to verify formulas, unit consistency, and country roll-ups, followed by a final review to confirm that conclusions match the data trail. Reports are refreshed annually, with interim updates when major events occur, and a final pre-delivery scan is completed so clients receive the latest view.
Mordor Intelligence's Asia Pacific Gypsum Board Market Sizing Compared With Other Published Estimates
Published market sizes for gypsum board in Asia-Pacific often do not match because each publisher uses a different unit of measurement, scope boundary, and time base. The biggest split usually comes from whether the estimate is built in value or in installed area, and whether the geography is full Asia-Pacific or only a set of large countries.
By tracking installed square meters and then checking scope boundaries country by country, Mordor Intelligence keeps the estimate tied to board consumption signals, while some sources combine value and volume logic or include adjacent products like plasterboard alternatives and related finishing layers.
Benchmark comparison
| Source | Market Size | Gaps in Research Methodology |
|---|---|---|
| Mordor Intelligence | USD 7.81 B (2026) | |
| Global Consultancy A | USD 18.40 B (2023) | Reported in USD value and anchored to a different base year, so price assumptions and country coverage can expand totals relative to an area-based demand build. |
| Industry Brief B | USD 7.20 B (2023) | Covers plasterboard and alternatives in value terms, which can shift the counted product scope and mix versus a pure gypsum board area methodology. |
The spread in the table is mainly explained by unit choice and category boundaries, followed by base-year timing and how pricing is assumed to move. When the sizing steps stay consistent around construction activity, penetration, and realistic conversion factors, the market total becomes easier to reproduce and simpler to audit over time.


Key Questions Answered in the Report
What is the current size of Asia-Pacific gypsum board demand?
Volume reached 7.81 billion m² in 2026 and is forecast to climb to 10.49 billion m² by 2031.
How fast will Asia-Pacific gypsum board sales grow through 2031?
Regional sales are projected to expand at a 6.08% CAGR over the 2026–2031 period.
Which board type is expanding the quickest in Asia-Pacific construction?
Pre-decorated gypsum board is the fastest-growing category, set to post a 6.78% CAGR as renovation projects favor ready-finished panels.
Why is 5/8-inch gypsum board gaining traction across high-rise projects?
Stricter fire-safety and acoustic codes in dense urban areas favor the thicker 5/8-inch format, which is forecast to advance at a 6.72% CAGR.
Which end-use building segment shows the strongest growth for gypsum board in Asia-Pacific?
Institutional facilities—hospitals, schools, and public buildings—are expected to record the highest 6.94% CAGR through 2031.
Page last updated on:


 Your data is secure and never sold or shared.


