
Market Overview
| Study Period | 2021 - 2031 |
|---|---|
| Forecast Data Period | 2026 - 2031 |
| Base Year Market Size (2025) | USD 1.05 Billion |
| Market Size (2026) | USD 1.15 Billion |
| Market Size (2031) | USD 1.83 Billion |
| Growth Rate (2026 - 2031) | 9.74 % |
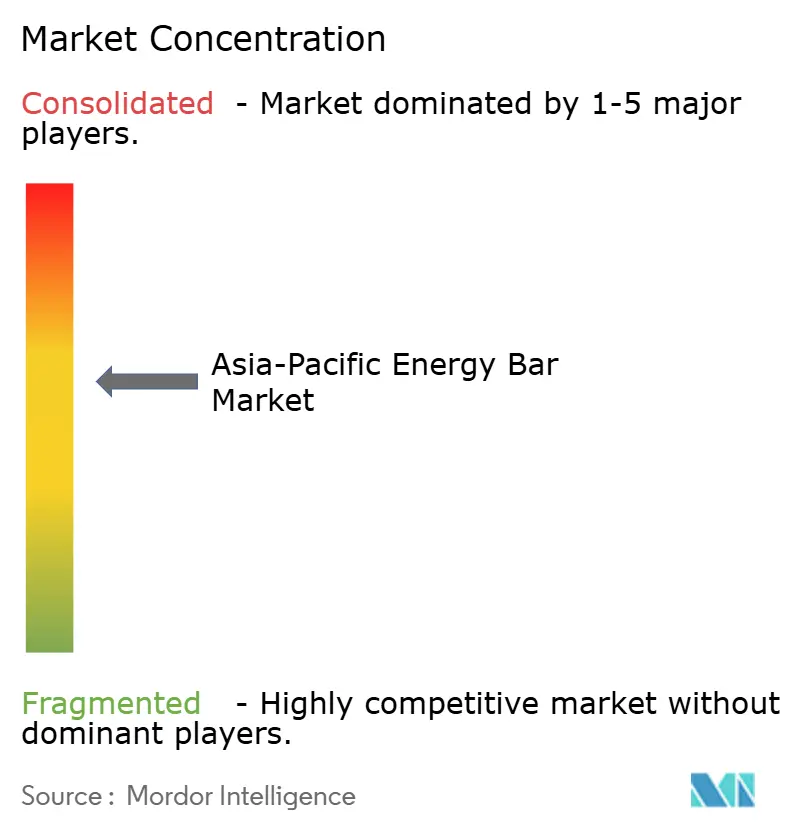
| Market Concentration | Medium |
Major Players *Disclaimer: Major Players sorted in no particular order Image © Mordor Intelligence. Reuse requires attribution under CC BY 4.0. | |
Asia-Pacific Energy Bar Market Analysis by Mordor Intelligence
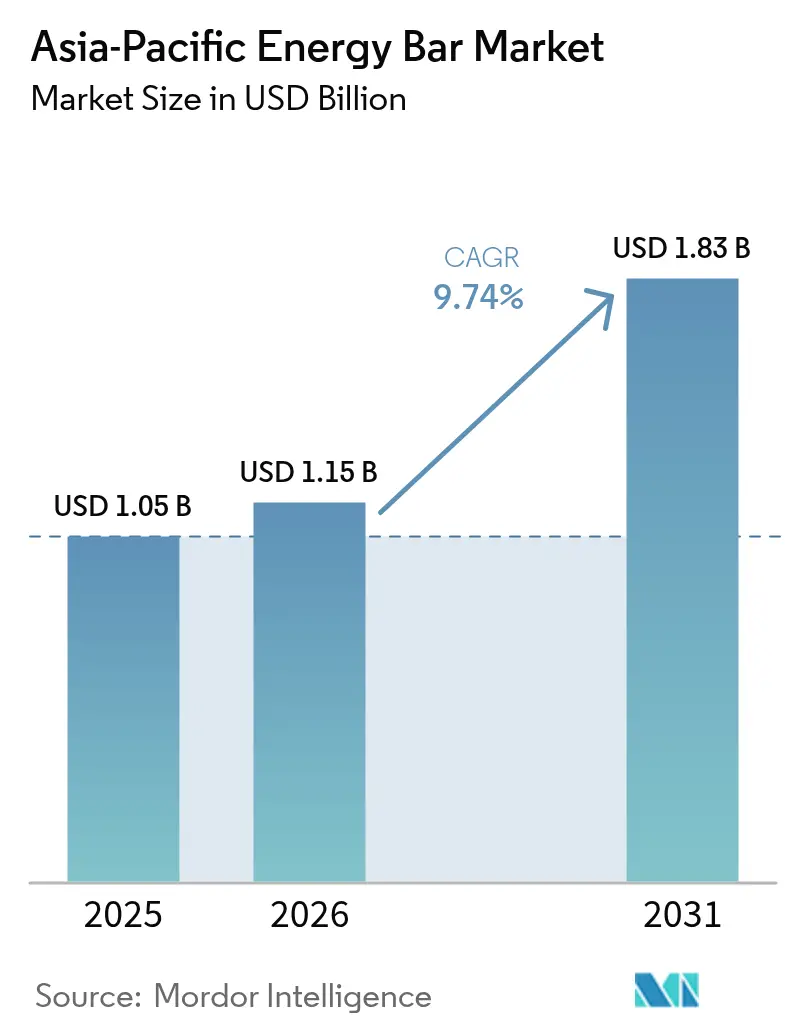
The Asia-Pacific energy bar market size was valued at USD 1.05 billion in 2025 and estimated to grow from USD 1.15 billion in 2026 to reach USD 1.83 billion by 2031, at a CAGR of 9.74% during the forecast period (2026-2031). This represents a strong CAGR of 9.86%, which surpasses the growth rates of many other packaged-food segments in the region. The market's rapid expansion is driven by several key factors, including the increasing urban population, longer working hours, the rising disposable income of the middle class, growing health consciousness, and a heightened demand for convenient and nutritious food options. The market benefits from a surge in fitness participation across the region, which has led to greater demand for energy bars as a quick and healthy snack option. Additionally, companies are actively reformulating their products to align with consumer preferences for low-sugar and protein-rich snacks, while regulatory frameworks are increasingly favoring such healthier alternatives. These factors collectively create a favorable environment for market growth. Multinational corporations are demonstrating confidence in the market's potential by investing in automated manufacturing facilities in key countries such as China, India, and Indonesia. These investments not only enhance production efficiency but also indicate a long-term commitment to scaling operations in the region. Furthermore, the integration of regionally sourced ingredients, such as soy isolates from Japan and nuts from Southeast Asia, helps reduce supply-chain risks and ensures a steady supply of raw materials. The trend of premiumization is unlocking additional revenue streams, as consumers in markets like Japan, South Korea, and urban China are increasingly willing to pay a premium for energy bars that feature clean-label claims, organic ingredients, and functional health benefits. This willingness to invest in high-quality products supports sustained profitability for manufacturers, even in the face of fluctuating commodity prices. Overall, these dynamics position the Asia-Pacific energy bar market for robust growth and long-term success.
Key Report Takeaways
- By product type, protein-rich bars held 42.19% of the energy bar market share in 2025, and fruit-and-nut bars are forecast to expand at a 9.93% CAGR to 2031.
- By flavor profile, chocolate-based variants accounted for 51.88% of 2025 revenue, while fruit flavors are on course for the fastest 10.09% CAGR through 2031.
- By price tier, the mass segment represented 72.64% of 2025 sales, and the premium segment is projected to grow at a 10.21% CAGR to 2031.
- By distribution channel, supermarkets and hypermarkets delivered 41.72% of the 2025 value, yet online retail is projected to lead with a 10.49% CAGR to 2031.
- By geography, China commanded 34.87% revenue in 2025, whereas India is set for the highest 10.72% CAGR over the forecast horizon.
Note: Market size and forecast figures in this report are generated using Mordor Intelligence’s proprietary estimation framework, updated with the latest available data and insights as of 2026.
Market Trends and Insights
Drivers Impact Analysis of Asia-Pacific Energy Bar Market*
| Driver | (~) % Impact on CAGR Forecast | Geographic Relevance | Impact Timeline |
|---|---|---|---|
| Rising health consciousness and demand for convenient nutrition | +2.5% | Global, with strongest uptake in urban China, India, Japan, South Korea | Medium term (2-4 years) |
| Surge in sports and fitness participation and gym memberships | +1.8% | India, China, Southeast Asia core markets; spillover to Australia, New Zealand | Medium term (2-4 years) |
| Surge in on-the-go snacking aligns with busy urban routines | +1.5% | Urban centers across China, India, Japan, South Korea, Singapore, Thailand | Short term (≤ 2 years) |
| Preference for clean-label, natural, and organic ingredients | +1.2% | Japan, South Korea, Australia, urban China and India | Medium term (2-4 years) |
| Growth of plant-based energy bars with regional ingredients | +1.0% | India, Southeast Asia, with early adoption in Japan, Australia | Long term (≥ 4 years) |
| Government initiatives promoting healthy eating habits | +0.8% | Thailand, India, China (national nutrition programs and school feeding schemes) | Long term (≥ 4 years) |
| Source: Mordor Intelligence | |||
Rising health consciousness and demand for convenient nutrition
Urban professionals are increasingly relying on energy bars as convenient meal replacements during their hectic work schedules, prioritizing functional benefits over taste. These health-conscious consumers are not merely looking for any energy bar; they are actively seeking products that align with their health goals and are willing to pay a premium for such offerings. Specifically, 75% of these consumers are prepared to spend more on energy bars that emphasize high-protein content or promote digestive health. This willingness to invest in health-focused products has driven significant changes in the industry. According to the Asia Food and Beverage Alliance (AFBA), as of 2024, an overwhelming 96% of food and beverage companies are reformulating their products to cater to these evolving health demands[1]. Furthermore, consumers are demonstrating a readiness to pay 10-20% higher prices for products with enhanced nutritional profiles. The growing demand for functional foods, particularly those fortified with vitamins, minerals, and bioactive compounds, underscores this trend. This convergence of consumer willingness to invest in health, regulatory support for health claims, and proactive reformulation efforts by manufacturers is creating a sustained demand trajectory. Unlike short-lived health fads, this momentum reflects a deeper, long-term shift in consumer preferences and industry practices.
Surge in sports and fitness participation and gym memberships
The growing fitness culture across the Asia-Pacific region is significantly boosting the demand for protein-rich energy bars. In India, brands such as MuscleBlaze, RiteBite, and Yoga Bar are expanding their presence in the direct-to-consumer nutrition market by utilizing digital-first distribution strategies and influencer partnerships. Gen Z and Millennials are increasingly prioritizing protein content over other nutritional factors. The expansion of fitness centers, health clubs, gyms, and yoga studios across the Asia-Pacific is directly driving the need for portable pre- and post-workout nutrition options, including energy and protein bars. For example, the Australian Bureau of Statistics reported that Australia had 7,313 operational health and fitness centers and gyms in 2024[2]. Energy bars, positioned as key sports nutrition products, offer benefits such as sustained energy, muscle-repairing protein, added fiber, and essential micronutrients, aligning with the performance goals of gym users and athletes. Additionally, gyms and fitness studios serve as crucial retail points for energy bars, often displaying them at reception areas or vending machines, effectively converting gym traffic into impulse purchases. The tech-savvy fitness community also favors e-commerce and subscription models for sports nutrition, driving online sales of energy and protein bars through various platforms and brand-specific websites.
Surge in on-the-go snacking aligns with busy urban routines
The Asia-Pacific energy bar market is experiencing growth as busy urban lifestyles drive demand for portable, nutritious, and time-saving food options. Energy bars, known for being compact and shelf-stable, are increasingly perceived as healthier alternatives to traditional impulse snacks. With demanding work schedules and the rise of hybrid work models, many consumers in Asia are adopting snacks to replace or supplement meals, a trend referred to as “snackification.” In this scenario, energy and nutrition bars serve as convenient choices for breakfast, mid-morning, or late-afternoon consumption, offering satiety and energy without requiring preparation. Urban consumers are favoring grab-and-go formats that are easy to consume during transit, at desks, or between meetings. Energy bars, designed with single-serve packaging and minimal mess, meet this need effectively. They provide portion-controlled calories and macros, appealing to individuals focused on managing weight and energy intake while snacking more frequently. According to the World Bank, 66% of China's population lived in urban areas in 2024[3]. As working hours increase in tier-1 and tier-2 cities, meal preparation time is becoming more limited. This trend makes nutrient-dense, shelf-stable bars a practical solution for commuters and office workers.
Preference for clean-label, natural, and organic ingredients
Consumers are increasingly examining ingredient lists with unprecedented scrutiny, driving manufacturers to reformulate their products to align with these elevated expectations or risk losing relevance in the competitive market. This behavioral shift is further supported by significant regulatory developments across major markets. In 2024, Thailand's FDA introduced updated health claim guidelines designed to enhance transparency and ensure accurate product labeling. Likewise, Indonesia's BPOM enforced stricter labeling requirements to build consumer confidence, while China's GB 2760-2024 standard imposed more stringent restrictions on permissible food additives to prioritize safety and compliance. The rising demand for clean-label products has fueled the premiumization of this category, creating a distinctly bifurcated market. Mass-tier brands are struggling with margin pressures as they adapt to these changes, while premium brands and new entrants are leveraging this trend to secure a disproportionate share of the market's value, further intensifying competition.
Restraints Impact Analysis of Asia-Pacific Energy Bar Market*
| Restraint | (~) % Impact on CAGR Forecast | Geographic Relevance | Impact Timeline |
|---|---|---|---|
| Consumer concerns over artificial ingredients and preservatives | -0.5% | Japan, South Korea, and Australia | Short term (≤ 2 years) |
| Lack of awareness about energy bar benefits in rural areas | -0.3% | Rural India, Indonesia, Thailand, Philippines | Medium term (2-4 years) |
| Fluctuating raw material prices disrupt supply chain stability | -0.6% | Singapore, Hong Kong | Short term (≤ 2 years) |
| Stringent health and safety regulations increase operational complexity | -0.4% | India (FSSAI), China (GB standards), Thailand (FDA), Indonesia (BPOM) | Medium term (2-4 years) |
| Source: Mordor Intelligence | |||
Consumer concerns over artificial ingredients and preservatives
Manufacturers are under pressure as regulatory tightening and consumer opposition to artificial additives compel them to reformulate. These adjustments increase costs, squeezing margins and delaying product launches. China's GB 2760-2024 standard imposes stricter limits on permissible food additives, requiring manufacturers to replace synthetic preservatives with natural alternatives that are often more expensive and have shorter shelf lives. In 2024, Hong Kong revised its preservatives regulation, introducing stricter labeling requirements and maximum residue limits for benzoates and sorbates, commonly used in energy bars. The FAO's 2024 State of Commodity Markets report highlighted Asia's status as a net importer of ultra-processed foods. This finding, along with concerns about additive exposure, has prompted governments to enforce stricter import controls. Consumers are increasingly scrutinizing ingredient lists, and products containing artificial additives face immediate rejection, particularly among health-conscious buyers. This trend is especially evident in Japan and South Korea, where transparency is highly valued. Manufacturers in these markets face significant reputational risks if synthetic ingredients are detected. However, the reformulation challenge disproportionately impacts small and mid-sized producers, who lack the R and D resources and supply chain advantages of multinational corporations. This situation creates a competitive advantage for established players in the market.
Fluctuating raw material prices disrupt supply chain stability
Commodity price volatility continues to compress profit margins, compelling manufacturers to make difficult decisions, either absorb the rising costs themselves or pass them on to consumers who are highly sensitive to price changes. According to the OECD-FAO Agricultural Outlook 2024-2033, the demand for nuts and protein ingredients in India and Southeast Asia is projected to grow at a pace that exceeds domestic production capabilities. This imbalance is expected to increase reliance on imports, thereby exposing these markets to greater risks associated with currency fluctuations. Additionally, the prices of soybean oil and palm oil have experienced significant increases, primarily driven by biodiesel mandates in countries such as Brazil, Indonesia, and the United States. These mandates redirect edible oils from food production to fuel production, further tightening supply. Manufacturers that adopt diversified sourcing strategies and implement effective hedging mechanisms are likely to manage this volatility more effectively compared to those that depend heavily on spot markets and single-origin ingredient sources.
*Our forecasts treat driver/restraint impacts as directional, not additive. The impact forecasts reflect baseline growth, mix effects, and variable interactions.
Asia-Pacific Energy Bar Market Segment Analysis
By Product Type:
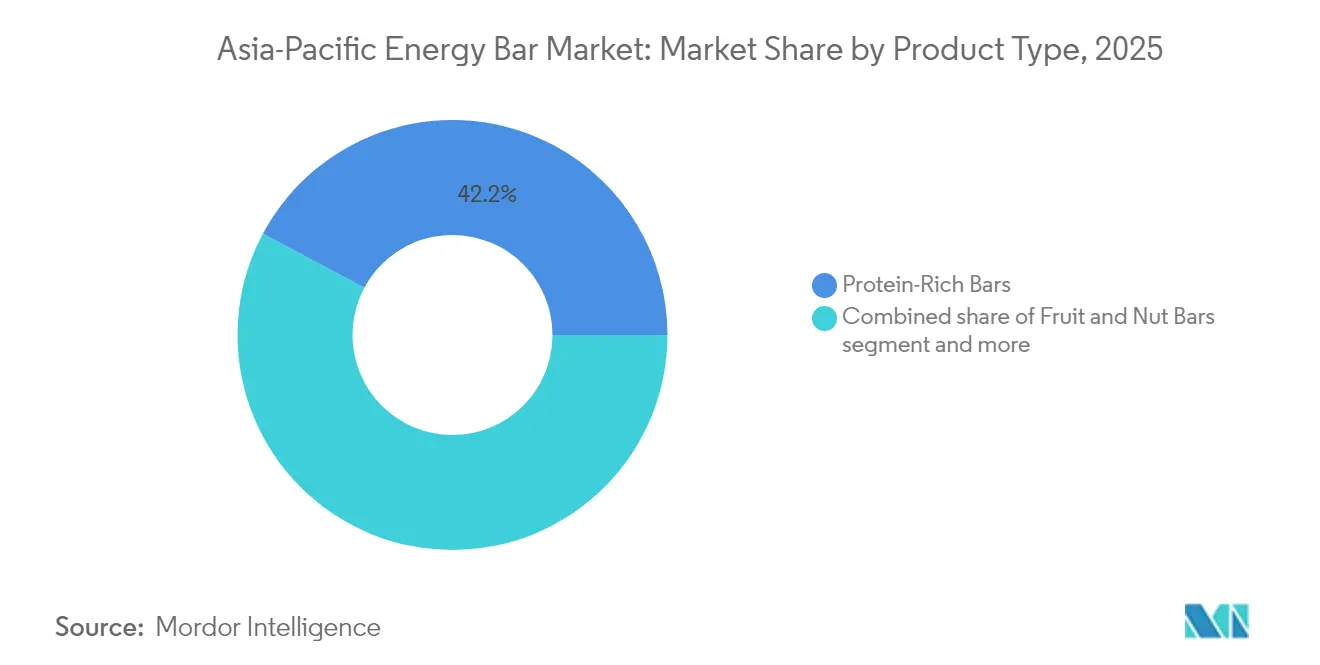
Protein Bars Dominate but Fruit-Nut Variants Gain GroundIn 2025, protein-rich bars secured a dominant 42.19% share of the market, driven by fitness enthusiasts, meal-replacement users, and sports nutrition fans who prioritize nutrient density over flavor. Pulmuone's Tofu Bar, a whole-soy protein offering from Japan, achieved a milestone of 70 million units sold by July 2024. With a presence in over 30,000 stores, it underscores the potential for protein bars to penetrate the mass market, especially when marketed as everyday wellness items rather than exclusive sports supplements. The protein bar segment benefits from a halo effect as sports nutrition gains mainstream acceptance, further solidifying its position in the market. This normalization of sports nutrition beyond dedicated athletes has expanded the consumer base for protein bars, making them a staple for individuals seeking convenient, nutrient-dense options in their daily routines.
However, cereal and granola bars, which cater to breakfast replacements and children's snacks, are facing margin pressures as consumers increasingly opt for protein-rich or fruit-based alternatives. Fruit and nut bars are forecast to grow at a brisk 9.93% CAGR from 2026 to 2031, driven by their clean-label positioning and plant-based ingredients. These attributes resonate with health-conscious consumers who value perceived naturalness over protein concentration. While protein bars dominate the market, fruit and nut bars are capturing a different segment of consumers seeking indulgence without guilt. This dynamic creates a bifurcated growth path, spotlighting innovation on both ends of the functional spectrum. The evolving preferences of consumers highlight opportunities for brands to innovate and cater to diverse needs within the functional bar market.

By Flavor Profile:
Chocolate Leads but Fruit Variants SurgeChocolate-based bars commanded a 51.88% share of the market in 2025, underscoring a consumer inclination towards indulgent flavors that not only mask the bitterness of protein isolates but also deliver sensory satisfaction. However, fruit-based bars are set to outpace chocolate counterparts, boasting a projected growth rate of 10.09% CAGR from 2026 to 2031. This growth is attributed to their clean-label appeal and natural sweetness, which resonate strongly with health-conscious consumers. Nut and seed-based bars, though positioned at a premium due to higher ingredient costs, cater to the growing demand for whole-food nutrition. Meanwhile, flavors like savory and regional variants remain experimental but present brands with opportunities to break free from the chocolate-fruit dominance. At FBIF 2024, Angel Yeast, in collaboration with ffit8, unveiled a nougat protein bar, setting itself apart by incorporating yeast protein, a departure from the usual whey or soy isolates.
Flavor preferences are dictated more by consumption occasions rather than absolute preference. Chocolate dominates impulse buys and children's snacks, while fruit-based bars are favored for health-centric snacking. Nut and seed options cater to those seeking premium meal replacements. This segmentation suggests that manufacturers would benefit from maintaining a diverse multi-SKU portfolio rather than focusing on a singular flavor platform. By addressing varied consumer needs and occasions, brands can better position themselves in a competitive market landscape.
By Price Tier:
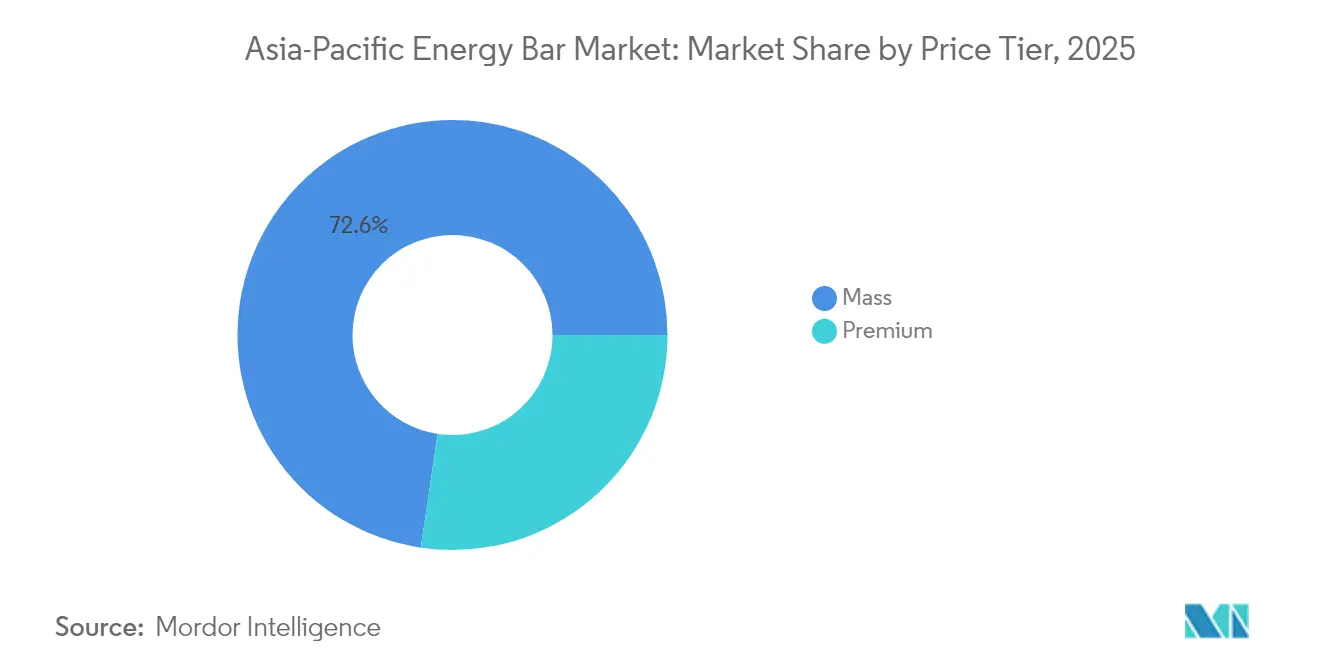
Mass Dominates but Premium Captures Disproportionate GrowthIn 2025, mass-tier products dominated the market, accounting for a 72.64% share. This trend highlights the significant price sensitivity in developing Asia-Pacific markets, where per-capita incomes remain below those of developed economies. Premium-tier bars are projected to grow at a 10.21% CAGR from 2026 to 2031, surpassing mass-tier growth by 153 basis points. This growth is driven by the expansion of the middle class and an increasing willingness to pay for functional benefits. A 2024 European consumer study revealed that consumers are willing to pay premiums for functional snack bars with health attributes. This willingness is mirrored in Asia-Pacific markets, where disposable incomes are rising at a faster pace compared to mature economies. In the Philippines, the snack market recorded listing fees of approximately USD 100 per SKU per store, creating entry barriers that favor established brands with scale. However, these barriers also incentivize premium positioning to justify retailer margins.
The premiumization trend, however, is not uniform across the region. Markets such as Japan, South Korea, and urban China exhibit the strongest willingness to pay for premium products. In contrast, price-sensitive markets like Indonesia, Thailand, and rural India require mass-tier offerings to achieve volume penetration. This disparity suggests that multinational entrants may benefit from adopting a dual-brand strategy to cater to the diverse market dynamics within the region. By leveraging premium-tier products in affluent markets and mass-tier offerings in price-sensitive areas, companies can optimize their market presence and address varying consumer preferences effectively.
By Distribution Channel:
Supermarkets Lead but E-Commerce DisruptsIn 2025, supermarkets and hypermarkets commanded a 41.72% share of the market, capitalizing on shelf visibility, the dynamics of impulse purchases, and ingrained consumer shopping habits. Convenience stores, catering to on-the-go consumers, effectively tap into commuter traffic. Specialty stores, on the other hand, focus on health-food aficionados, offering curated selections and expert guidance. Other channels, such as gyms, pharmacies, and vending machines, though niche, provide targeted access to consumers with specific intents. These diverse distribution channels reflect the evolving preferences of consumers and their varied shopping behaviors.
From 2026 to 2031, online retail is projected to lead with a robust 10.49% CAGR, spurred by the rise of quick commerce platforms, the allure of social commerce, and direct-to-consumer models that sidestep traditional retail hurdles. The distribution landscape is fragmenting: while supermarkets drive volume, they also demand slotting fees and promotions that can squeeze margins. E-commerce platforms foster direct relationships with consumers but necessitate significant digital marketing investments. Convenience stores excel in high-margin impulse sales but offer a limited range of SKUs. This dynamic environment compels manufacturers to adopt omnichannel strategies, moving away from reliance on any single dominant channel.
Geography Analysis
China Energy Bar Market
In 2025, China accounted for 34.87% of the global snack market, maintaining its position as the leading geography by revenue. However, the market is slowing down as urbanization stabilizes and health regulations become stricter. The growing urban population and increasing health awareness in China are driving demand for protein-rich and low-calorie snacks, with consumers favoring products with natural claims. Domestic companies are expanding rapidly: In November 2024, Qiaqia Food launched its 11th plant in Baotou, Inner Mongolia, increasing its annual production capacity to 39,000 metric tons of sunflower seeds and 6,000 metric tons of nuts. At the same time, regulatory challenges are intensifying: China's GB 2760-2024 standard imposes stricter limits on food additives, with compliance costs creating advantages for larger players over startups.
India Energy Bar Market
India is projected to grow at a strong 10.72% CAGR from 2026 to 2031, making it the fastest-growing geography among major markets. This growth is driven by the increasing adoption of sports nutrition, the rise of direct-to-consumer distribution, and the expansion of the middle class. In December 2024, Zydus Wellness acquired Naturell India (RiteBite Max Protein), marking a consolidation in a previously fragmented market. Key players in the market now include Yoga Bar, RiteBite, The Whole Truth, EAT Anytime, MuscleBlaze, and HealthKart. The rapid growth of quick commerce platforms in India has transformed energy bars from planned purchases into impulse buys, with delivery times as short as 10-15 minutes. India's Food Safety and Standards Authority (FSSAI) enforces labeling and licensing requirements for nutraceuticals, ensuring product quality and fostering consumer trust, though these regulations tend to favor established players due to the associated compliance costs.
APAC Energy Bar Market
Japan and South Korea are mature markets that focus on premium products, where innovation and functional claims are key differentiators. In May 2024, South Korea's Otsuka Pharmaceutical introduced SOYJOY, distributing it through online platforms and health-and-beauty retail outlets to appeal to health-conscious consumers seeking low-glycemic-index options. Southeast Asia, including countries like Thailand, Indonesia, and Singapore, shows fragmented growth trends. Meanwhile, Australia and New Zealand, though smaller markets, feature high-value segments. These regions benefit from well-established health-food retail channels and consumers willing to pay a premium for clean-label and organic products, even though specific market size data for these geographies remains limited.
Regulatory Landscape
Across Asia-Pacific, energy bar makers operate under tightening and increasingly harmonized nutrition labeling and additive-control regimes. These changes raise compliance costs, but they also strengthen consumer trust in functional and clean-label claims. China has advanced national labeling requirements through GB 28050-2025 for pre-packaged foods (effective March 16, 2027), expanding the scope and specificity of nutrition disclosure, while updated GB standards continue to tighten additive permissions that affect formulation choices for low-sugar or high-protein bars.
In Southeast Asia and Oceania, regulators are reinforcing labeling transparency and claim scrutiny that directly affects energy-positioning and front-of-pack communication. Singapore implemented mandatory pre-packaged food labeling amendments that came into operation on January 30, 2026, and energy-related claims trigger requirements to present a nutrition information panel under the Singapore Food Regulations. Australia and New Zealand continue to regulate nutrition information panels through the FSANZ Code (Standard 1.2.8), with defined transition periods for changes linked to added-sugar-related claims (October 2024 to October 2028). ASEAN guidance endorsed through the ASEAN Consultative Committee for Standards and Quality (ACCSQ) promotes alignment with Codex principles to ease intra-regional trade for packaged foods, including snack and nutrition bars.
Value Chain Analysis
The energy bar value chain in Asia-Pacific starts with ingredient procurement (oats, nuts, dried fruits, cocoa, sweeteners, and protein isolates) and moves into formulation and R&D, followed by manufacturing (in-house plants or contract manufacturing and co-packing). After bulk packing and palletization, products are distributed through channels including supermarkets and hypermarkets, convenience, specialty health retail, gyms, and online platforms. High-grade protein inputs often rely on imported isolates for consistent functional performance, while oats and grain inputs are frequently sourced from established regional suppliers, with Australia acting as a key oats supplier into North Asia and parts of Southeast Asia.
Operational constraints increasingly center on manufacturing-line availability and packaging logistics. Shortages in high-speed enrobing and tunnel-oven capacity can extend lead times for contract manufacturing slots (commonly cited at 6 to 12 months), and custom packaging lead times can reach 10 to 14 weeks, which slows SKU refresh cycles in a category driven by innovation and claim-led differentiation. Logistics volatility is another risk for shelf-stable packaged foods moving cross-border, and July 2026 shipper survey evidence points to frequent monthly shipment delays across Asia-Pacific linked to port congestion and customs and regulatory processes. This reinforces the value of regional co-packing, diversified sourcing, and tighter demand planning for modern retail promotions and e-commerce replenishment.
Competitive Landscape
The Asia-Pacific energy bar market is moderately consolidated, with multinational food corporations competing against agile local players across various price tiers and distribution channels. Strategies differ based on market maturity: in China and India, multinationals prioritize local manufacturing and flavor adaptation, while in Japan and South Korea, differentiation is driven by innovation in functional ingredients and premium positioning. PepsiCo's USD 1.3 billion investment in a Shaanxi food production base and its partnership with Jiangsu Rilong Food to enhance the Quaker brand in China's cereal nutrition segment highlight this focus on capacity building.
Opportunities for growth include rural markets in India, Indonesia, and the Philippines, where awareness of energy bar benefits remains limited, and premiumization in Japan, South Korea, and urban China, where consumers are willing to pay for functional claims and clean-label ingredients. Emerging disruptors are leveraging direct-to-consumer models, social commerce, and influencer partnerships to bypass traditional retail challenges. The Asia-Pacific energy bar market is highly competitive, with key players including Clif Bar and Company, Abbott Laboratories, General Mills, Inc., Kellanova, and PROBAR LLC. Companies are employing strategies such as new product development and mergers and acquisitions to meet consumer demands.
Technology is reshaping competition through e-commerce platforms, rapid logistics, and data-driven personalization. Manufacturers are adopting automation to mitigate raw material price volatility. Regulatory compliance is becoming a competitive advantage: China's GB 2760-2024 additive restrictions, India's FSSAI licensing requirements, and Thailand's FDA health claim regulations create barriers that favor established players with strong regulatory expertise over startups. The competitive landscape is dividing into two segments: scale players focusing on distribution reach and cost efficiency, and premium disruptors emphasizing innovation, functional claims, and direct consumer engagement, leaving minimal space for undifferentiated brands.
Asia-Pacific Energy Bar Industry Leaders
-
General Mills, Inc.
-
Probar LLC
-
Clif Bar and Company
-
Kellanova
-
Abbott Laboratories
- *Disclaimer: Major Players sorted in no particular order
Asia-Pacific Energy Bar Market Companies Covered in this Report
- Clif Bar and Company
- Kellanova
- General Mills Inc.
- Abbott Laboratories
- Otsuka Pharmaceutical Co. (SoyJoy)
- PowerBar Europe GmbH
- Probar LLC
- NuGo Nutrition
- Mondelez International (Perfect Snacks)
- Nestle S.A. (Musashi, Milo bars)
- PepsiCo Inc. (Quaker Chewy)
- Lotte Foods Co. Ltd.
- Calbee Inc.
- Marico Ltd. (FIT MAX)
- Naturell India Pvt. Ltd. (RiteBite Max Protein)
- MuscleBlaze (Bright Lifecare Pvt. Ltd.)
- Uni-President Enterprises Corp.
- Xterra Nutrition
- Everi Foods Pty Ltd (Aussie Bodies)
- Sanitarium Health and Wellbeing Co.
Market Opportunities and Future Outlook
Opportunities in Asia-Pacific energy bars cluster around reformulation and labeling-led differentiation, alongside manufacturing and logistics localization that shortens lead times and supports faster innovation cycles. As Thailand, Indonesia, Singapore, China, and Australia/New Zealand continue to tighten nutrition labeling and claim scrutiny, whitespace opens for brands that can substantiate functional positioning (for example, protein-forward, higher fiber, and lower-sugar profiles). Brands can pair this with mass-tier price points in developing markets and premium claims in Japan, South Korea, and urban China. The category also has room to expand through non-traditional channels already present in the region, including gyms, pharmacies, and vending, complementing the dominance of supermarkets and hypermarkets and the accelerating role of online retail.
A second opportunity track is supply-chain-enabled growth through Southeast Asian production and automated warehousing that improves service levels for omnichannel distribution. Vietnam is strengthening its role as a regional manufacturing hub, supported by large-scale, automation-oriented investments such as Suntory PepsiCo Vietnam Beverage inaugurating a USD 300 million facility in Tay Ninh in July 2026 with an annual capacity of 1.24 billion liters and an automated warehouse, and Bel Group announcing a EUR 16.7 million expansion in Vietnam in January 2026 that integrates a Research, Innovation and Development pilot line. While these examples are not energy-bar-specific plants, they reflect a broader packaged-food and beverage shift toward automated regional capacity and on-site innovation infrastructure that energy bar manufacturers and co-packers can leverage through shared contract manufacturing, packaging, and logistics capabilities to improve responsiveness across China, India, and Southeast Asia.
Recent Industry Developments in Asia-Pacific Energy Bar Market
- March 2026: Clif Bar and Company expanded its energy portfolio with the launch of CLIF Energy Bites and a limited-edition Chocolate Berry energy bar, highlighting non-GMO oats and a 10 g protein positioning. The launch reinforces ongoing premium and functional renovation in portable nutrition formats that translate well to Asia-Pacific modern retail and e-commerce shelves.
- August 2025: Phab introduced Indias first Savory Protein Bar as part of its Street Collection, inspired by the local snack Bhel. The move broadens the flavor playbook beyond chocolate and fruit formats and supports local relevance strategies for mass and online channels in India.
- October 2024: Zydus Wellness Limited acquired Naturell India Pvt. Ltd., the manufacturer of RiteBite Max Protein energy bars. The deal consolidates a fragmented Indian protein and energy bar space and provides stronger distribution leverage across modern trade and e-commerce for scaled rollout.
Asia-Pacific Energy Bar Market Report Scope and Research Methodology
Market Definition and Coverage
This market covers the sale of packaged energy bars across Asia-Pacific that are positioned as convenient, functional snacks for energy, endurance, or on-the-go nutrition, and that are sold through retail and online channels in the region.
Scope exclusions: The sizing excludes homemade bars, unpackaged bakery bars, and meal replacement shakes or powders that are not sold as bars.
Segments Covered in This Report
- By Product type
- Cereal/Granola Bars
- Protein-Rich Bars
- Fruit and Nut Bars
- By Flavor Profile
- Chocolate-based Bars
- Fruit-based bars
- Nut and Seed-based bars
- Other Flavors
- By Price Tier
- Mass
- Premium
- By Distribution Channel
- Supermarkets/Hypermarkets
- Convenience Stores
- Online Retail
- Specialty Stores
- Other Distribution Channels
- By Country
- China
- Japan
- India
- Thailand
- Singapore
- Indonesia
- South Korea
- Australia
- New Zealand
- Rest of Asia-Pacific
Data Sources, Market Sizing, and Validation
Desk Research
Desk work starts with building the demand context and guardrails for the model, so we do not size the market based on a single number. We reviewed public sources such as national statistics offices for population and income trends, customs and tariff portals for ingredient and finished snack trade signals, and food regulator and labeling guidance (country food standards agencies) to understand claim definitions and compliance triggers.
To make the supply side more concrete, we also used sources such as company annual reports, investor decks, and press releases for capacity additions, channel pushes, and pricing moves, followed by reputable media coverage and retail association publications for channel direction. In parallel, we referenced paid subscriptions for company financials and intelligence, news and financials, and patent databases to cross-check innovation intensity and product activity. The examples listed here are illustrative only, and many other public sources were also consulted for data collection, validation, and clarification.
Primary Interviews and Surveys
Primary work was used to pressure-test the desk assumptions on what counts as an energy bar in each market and how volumes move across modern trade, convenience, and online. We spoke with a mix of manufacturers, ingredient suppliers, distributors, and retail category stakeholders across APAC so that pricing ladders, promo intensity, and channel splits could be validated, and any weak spots in secondary data could be corrected.
Distribution of primary research fieldwork respondents
| Company type | Respondent position |
|---|---|
| Top tier: 28% | CXOs: 15% |
| Mid tier: 57% | Functional/Unit leaders: 41% |
| Smaller Players: 15% | Managers: 44% |
Market-Sizing & Forecasting
The core sizing model uses a top-down build where consumption and retail indicators are used to reconstruct an addressable demand pool for packaged energy bars at the country level, which is then aggregated to Asia-Pacific. Inputs include snack bar penetration within urban consumers, average annual units consumed per buyer, channel mix between supermarkets, convenience, and e-commerce, observed price bands by pack size, and the share of bars positioned with energy and performance claims.
Those totals are then corroborated with selective bottom-up approximations, such as sampling brand price points and matching them to estimated unit movement by channel, and then checking results against supplier and distributor feedback. Where direct volume signals are thin for smaller countries, gaps are handled using proxy countries with similar income levels and retail structure, and then adjusted using local interview inputs.
For forecasting, we used scenario analysis anchored to a base case, because the category is sensitive to price inflation, promotion cadence, and the pace of fitness and convenience-led adoption. Assumptions on price progression, online share gains, and premiumization are reviewed with industry participants before the final forecast is locked.
Data Validation & Update Cycle
Checks are applied at several steps so the final numbers do not rely on one dataset or one assumption. Outputs are compared against independent signals like unit-per-capita reasonableness, expected channel splits, and price band consistency, and outliers are investigated before sign-off.
We also run variance checks across countries to catch abnormal jumps that can come from currency conversion timing, one-off promotions, or temporary supply disruptions. Reports are refreshed annually, and interim updates are made when material events occur that can change pricing, distribution, or category definition. Before delivery, a fresh analyst review is completed so clients receive the most current view available.
Mordor Intelligence's Asia Pacific Energy Bar Market Sizing Compared With Other Published Estimates
It is normal for published market sizes to differ for this category, even when the geography label looks similar. The main reasons are differences in what products are counted as energy bars, how prices are averaged across pack sizes and promotions, and whether the update includes the latest inflation and channel shifts.
Some external estimates roll a wider functional snack basket into the same total, and that can quickly lift the number once protein bars, cereal bars, and broader nutrition bars are blended. In Mordor Intelligence, revenue is counted only for packaged energy bars sold in Asia-Pacific, and adjacent snack bars are kept out unless they meet the energy bar positioning and claim cues used in the model.
Benchmark comparison
| Source | Market Size | Gaps in Research Methodology |
|---|---|---|
| Mordor Intelligence | USD 1.05 B (2025) | |
| Regional Consultancy A | USD 6.06 B (2024) | Uses a much broader category scope that appears to blend multiple bar types and end-user groupings, which raises the addressable pool versus energy bars alone. The base year and forecasting window also differ, so currency timing and inflation pass-through are not aligned. |
| Trade Publisher B | USD 1.48 B (2025) | Likely includes a wider product-type set within bars and applies a different price ladder across countries, which can shift totals when premium segments are weighted more heavily. The longer forecast horizon suggests assumptions may be smoothed without the same level of near-term channel and promotion checks. |
The spread in the table is mainly explained by scope expansion into adjacent bar categories and by how average prices are constructed across countries and channels. By keeping inclusion rules tied to clear product positioning signals, and then cross-checking them with channel mix and price band logic, the estimate stays easier to trace and repeat when new data points emerge.
Key Questions Answered in the Report
How large will the Asia-Pacific energy bar market be by 2031?
It is projected to reach USD 1.83 billion, up from USD 1.05 billion in 2025, reflecting a 9.74% CAGR.
Which product type is growing fastest?
Fruit-and-nut bars show the highest 9.93% CAGR as consumers seek clean-label and plant-based snacks.
Why is India considered the key growth arena?
India combines the region’s fastest 10.72% CAGR, rapid e-commerce adoption, and regulatory frameworks that now favor fortified foods.
What is driving premium-tier expansion?
Urban consumers in Japan, South Korea, and China pay up for organic certification, plant protein, and functional claims, pushing premium bars to a 10.21% CAGR.