Market Overview
| Study Period | 2021 - 2031 |
|---|---|
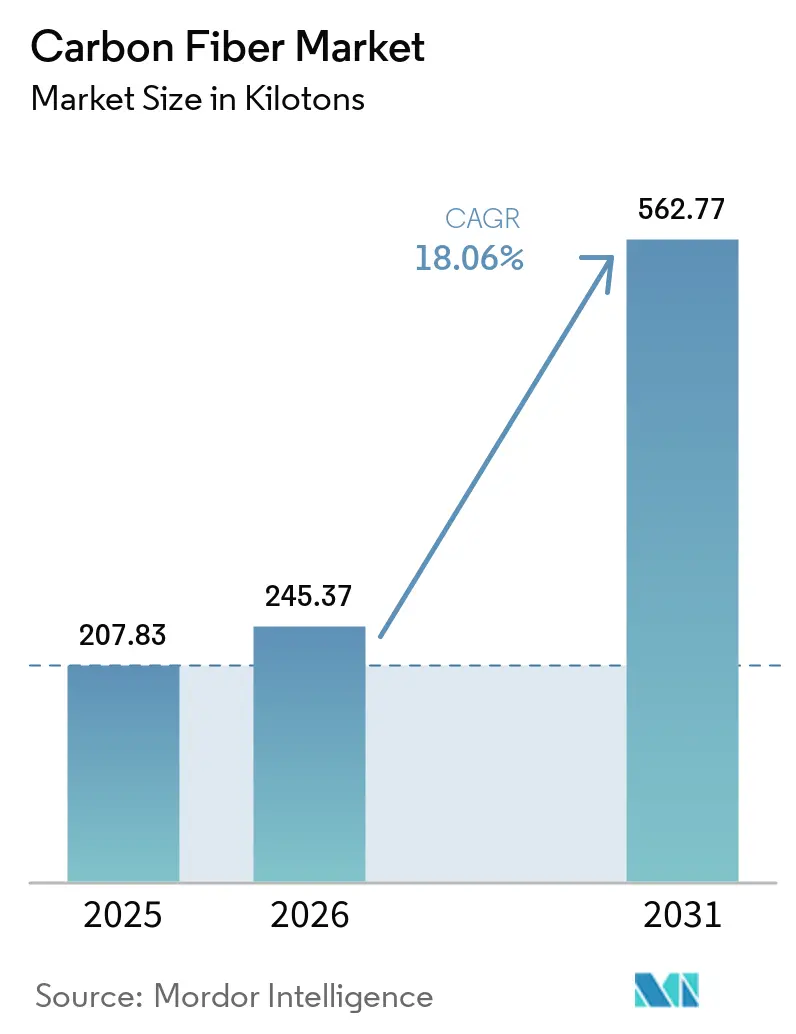
| Market Volume (2026) | 245.37 kilotons |
| Market Volume (2031) | 562.77 kilotons |
| Growth Rate (2026 - 2031) | 18.06% CAGR |
| Fastest Growing Market | Asia Pacific |
| Largest Market | Asia Pacific |
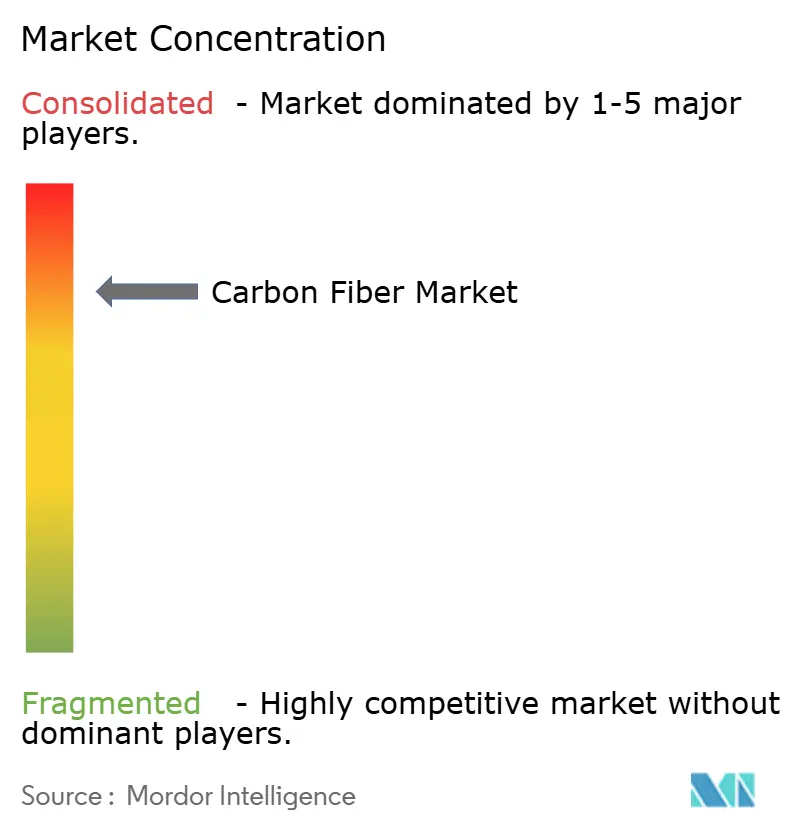
| Market Concentration | High |
Major Players *Disclaimer: Major Players sorted in no particular order Image © Mordor Intelligence. Reuse requires attribution under CC BY 4.0. | |
Carbon Fiber Market Analysis by Mordor Intelligence
The Carbon Fiber Market size is expected to grow from 207.83 kilotons in 2025 to 245.37 kilotons in 2026 and is forecast to reach 562.77 kilotons by 2031 at 18.06% CAGR over 2026-2031. Sustained demand from offshore wind, hydrogen pressure vessels, and battery-electric vehicles keeps utilization rates high across integrated producers in Asia-Pacific, North America, and Europe. Capacity expansions by Toray, Mitsubishi Chemical, and Chinese newcomers are easing raw-material tightness while automated fiber-placement (AFP) systems cut cycle time and labor cost, widening the customer base. Recycled fiber growth and local-content rules in India and the Middle East diversify supply chains, although high energy intensity and feedstock volatility remain headwinds. Together, these dynamics reinforce the long-run competitiveness of carbon composites versus aluminum and high-performance thermoplastics in mobility, clean-energy, and aerospace programs.
Key Report Takeaways
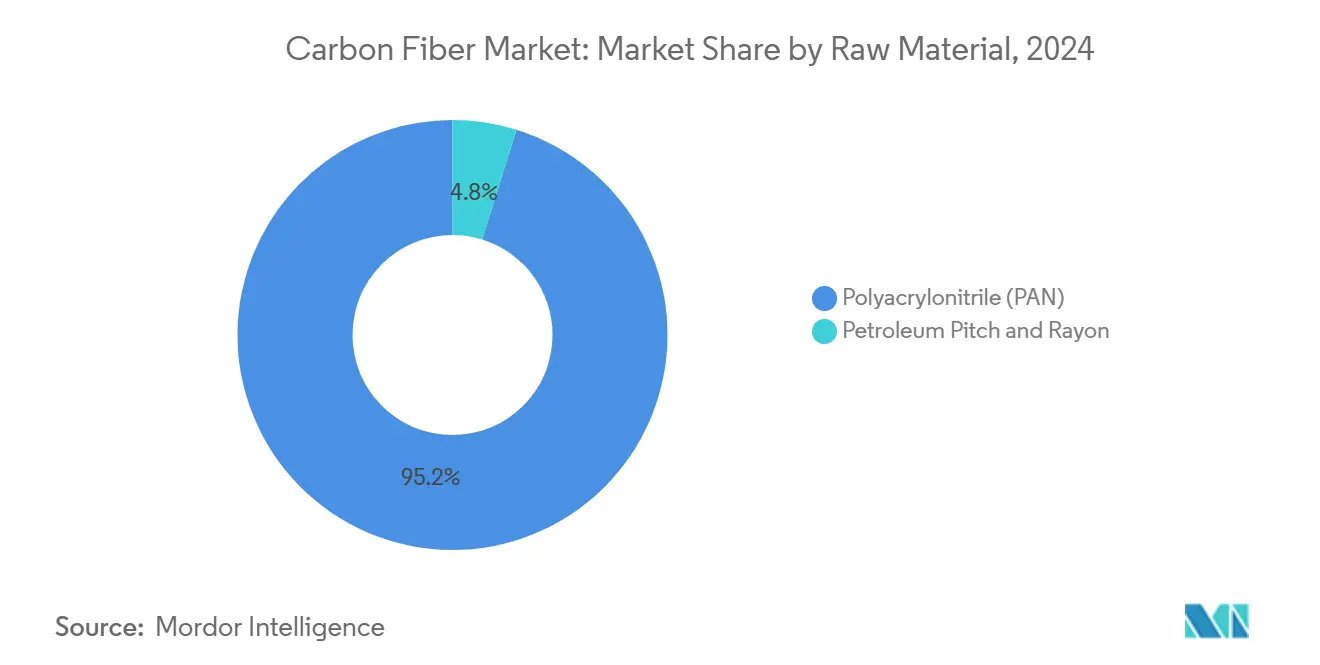
- By raw material, polyacrylonitrile led with 95.18% volume share in 2025, accounting for the largest carbon fiber market share while the same segment is forecast to advance at an 18.91% CAGR through 2031.
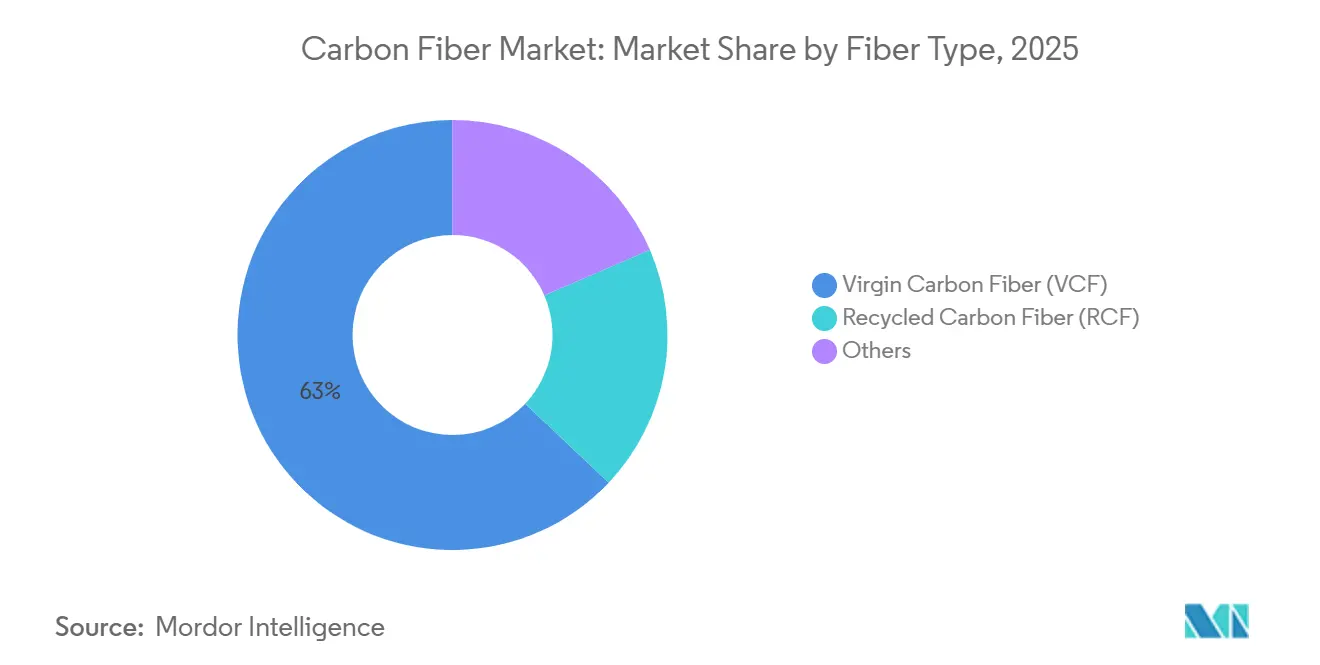
- By fiber type, virgin carbon fiber secured a 62.95% share in 2025, whereas recycled carbon fiber is expected to post a 19.87% CAGR during 2026-2031.
- By application, composite materials captured 87.77% of volume in 2025, and micro-electrodes are set to expand at a 25.55% CAGR to 2031.
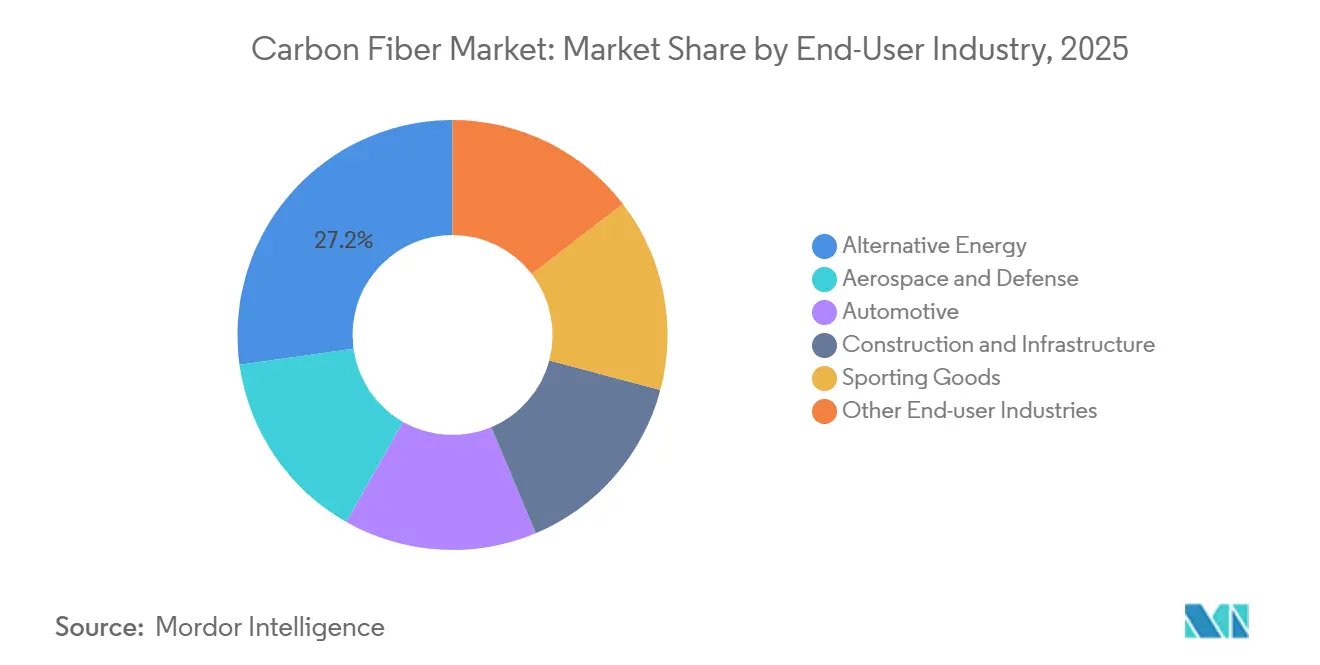
- By end-user industry, alternative energy held a 27.21% share in 2025, while the other end-user industries segment is projected to grow at a 25.98% CAGR over the same period.
- By geography, Asia-Pacific commanded a 44.89% share in 2025, reinforcing its dominance in the carbon fiber market share and is also forecast to be the fastest-growing region, rising at a 20.75% CAGR through 2031.
Note: Market size and forecast figures in this report are generated using Mordor Intelligence’s proprietary estimation framework, updated with the latest available data and insights as of January 2026.
Global Carbon Fiber Market Trends and Insights
Drivers Impact Analysis*
| Drivers | (~) % Impact on CAGR Forecast | Geographic Relevance | Impact Timeline |
|---|---|---|---|
| Rising production of hydrogen and CNG pressure vessels | +2.5% | Global, early focus in Europe and Asia-Pacific | Medium term (2-4 years) |
| Rapid deployment of offshore wind turbines | +3.2% | Europe, China, Taiwan, Japan | Long term (≥ 4 years) |
| Adoption of battery-pack enclosures in EVs | +2.8% | North America, Europe, China | Medium term (2-4 years) |
| 3D automated fiber-placement lines | +1.8% | North America, European aerospace hubs | Short term (≤ 2 years) |
| Local-content mandates in India and MENA | +1.5% | India, United Arab Emirates, Saudi Arabia | Medium term (2-4 years) |
| Source: Mordor Intelligence | |||
Rising Production of Hydrogen and CNG Pressure Vessels for Commercial Mobility
Type IV cylinders that wrap polymer liners with carbon fiber now define the 700-bar storage standard for fuel-cell trucks, buses, and trains, contributing to carbon fiber market share growth. Voith’s Carbon4Tank cleared UNECE Regulation 134 burst-pressure tests above 1,050 bar, opening series supply to European heavy-duty fleets[1]Voith, “Carbon4Tank Certification Update,” voith.com. The U.S. Department of Energy calculated a cost of USD 12.7 per kilowatt-hour in 2024, down from USD 18 in 2020, as filament-winding automation and precursor price stability improved economics[2]U.S. Department of Energy, “Hydrogen Storage Cost Targets,” energy.gov. Luxfer and Hexagon Purus enlarged North American and European manufacturing footprints, each tank incorporating 25-30 kg of fiber and delivering 8-12% higher payload versus steel cylinders. ISO 11119 and DOT FMVSS 304 fatigue requirements over 15,000 cycles reinforce the reliability edge against aluminum-lined alternatives. Fleet operators see lower lifetime cost from lighter tanks, which accelerates commercial adoption in long-haul corridors.
Rapid Deployment of Offshore Wind Turbines Requiring High-Strength Blades
Next-generation turbines in the 11-22 MW class employ 100-143 m blades that need spar-cap tensile strength exceeding 4,800 MPa. Siemens Gamesa’s B108 integrates carbon-fiber spars to shave 20% blade mass, lowering tower-top loads and installation cost. Mingyang Smart Energy’s 143 m blade for an 18 MW platform consumes 15-18 tons of fiber, translating to roughly 50,000 tons of annual demand for offshore blades alone. Europe added 4.2 GW of offshore capacity in 2024, and blade carbon-fiber content climbed to 25-30% of mass, up from 15% in 2020. Taiwan and Japan deploy floating platforms in typhoon-prone waters, where carbon composites withstand cyclic fatigue 30-40% better than glass fiber. These factors secure a multiyear pull for structural composites across Asian and European coastlines.
Adoption of Battery-Pack Enclosures and Lightweighting in EV Platforms
Automakers replace steel enclosures with carbon-fiber-reinforced structures that deliver 40-60% weight savings and extend range 8-12% per 100 kg shed. SGL Carbon and Continental Structural Plastics co-developed a thermoplastic tray meeting UL 2596 fire standards, now in production for a European premium EV launched in 2025. Magna International supplies carbon-fiber body panels that cut body-in-white mass 18% and lower the center-of-gravity for battery SUVs. United States Inflation Reduction Act incentives catalyze domestic sourcing, and Toray’s South Carolina expansion targets 5,000 tons of automotive fiber by 2027. Crash-test validation under FMVSS 208/214 confirms 25-30% higher energy absorption than high-strength steel, dispelling safety concerns.
3D Automated Fiber-Placement Lines Slashing Composite Cycle Times
Laser-assisted AFP heads now lay 32 tows at 1,000 mm per minute, halving cycle times for fuselage and wing panels. Boeing’s 777X wing-spar line using Electroimpact machines cuts labor cost 30-50% versus manual layup. Fives Group integrated AFP with filament winding, processing hydrogen tank liners in 12 minutes instead of 45 minutes. Thermoplastic towpreg enables in-situ consolidation that eliminates autoclave curing and lowers energy use by 60-70%. Aerospace suppliers report panels that meet ASTM D5528 fracture-toughness criteria while reducing scrap from 15-20% to below 5%. These gains bring carbon composites into mid-volume automotive and industrial programs.
Restraints Impact Analysis*
| Restraints | (~) % Impact on CAGR Forecast | Geographic Relevance | Impact Timeline |
|---|---|---|---|
| Energy-intensive oxidation and carbonization | −2.0% | Global, most acute in Europe | Medium term (2-4 years) |
| Supply-chain risks for recycled feedstock | −1.2% | North America, European aerospace hubs | Short term (≤ 2 years) |
| Competition from high-performance thermoplastics | −1.0% | North America, Europe, Asia-Pacific | Medium term (2-4 years) |
| Source: Mordor Intelligence | |||
Energy-Intensive Oxidation and Carbonization
Producing one kilogram of fiber consumes 50-100 kWh and emits 20-30 kg of CO₂, up to five times more than aluminum extrusion, posing a major challenge for the carbon fiber industry. European electricity costs of EUR 0.15-0.25 per kWh in 2024-2025 raised manufacturing costs by USD 5-8 per kg, widening the gap with Asian suppliers powered by low-cost coal. Toray targets a 30% absolute emissions cut by 2030 via renewable electricity and waste-heat recovery at its Hungary site, yet carbonization furnaces still lock in high intensity. Mitsubishi Chemical pilots lower-temperature PAN that trims energy 15-20%, but commercial rollout is two to three years away. Customers now request Environmental Product Declarations under ISO 14025, so fiber makers must invest an estimated USD 500 million to reach the 2030 target of below 15 kg CO₂ per kg of fiber.
Supply-Chain Risks for Recycled Carbon Fiber Feedstock
Recycled fiber depends on end-of-life aerospace and wind composites, yet only 15-20% of retired blades and aircraft scrap enter recovery streams. ELG Carbon Fibre’s 2,000 ton UK plant processes pyrolyzed offcuts but faces inconsistent fiber length and tensile strength that vary 20-30% lot to lot. Intellectual-property concerns keep airframers from releasing scrap schedules, limiting guaranteed feedstock volumes. Gen 2 Carbon’s U.S. thermoplastic process preserves fibers above 50 mm, but it cannot treat the thermoset epoxies dominant in aerospace. Feedstock pricing swings between USD 5-15 per kg, complicating long-term contracts, and certification gaps keep recycled material largely out of primary structures despite ASTM D7078 test methods, creating challenges for the carbon fiber industry.
*Our forecasts treat driver/restraint impacts as directional, not additive. The impact forecasts reflect baseline growth, mix effects, and variable interactions.
Segment Analysis
By Raw Material: PAN Precursor Dominance Anchors Supply Economics
Polyacrylonitrile captured 95.18% of the 2025 volume and is anticipated to grow with a CAGR of 18.91% during the forecast period. Its strong carbon yield keeps average cost near USD 12-14 per kg even after energy surcharges, helping the carbon fiber market defend against thermoplastic substitution. Tight supply in 2024-2025 lifted spot PAN to USD 8-10 per kg, forcing some converters to invoke force-majeure clauses on automotive contracts. China’s Jilin Chemical and Bluestar control up to 70% of global precursor capacity, giving Asia-Pacific leverage over global pricing.
Pilot programs for microwave-assisted oxidation show 25-30% faster cycle time and 15-20% lower energy use, pointing to a structural cost decline after 2028. Pitch and rayon remain niche but vital for ultra-high-modulus spacecraft structures and thermal barriers that demand modulus above 800 GPa. Hyosung’s 4,000-ton expansion and bio-based acrylonitrile initiatives promise a 30-40% lifecycle-emission cut, aligning with OEM net-zero targets. The carbon fiber market size for PAN-based grades is projected to move in lockstep with acrylonitrile availability; any prolonged outage in Shandong or Jiangsu could ripple through the value chain within nine months.


By Fiber Type: Recycled Fiber Gains as Circularity Mandates Intensify
Virgin grades kept 62.95% share in 2025, accounting for the largest carbon fiber market share mainly serving aerospace and defense programs that require lot-traceability and tight mechanical tolerances. Recycled volumes are anticipated to grow with a CAGR of 19.87% through 2031 on the back of automotive and wind energy pull, yet certification for primary structures remains outside the 2026 planning horizon.
ELG Carbon Fibre recovers 90-95% of virgin strength from aerospace scrap, enabling seat frames and overhead bins at 30-50% lower cost. Karborek’s solvolysis route retains fibers above 80 mm but must manage solvent waste streams that raise operating costs. Gen 2 Carbon closes the loop on thermoplastic parts, a key differentiator as EV battery-tray volumes rise. The carbon fiber market share for recycled grades is poised to widen further once wind-blade decommissioning accelerates after 2027, providing a stable feedstock base.

By Application: Composite Materials Anchor Demand Across End-Use Sectors
Composite materials controlled 87.77% of the 2025 volume, reflecting the broad reliance on epoxy and thermoplastic matrices in aerospace fuselages, wind blades, and hydrogen tanks. Automated layup and AFP adoption carved 20-30% out of part cost in 2024-2025, reinforcing carbon fiber’s economic edge over aluminum.
Textile use in protective apparel remains a niche due to the fiber’s brittleness, while micro-electrodes will expand at 25.55% CAGR through 2031 on the back of neural-interface trials that show 30-40% higher signal-to-noise versus noble metal electrodes. Catalysis applications use woven fiber for gas-diffusion layers in fuel cells, supporting stack lifetimes of 8,000-10,000 hours. Overall, the composite segment will retain more than 80% of the carbon fiber market size as no competing material matches the stiffness-to-weight and fatigue profile required by high-energy infrastructure.
By End-User Industry: Alternative Energy Leads as Automotive Accelerates
Alternative energy absorbed 27.21% of 2025 demand, with offshore blades and hydrogen tanks jointly accounting for most incremental volume. The carbon fiber market size attached to clean-energy applications will keep expanding in tandem with 22 MW offshore turbines and 700-bar fuel-cell trucks.
Aerospace programs use the highest-value fibers but face cyclical build rates; wide-body output could remain below 2019 levels until 2027. Automotive adoption grows as EV battery prices drop below USD 80 per kWh, freeing budget for lightweight body-in-white designs. Construction retrofits in seismic zones and high-spec sporting goods complete the demand mosaic. Other end-user industries, including marine propellers and robotic arms, will post the fastest CAGR of 25.98% through 2031, assisted by corrosion-resistant requirements in harsh environments.
Geography Analysis
Asia-Pacific led the carbon fiber market with 44.89% share in 2025 and is set to grow at a 20.75% CAGR through 2031. China’s vertically integrated precursor-to-fiber chains, Japan’s aerospace-grade specialties, and India’s offset policies guarantee strong local pull. Taiwan’s 4.5 GW offshore wind fleet and South Korea’s automotive suppliers add further upside. Low electricity prices and captive acrylonitrile supply cement the region’s cost advantage.
North America ranks second by volume, with the United States carbon fiber market boosted by Boeing, Lockheed Martin, and battery-electric vehicle initiatives tied to the Inflation Reduction Act incentives. Toray’s 5,000 ton South Carolina line will cover automotive grades, while Hexcel’s Salt Lake City expansion supports 787 and A350 wing spars. Recycled-fiber networks in Washington and Maine supply Tier 1 automotive interiors, expanding domestic circularity, strengthening the regional carbon fiber industry.
Europe combines offshore wind, strict vehicle emissions rules, and Airbus aerostructures to maintain high utilization despite energy-price volatility. Siemens Gamesa blades integrate carbon-fiber spar caps that reduce mass by 20%. Germany’s automakers rely on thermoplastic composites from SGL Carbon’s Meitingen plant to meet the 95 g/km CO₂ target. The EU Critical Raw Materials Act encourages domestic capacity, and Toray’s Hungary site now sources renewable electricity to cut lifecycle emissions 30%, supporting the regional carbon fiber industry.


Competitive Landscape
The global carbon fiber market is highly consolidated, with the top five arbon fiber companies holding a major share of the global volume in 2025. The cost-innovation race continues to drive advancements in the market. SGL has launched a climate-friendly fiber line that reduces CO₂ emissions by 50%, addressing the growing demand from automotive and wind OEMs for low-carbon solutions. Concurrently, university-industry collaborations are focusing on innovative materials such as bitumen, lignin, and recycled feedstocks to disrupt traditional cost structures. Furthermore, strategic partnerships among resin producers, sizing specialists, and fiber manufacturers emphasize vertical integration, enabling the development of specialized growth opportunities.
Carbon Fiber Industry Leaders
TORAY INDUSTRIES, INC.
Mitsubishi Chemical Group Corporation
Teijin Limited
Hexcel Corporation
SGL Carbon
- *Disclaimer: Major Players sorted in no particular order

Recent Industry Developments
- October 2025: Toray Industries completed a USD 180 million expansion in Decatur, Alabama, adding 5,000 tons of automotive-grade capacity under the Inflation Reduction Act tax incentives.
- September 2025: Mitsubishi Chemical Group announced a USD 300 million program to double carbon-fiber output by 2027, centered on lower-temperature PAN precursor lines in Japan and Germany.
- May 2025: Sigmatex launched a 50 g m⁻² spread-tow fabric offering 20% higher drapability for aerospace interiors and high-performance sporting goods.


Research Methodology Framework and Report Scope
Market Definitions and Key Coverage
Our study defines the global carbon fiber market as the sale of continuous, semi-continuous, and chopped fibers produced from polyacrylonitrile, pitch, or rayon precursors that possess a minimum tensile strength of 3 GPa and are delivered in raw fiber form to converters or captive composite lines. Outputs are tracked in kilotons at factory gate and tied to equivalent invoice revenues where available.
Scope Exclusions: Finished composite parts (e.g., bicycle frames, pressure vessels) and activated-carbon cloth are kept outside this baseline.
Segmentation Overview
- By Raw Material
- Polyacrylonitrile (PAN)
- Petroleum Pitch and Rayon
- By Fiber Type
- Virgin Carbon Fiber (VCF)
- Recycled Carbon Fiber (RCF)
- Others
- By Application
- Composite Materials
- Textiles
- Micro-Electrodes
- Catalysis
- By End-User Industry
- Aerospace and Defense
- Alternative Energy
- Automotive
- Construction and Infrastructure
- Sporting Goods
- Other End-user Industries
- By Geography
- Asia-Pacific
- China
- Japan
- India
- South Korea
- Rest of Asia-Pacific
- North America
- United States
- Canada
- Mexico
- Europe
- Germany
- United Kingdom
- France
- Italy
- Rest of Europe
- South America
- Brazil
- Argentina
- Rest of South America
- Middle-East and Africa
- Saudi Arabia
- United Arab Emirates
- South Africa
- Egypt
- Rest of Middle-East and Africa
- Asia-Pacific
Detailed Research Methodology and Data Validation
Primary Research
Mordor analysts interview fiber producers, converters, and wind-blade OEMs in North America, Europe, China, and the Gulf, followed by structured surveys of composite distributors and pressure-vessel winders. These conversations validate real operating rates, precursor transfer prices, and region-specific demand pivots that seldom surface in filings.
Desk Research
We begin with public-domain production and trade statistics issued by UN Comtrade, Eurostat Comext, and Korea Customs, which let us map precursor flows and export-grade tow. Industry bodies such as JEC Group, the Japan Carbon Fiber Manufacturers Association, and the American Composites Manufacturers Association supply capacity expansions and utilization alerts. Cost drivers are benchmarked through quarterly energy indices from the U.S. EIA and China National Bureau of Statistics, while patent trends are scraped from Questel to flag new low-cost stabilization methods. Company 10-Ks and investor decks then help our team link stated nameplate tonnage to realized shipments. Select paywalled inputs, Dow Jones Factiva for deal flow and D&B Hoovers for plant-level revenue splits, round out the desk effort. This list is illustrative, not exhaustive.
Market-Sizing & Forecasting
A top-down build starts from observed precursor consumption and trade, back-calculating finished fiber output after yield factors, which is then reconciled with demand-pool estimates drawn from aircraft deliveries, MW of installed wind capacity, and BEV production. Select bottom-up checks, supplier roll-ups at large tow lines and sampled ASP x volume invoices, tighten the bands. Key variables tracked include: - PAN spot price spread to acrylonitrile - Wind-turbine blade average length additions per year - Narrow-body aircraft build-rate guidance - Regional hydrogen storage tank orders - Scrap-generation ratios feeding recycled fiber uptake
A multivariate regression with ARIMA residual correction projects each driver toward 2030, and scenario analysis adjusts for precursor energy shocks. Gaps in bottom-up estimates (e.g., new Chinese lines ramping mid-year) are bridged by weighted moving averages of adjacent quarters.
Data Validation & Update Cycle
Outputs pass a four-level review: automated anomaly flags, peer cross-check, senior analyst sign-off, and an external expert callback when +/-5% variances emerge. The model refreshes annually; material events, like a force-majeure shutdown, trigger interim revisions before client delivery.
Why Our Carbon Fiber Baseline Commands Reliability
Published figures often diverge because some firms bundle downstream composites, convert at assumed ASPs, or lock forecasts to single-region growth spurts.
By anchoring on physically measured fiber tonnage and reconciling it with verified precursor flows, Mordor Intelligence avoids double counting and currency-conversion skews that inflate USD values when resin inflation spikes.
Benchmark comparison
| Market Size | Anonymized source | Primary gap driver |
|---|---|---|
| 207.64 kilotons (2025) | Mordor Intelligence | |
| USD 4.82 bn (2025) | Global Consultancy A | Bundles prepregs & compounds; excludes recycled fiber streams |
| USD 6.37 bn (2025) | Trade Journal B | Merges carbon fiber with CFRP part revenues, lifting totals |
| USD 3.12 bn (2025) | Industry Tracker C | Covers only PAN small-tow and omits Latin America, understating size |
These contrasts show that, while others either broaden or narrow scope, our volume-first, dual-check process offers decision-makers a balanced, transparent baseline they can trace back to clear variables and repeat with confidence.


Key Questions Answered in the Report
What is the projected demand for carbon fiber in 2031?
The carbon fiber market size is expected to reach 562.77 kilotons by 2031, reflecting an 18.06% CAGR from 2026 levels.
Which region is forecast to expand fastest?
Asia-Pacific is projected to grow at a 20.75% CAGR through 2031, supported by precursor capacity, offshore wind, and automotive programs.
How quickly is recycled carbon fiber growing?
Recycled grades are forecast to post a 19.87% CAGR between 2026 and 2031 as automotive and wind customers seek circular materials.
Why is polyacrylonitrile the dominant precursor?
PAN offers a 50-55% carbon yield and tensile strengths above 4,800 MPa, which keeps supply economics favorable despite rising energy costs.
What technology is reducing composite cycle time?
Automated fiber-placement with laser consolidation lowers layup cycles by up to 70%, bringing part costs within reach for automotive volumes.
Page last updated on:


