Market Overview
| Study Period | 2021 - 2031 |
|---|---|
| Forecast Data Period | 2026 - 2031 |
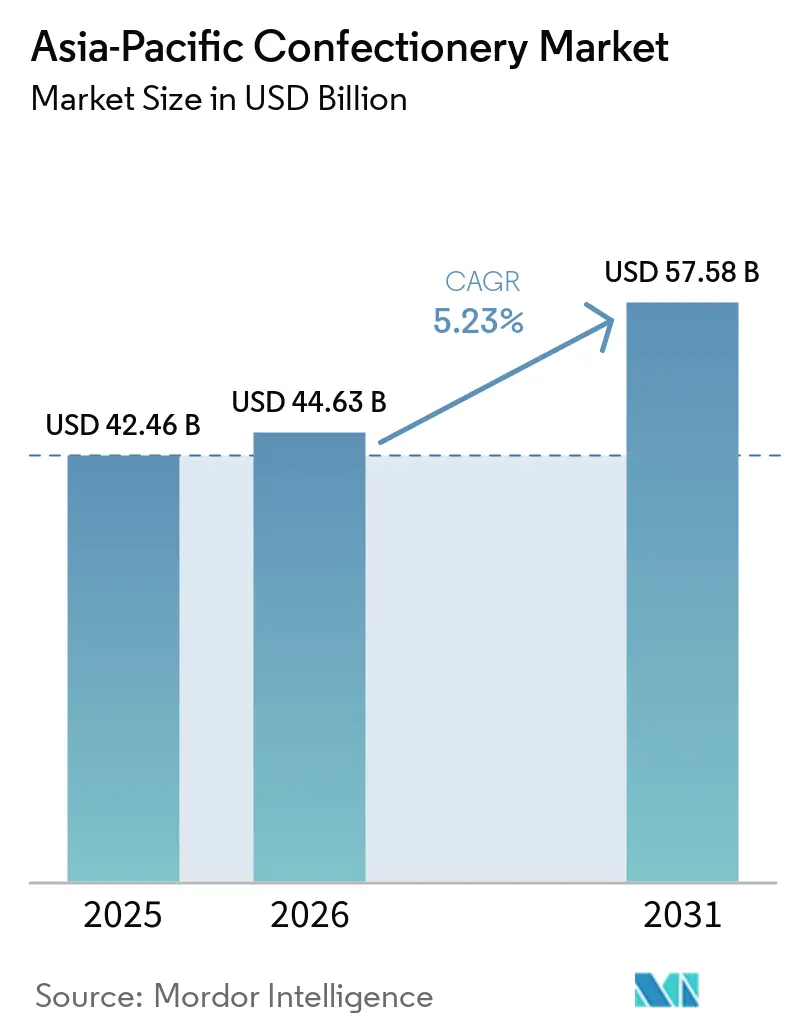
| Base Year Market Size (2025) | USD 42.46 Billion |
| Market Size (2026) | USD 44.63 Billion |
| Market Size (2031) | USD 57.58 Billion |
| Growth Rate (2026 - 2031) | 5.23% CAGR |
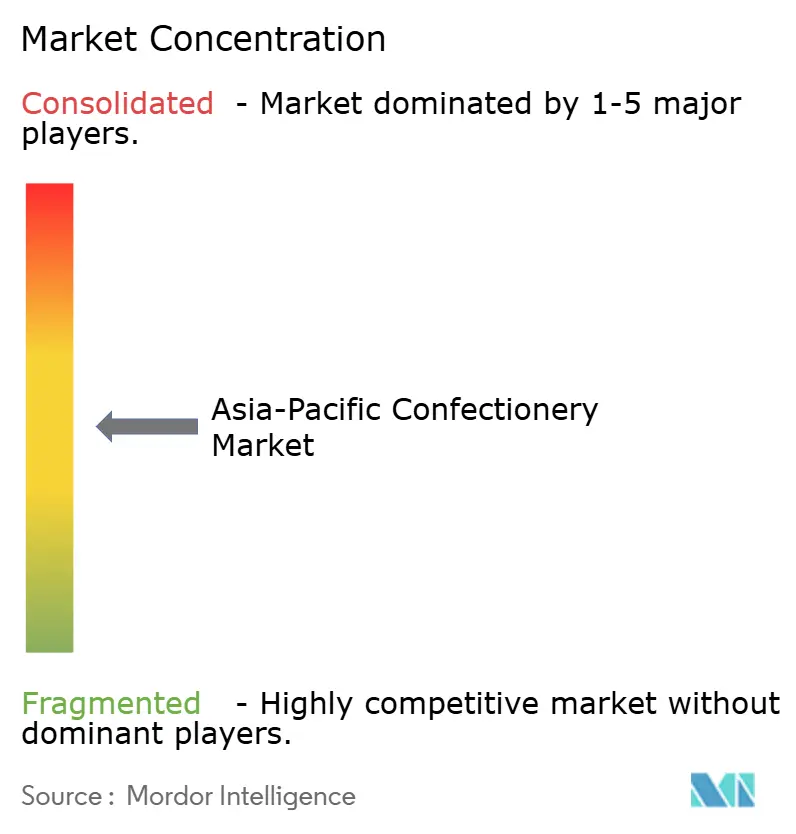
| Market Concentration | Medium |
Major Players
*Disclaimer: Major Players sorted in no particular order Image © Mordor Intelligence. Reuse requires attribution under CC BY 4.0. |
|
Asia-Pacific Confectionery Market Analysis by Mordor Intelligence
The Asia-Pacific confectionery market was valued at USD 42.46 billion in 2025 and is expected to reach USD 44.63 billion in 2026 and USD 57.58 billion by 2031, registering a CAGR of 5.23%, indicating consistent demand across the region. This momentum is rooted in the fusion of rising disposable income with deeply ingrained gifting traditions, shielding category volumes from broader retail slowdowns. Manufacturers preserved margins despite 2024’s record cocoa spike by substituting ingredients, accelerating portfolio premiumization, and passing partial costs through selective price-point migration. Chocolate retains primacy, yet snack bars are redefining consumption occasions as meal-replacement trends converge with fitness aspirations. Digital commerce is amplifying reach, especially where it solves cold-chain gaps, while evolving sugar-tax frameworks are nudging brands toward clean-label and sugar-reduced reformulations.
Key Report Takeaways
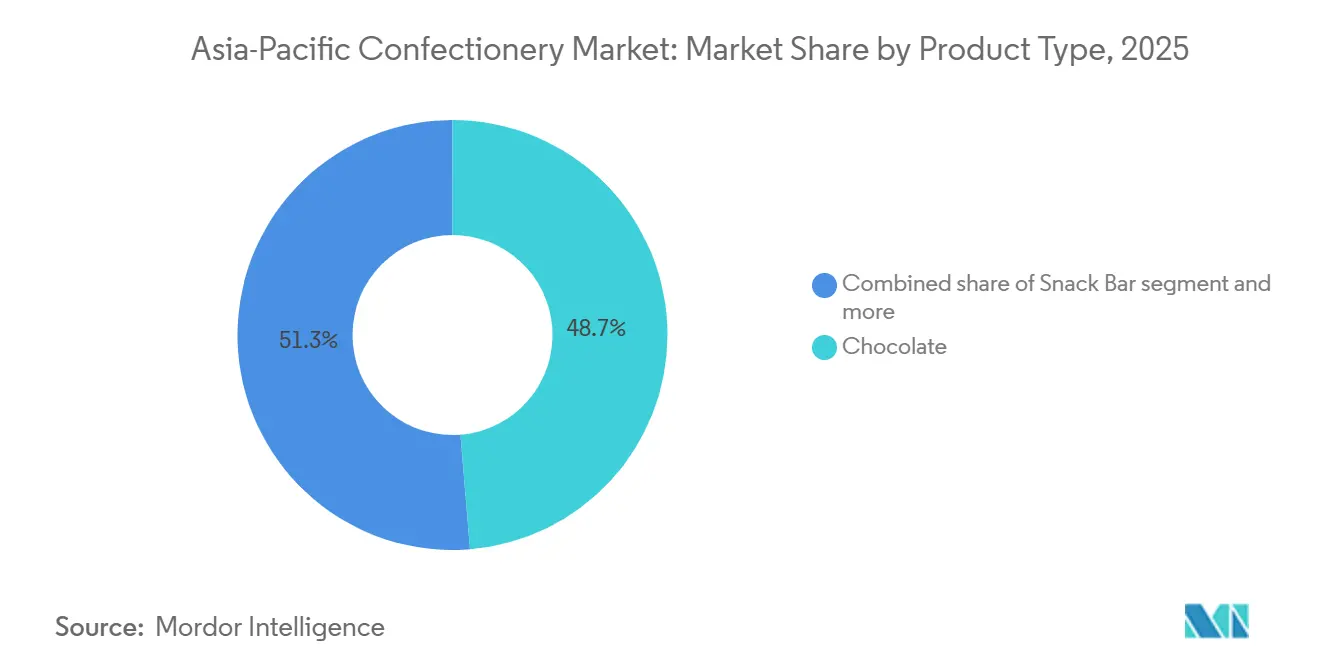
- By product type, chocolate captured 48.71% of the Asia-Pacific confectionery market share in 2025 and snack bars are forecast to advance at a 6.95% CAGR through 2031.
- By packaging type, single-serve formats led with 62.10% share in 2025, whereas multipacks register the fastest 7.09% CAGR through 2031.
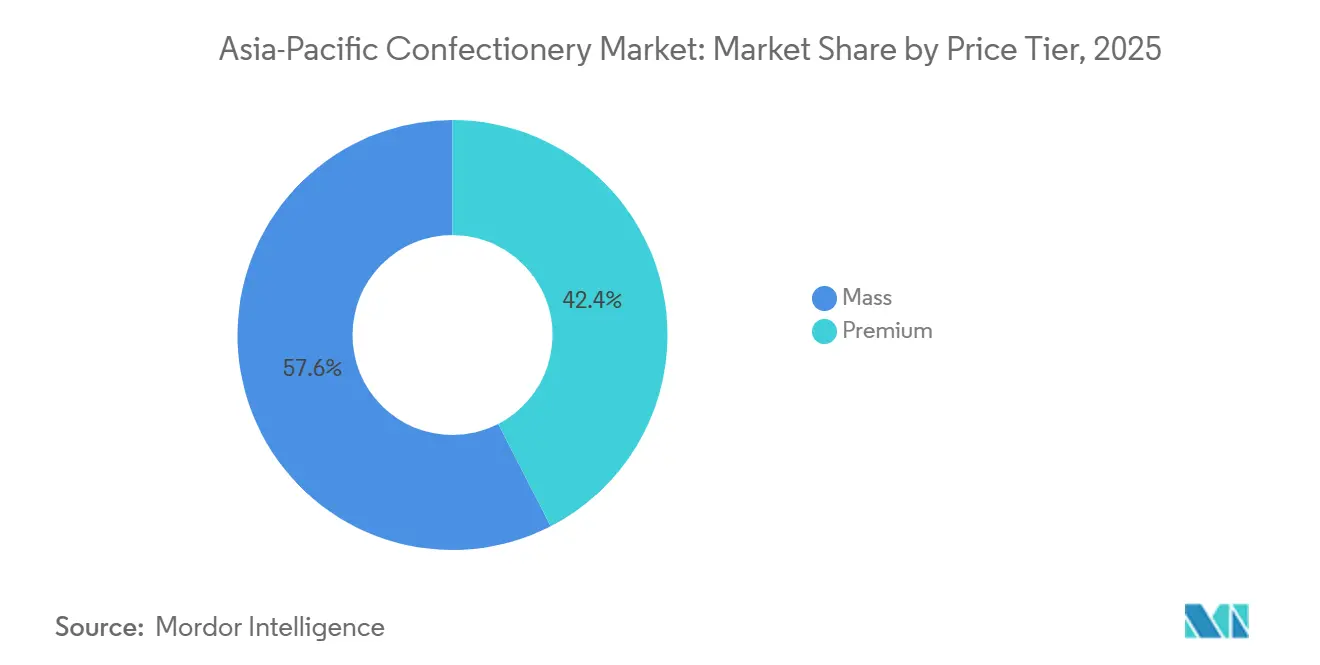
- By price tier, mass offerings accounted for 57.56% of value in 2025, but premium lines are expanding at a 7.89% CAGR through 2031.
- By distribution channel, Supermarkets/Hypermarkets held 32.38% of sales in 2025, yet online retail is pacing ahead with an 8.45% CAGR through 2031.
- By geography, China dominated with a 29.05% revenue contribution in 2025, while India is poised for the quickest 7.14% CAGR through 2031.
Note: Market size and forecast figures in this report are generated using Mordor Intelligence’s proprietary estimation framework, updated with the latest available data and insights as of January 2026.
Asia-Pacific Confectionery Market Trends and Insights
Drivers Impact Analysis*
| Driver | (~) % Impact on CAGR Forecast | Geographic Relevance | Impact Timeline |
|---|---|---|---|
| Strong cultural integration of confectionery in gifting and festivities | +0.9% | China, India, Thailand, Singapore, South Korea | Long term (≥ 4 years) |
| Growing preference for clean-label and natural ingredients | +0.7% | Japan, Australia, Singapore, urban China | Medium term (2-4 years) |
| Expansion of sugar-reduced and functional confectionery | +0.8% | Asia-Pacific core markets with regulatory push (Thailand, Singapore, India) | Medium term (2-4 years) |
| Rise of snack bars as convenient, protein-enriched alternatives | +1.1% | Urban centers across China, India, Japan, Australia | Short term (≤ 2 years) |
| Premiumisation demand for innovative flavours and formats | +0.6% | Japan, Singapore, South Korea, urban China | Medium term (2-4 years) |
| Ethical sourcing of ingredients, eco-friendly packaging | +0.5% | Australia, New Zealand, Japan, Singapore | Long term (≥ 4 years) |
| Source: Mordor Intelligence | |||
Strong cultural integration of confectionery in gifting and festivities
In the Asia-Pacific region, confectionery holds significant cultural, religious, and social importance, serving as a key component of gifting and festive celebrations. Events such as Lunar New Year in China, Diwali in India, the Mid-Autumn Festival in Southeast Asia, Christmas, and various local harvest festivals see widespread use of sweets, chocolates, and specialty candies as offerings, gifts, and celebratory treats. This cultural relevance leads to seasonal demand surges and motivates manufacturers to develop limited-edition, themed, and premium products aligned with local traditions. Furthermore, the practice of gifting confectionery enhances brand engagement and loyalty, as consumers often prefer well-known brands for meaningful exchanges. The consistent role of confectionery in celebrations drives both sales volumes and opportunities for premiumization, positioning festivals and gifting occasions as key growth drivers for the Asia-Pacific confectionery market.
Growing preference for clean-label and natural ingredients
Consumers in the Asia-Pacific region are increasingly prioritizing clean-label and naturally sourced ingredients in confectionery, driven by growing health consciousness and awareness of sustainability. Products emphasizing organic certifications, minimal processing, and natural flavors or colors are particularly attractive to modern consumers seeking transparency and quality. In Japan, for example, 31.5% of the population preferred products with eco-labels such as Organic JAS or eco-fishing certifications, while 84.5% favored domestically produced goods in 2024, highlighting strong preferences for safe, traceable, and locally sourced ingredients[1]Source: Maff, "Regarding consideration for the environment and awareness of origins and producers", maff.go.jp. This trend is prompting manufacturers to reformulate products using organic cocoa, fruit extracts, plant-based colorants, and naturally derived sweeteners, while also emphasizing provenance and ethical sourcing. Consequently, clean-label and natural formulations not only meet the demands of health-conscious and environmentally aware consumers but also enhance brand trust and loyalty, supporting sustained growth in the Asia-Pacific confectionery market.
Expansion of sugar-reduced and functional confectionery
The growth of sugar-reduced and functional confectionery in the Asia-Pacific market is driven by increasing health awareness and the rising prevalence of lifestyle-related diseases. In 2024, over 31.4% of adults aged 20–79 in Pakistan and 21.1% in Malaysia were reported to have diabetes, underscoring the demand for healthier dietary alternatives [2]Source: World Bank, "Diabetes prevalence (% of population ages 20 to 79)", worldbank.org. Consumers are increasingly opting for low-sugar, nutrient-enriched, and functional products that provide added health benefits, such as vitamins, probiotics, and antioxidants. Additionally, governments in the region are introducing sugar reduction policies and labeling regulations, encouraging product reformulation. Urbanization, rising middle-class incomes, and fast-paced lifestyles are further boosting the demand for convenient, health-oriented confectionery, particularly among millennials and Gen Z, who seek wellness-focused options without compromising taste. In response, manufacturers are developing reformulated classics, fortified products, and offerings with cross-category functional benefits, enabling differentiation in a competitive market and addressing the evolving preferences of health-conscious consumers in Asia-Pacific.
Rise of snack bars as convenient, protein-enriched alternatives to traditional sweets
The increasing popularity of snack bars as convenient, protein-rich alternatives to traditional sweets is significantly influencing the Asia-Pacific confectionery market. Consumers in the region are showing a growing preference for on-the-go, nutrient-dense snacks that offer both indulgence and functional benefits, particularly high protein content to support satiety, muscle health, and active lifestyles. In China, this trend is further driven by rising demand for products catering to endurance athletes, including long-distance runners, cyclists, and swimmers. Energy bars designed to enhance performance and recovery are gaining prominence in 2025 in China [3]Source: Glanbia Nutritionals, "Sports Nutrition: An Updated Look at Chinese Consumer Trends in 2025", glanbianutritionals.com. This shift highlights a broader consumer inclination toward health-focused, convenient formats that can replace traditional high-sugar confectionery while addressing nutritional needs. As a result, manufacturers are focusing on developing fortified, portable, and functional snack bars across the Asia-Pacific market.
Restraints Impact Analysis*
| Restraint | (~) % Impact on CAGR Forecast | Geographic Relevance | Impact Timeline |
|---|---|---|---|
| Rising health concerns and sugar-tax regulations | -0.8% | Thailand, India, Indonesia, Singapore | Short term (≤ 2 years) |
| Fragmented cold-chain limiting premium chocolate distribution | -0.4% | India, Indonesia, Thailand, rural China | Medium term (2-4 years) |
| Volatility in cocoa and sugar prices | -0.6% | Global, with acute impact on import-dependent markets (India, Southeast Asia) | Short term (≤ 2 years) |
| Artisanal premium pricing alienating mass-market consumers | -0.3% | India, Indonesia, Philippines, rural markets across Asia-Pacific | Medium term (2-4 years) |
| Source: Mordor Intelligence | |||
Rising health concerns and sugar-tax regulations
The Asia-Pacific confectionery market is constrained by rising health concerns and the implementation of sugar-tax regulations, which are hindering the growth of traditional high-sugar products. Increasing awareness of obesity, diabetes, and other lifestyle-related diseases is driving consumers to reduce sugar consumption, leading to a shift in preference toward healthier alternatives and a decline in demand for conventional confectionery. Governments in the region, including those in India, Thailand, and Malaysia, are enforcing sugar taxes, mandatory nutrition labeling, and marketing restrictions on high-sugar products. These measures increase production costs for manufacturers and pose compliance challenges. In response to these regulatory pressures and intensified public health campaigns, companies are reformulating products, investing in functional and low-sugar alternatives, and revising pricing strategies. These factors collectively limit the growth of traditional confectionery segments in the Asia-Pacific market.
Fragmented cold-chain limiting premium chocolate distribution
The fragmented cold-chain infrastructure in the Asia-Pacific region significantly limits the distribution of premium chocolate products in Asia Pacific, which require stringent temperature-controlled conditions to ensure quality and prevent spoilage. Many emerging markets in the region lack dependable refrigerated logistics and storage systems, resulting in increased distribution costs, product losses, and reduced availability in smaller cities and rural areas. The absence of robust cold-chain networks leads to inefficiencies in transportation and storage, further exacerbating the challenges faced by manufacturers. This hinders the growth of the high-end confectionery market, as manufacturers encounter difficulties in consistently reaching consumers while maintaining the taste, texture, and premium positioning of their products.
*Our forecasts treat driver/restraint impacts as directional, not additive. The impact forecasts reflect baseline growth, mix effects, and variable interactions.
Segment Analysis
By Product Type: Snack Bars Disrupt Traditional Hierarchies
Chocolate held a 48.71% market share in 2025, underscoring its established role as the core category. However, snack bars, with a compound annual growth rate (CAGR) of 6.95% through 2031, indicate a shift toward functional nutrition that extends beyond traditional confectionery boundaries. Within the chocolate segment, dark chocolate is gaining market share, driven by its perceived health benefits, such as flavonoid content and reduced sugar levels. Premium dark chocolate variants are expected to grow by 9% year-on-year in Japan and Australia in 2025.
While milk and white chocolate continue to drive volume, particularly in gifting formats, they face challenges from sugar-reduction regulations, which disproportionately impact higher-sugar products. Sugar confectionery, which includes hard candies, lollipops, mints, pastilles, gummies, jellies, toffees, and nougats, caters to price-sensitive consumers and impulse purchases. Among these, gummies and jellies are experiencing the strongest growth, driven by innovations in texture and the addition of functional ingredients like vitamins. The gum segment is diverging: bubble gum is declining as younger consumers move away from the format, while sugar-free chewing gum is maintaining its market share in mature markets such as South Korea and Japan, where its oral-care benefits remain relevant.


By Packaging Type: Multipacks Gain as E-Commerce Scales
Single-serve formats accounted for 62.10% of packaging sales in 2025, reflecting their strong presence in impulse-driven channels such as convenience stores, vending machines, and checkout counters. These formats are favored for their portion control and price-point accessibility, which drive consumer conversions. However, multipacks are projected to grow at a CAGR of 7.09% through 2031, supported by e-commerce platforms that encourage bulk purchasing through subscription discounts and free-shipping incentives. In India, quick-commerce platforms that deliver groceries within 10 to 15 minutes are increasing multipack adoption in urban areas, where consumers prioritize convenience and reduced shopping frequency over unit economics. In Japan, the aging population is boosting demand for multipacks, as elderly consumers prefer fewer shopping trips. Additionally, family-size formats remain popular in rural areas, where multi-generational households are more common.
Innovation in single-serve packaging is increasingly focused on sustainability, with brands testing compostable wrappers and refillable dispensers to address concerns about plastic waste. Meanwhile, multipacks are incorporating features such as resealable closures and portion-control options to enhance convenience while maintaining their cost-per-unit advantage, which appeals to value-conscious households. The evolution of packaging segmentation highlights a broader dynamic between on-the-go convenience and economic efficiency. While digital commerce is shifting consumer preferences toward bulk formats, physical retail continues to sustain the dominance of single-serve packaging.
By Price Tier: Premium Segment Outpaces Mass Despite Smaller Base
Mass-market products accounted for 57.56% of the value share in 2025. Premium confectionery is projected to grow at a CAGR of 7.89% through 2031, driven by affluent consumers in Singapore, Japan, and urban China who value artisanal provenance, single-origin cocoa, and limited-edition collaborations with celebrity chefs. Singapore's premium segment benefits from its position as a regional gifting hub, where corporate buyers procure high-end assortments for client entertainment and employee recognition programs. Mass-market brands are maintaining their share by introducing mid-tier variants that feature premium elements, such as darker cocoa content or exotic flavors, while avoiding luxury price points.
The growth of the premium segment is limited by affordability constraints in emerging markets, where monthly per-capita confectionery spending ranges from USD 2 to USD 4, restricting consumption to urban elites and special occasions. However, rising incomes and premiumization trends in China and India are expected to narrow the gap between mass-market and premium segments by 2031, as middle-class expansion increases the potential customer base for affordable luxury offerings.
By Distribution Channel: Online Retail Disrupts Traditional Hierarchies
Supermarkets/hypermarkets accounted for 32.38% of the distribution share in 2025, benefiting from their ability to provide wide assortments, promotional pricing, and the convenience of one-stop shopping, which appeals to family-oriented consumers. However, online retail is experiencing rapid growth, with a CAGR of 8.45% projected through 2031, marking it as the fastest-growing channel. This growth is driven by digital platforms addressing last-mile cold-chain challenges and offering personalized recommendations that increase basket sizes. In Southeast Asia, social commerce is emerging as a distinct channel, with brands utilizing platforms like WhatsApp and Instagram to enable peer-to-peer sales and influencer-driven product discovery, particularly for premium and artisanal goods.
Convenience stores remain essential in markets like Japan and South Korea, where their high density, approximately one store per 2,000 residents in urban areas, and 24-hour operations make them the preferred channel for impulse purchases and immediate consumption. Specialty stores, such as chocolate boutiques and confectionery chains, are expanding in affluent markets, offering curated product assortments and experiential retail experiences that justify premium pricing. The fragmented distribution landscape presents opportunities for omnichannel strategies that integrate physical and digital touchpoints. These strategies enable brands to engage consumers across various purchase occasions while optimizing inventory allocation based on real-time demand insights.
Geography Analysis
China accounted for a 29.05% revenue share in 2025, establishing itself as the central market in the region. However, its growth rate is slowing compared to historical trends. Confectionery consumption per capita in coastal provinces is stabilizing as increasing health awareness curbs indulgence, and regulatory measures targeting sugar content become stricter. Meanwhile, Southeast Asia, including Thailand, Singapore, Indonesia, and the Philippines, is experiencing faster growth compared to mature markets. However, the region faces challenges such as fragmented cold-chain infrastructure and evolving regulatory environments.
India is expected to grow at a 7.14% CAGR through 2031, marking the fastest growth rate in the region. This expansion is driven by demographic advantages, the growth of organized retail, and rising incomes, which are bringing millions into the consuming class each year. With a median age of 28 years, India benefits from a younger population that demonstrates higher trial rates and greater acceptance of Western confectionery formats, such as chocolate bars and gummies. The FSSAI's front-of-pack labeling mandate, set to take effect in 2024, is encouraging brands to reduce sugar content and adopt clean-label reformulations to avoid red warnings that could deter health-conscious consumers.
Japan, Australia, and New Zealand are mature markets with high per-capita consumption, but volume growth is limited due to aging populations and saturated distribution networks. In Australia, organic and clean-label segments are expanding, with certified-organic confectionery sales projected to grow by 12% year-on-year in 2025, reflecting increasing consumer demand for transparency and sustainability. These trends highlight the growing importance of health-conscious and sustainable product offerings in mature markets.
Competitive Landscape
The Asia-Pacific confectionery market demonstrates moderate concentration, characterized by a duopoly of multinational corporations dominating the chocolate and gum segments, alongside a fragmented array of regional specialists focusing on sugar confectionery and local flavor variations. Companies such as Mars, Mondelez, Nestlé, and Ferrero hold a substantial share of the regional chocolate market, leveraging extensive global supply chains, long-established brand equity, and strong distribution networks to secure prominent shelf space in modern retail outlets.
Strategic approaches in the market emphasize portfolio diversification, with leading players acquiring or introducing products in faster-growing categories such as snack bars and functional confectionery to counterbalance the stagnation in traditional segments. Health-focused reformulation is widespread, driven by regulatory requirements and evolving consumer preferences. Brands are increasingly replacing sugar with alternatives like stevia, fortifying products with vitamins, and promoting clean-label attributes in their marketing efforts.
Growth opportunities in the market are concentrated in three key areas: functional confectionery offering measurable health benefits beyond basic nutrition, regional flavor innovations that draw from local culinary traditions, and direct-to-consumer models that reduce distributor margins while enabling personalized subscription services. Additionally, technology adoption is advancing rapidly, with companies utilizing AI-driven demand forecasting to optimize inventory, augmented-reality packaging to enhance consumer engagement, and blockchain technology to verify ethical sourcing practices.
Asia-Pacific Confectionery Industry Leaders
-
Ferrero International SA
-
Mars Incorporated
-
Mondelēz International Inc.
-
Nestlé SA
-
The Hershey Company
- *Disclaimer: Major Players sorted in no particular order

Recent Industry Developments
- September 2025: Cadbury Dairy Milk has launched a new product, Milkinis, in India. This chocolate bar features a smooth milk crème-filled center encased in the brand's classic chocolate. The product is designed to cater to evolving consumer snacking habits and on-the-go indulgence. Milkinis is available in two pack sizes, catering to both individual consumption and sharing occasions. The launch is supported by a comprehensive 360-degree marketing campaign, including television, digital media, influencer collaborations, and social storytelling.
- September 2025: Läderach has opened its first chocolateries in Japan, marking the Swiss premium chocolate brand's entry into the Japanese market. The new stores, located in Tokyo and Yokohama, offer handcrafted chocolate creations such as truffles, pralines, and signature bars. This expansion blends Swiss chocolate craftsmanship with Japan's appreciation for quality and presentation. The launch aligns with the company’s global growth strategy, leveraging Japan’s sophisticated confectionery market to strengthen its presence in Asia-Pacific.
- August 2024: Pakka Limited and Brawny Bear have launched India’s first energy bars in fully compostable flexible packaging. These bars combine functional nutrition with sustainable packaging solutions, appealing to environmentally conscious consumers. The initiative aims to reduce plastic waste while providing convenient, on-the-go energy from wholesome ingredients.
- April 2024: Mondelez’s The Natural Confectionery Co. has introduced a new range of products with 50% less sugar. This initiative addresses the growing consumer demand for healthier treats without compromising on taste. The reformulated sweets utilize natural sweeteners and ingredient optimization to reduce sugar content while maintaining flavor and texture. This launch aligns with health and wellness trends and reflects the brand’s commitment to offering healthier confectionery options for sugar-conscious consumers.


Asia-Pacific Confectionery Market Report Scope
Chocolate, Gums, Snack Bar, Sugar Confectionery are covered as segments by Confections. Convenience Store, Online Retail Store, Supermarket/Hypermarket, Others are covered as segments by Distribution Channel. Australia, China, India, Indonesia, Japan, Malaysia, New Zealand, South Korea are covered as segments by Country.
By Product Type
| Chocolate | Dark Chocolate | |
| Milk and White Chocolate | ||
| Sugar Confectionery | Hard Candy/Hard-boiled Sweets | |
| Lollipops | ||
| Mints | ||
| Pastilles, Gummies, and Jellies | ||
| Toffees and Nougats | ||
| Others | ||
| Gum | Bubble Gum | |
| Chewing Gum | Sugar Chewing Gum | |
| Sugar-free Chewing Gum | ||
| Snack Bar | Cereal Bar | |
| Energy Bar | ||
| Fruit & Nut Bar | ||
| Protein Bar | ||
Packaging type
| Single-serve |
| Multipacks Source |
Price Tier
| Mass |
| Premium |
Distribution Channel
| Supermarkets/Hypermarkets |
| Convenience Stores |
| Online Retail |
| Specialty Stores |
| Others |
Geography
| China |
| Japan |
| India |
| Thailand |
| Singapore |
| Indonesia |
| South Korea |
| Australia |
| New Zealand |
| Rest of Asia-Pacific |
| By Product Type | Chocolate | Dark Chocolate | |
| Milk and White Chocolate | |||
| Sugar Confectionery | Hard Candy/Hard-boiled Sweets | ||
| Lollipops | |||
| Mints | |||
| Pastilles, Gummies, and Jellies | |||
| Toffees and Nougats | |||
| Others | |||
| Gum | Bubble Gum | ||
| Chewing Gum | Sugar Chewing Gum | ||
| Sugar-free Chewing Gum | |||
| Snack Bar | Cereal Bar | ||
| Energy Bar | |||
| Fruit & Nut Bar | |||
| Protein Bar | |||
| Packaging type | Single-serve | ||
| Multipacks Source | |||
| Price Tier | Mass | ||
| Premium | |||
| Distribution Channel | Supermarkets/Hypermarkets | ||
| Convenience Stores | |||
| Online Retail | |||
| Specialty Stores | |||
| Others | |||
| Geography | China | ||
| Japan | |||
| India | |||
| Thailand | |||
| Singapore | |||
| Indonesia | |||
| South Korea | |||
| Australia | |||
| New Zealand | |||
| Rest of Asia-Pacific | |||


Market Definition
- Milk and White Chocolate - Milk chocolates is a solid chocolate made with milk (in the form of either milk powder, liquid milk, or condensed milk) and cocoa solids. White chocolate is made from cocoa butter and milk and contains no cocoa solids whatsoever. The scope includes regular chocolates, low-sugar, and sugar-free variants
- Toffees & Nougats - Toffees include hard, chewy, and small or one-bite candies marketed with labels as toffee or toffee-like confectionery. Nougat is a chewy confection with almond, sugar, and egg white as a basic ingredient; and it originated in Europe and Middle East countries.
- Cereals Bars - A snack composed of breakfast cereal that has been compressed into a bar shape and is held together with a form of edible adhesive. The scope includes snack bars made with cereals such as rice, oats, corn, etc. mixed with a binding syrup. These also include products labeled as cereal bars, cereal treat bars, or grain bars.
- Chewing Gum - This is a preparation for chewing, usually made of flavored and sweetened chicle or such substitutes as polyvinyl acetate. The types of chewing gums included in the scope are sugar-chewing gums and sugar-free chewing gums
| Keyword | Definition |
|---|---|
| Dark Chocolate | Dark chocolate is a form of chocolate containing cocoa solids and cocoa butter without the milk. |
| White Chocolate | White chocolate is the type of chocolate containing the highest percentage of milk solids, typically around or over 30 percent. |
| Milk Chocolate | Milk chocolate is made from dark chocolate that has a low cocoa solid content and higher sugar content, plus a milk product. |
| Hard Candy | A candy made of sugar and corn syrup boiled without crystallizing. |
| Toffees | A hard, chewy, often brown sweet that is made from sugar boiled with butter. |
| Nougats | A chewy or brittle candy containing almonds or other nuts and sometimes fruit. |
| Cereal bar | A cereal bar is a bar-shaped food product, made by pressing cereals and usually dried fruit or berries, which are in most cases held together by glucose syrup. |
| Protein bar | Protein bars are nutrition bars that contain a high proportion of protein to carbohydrates/fats. |
| Fruit & Nut bar | These are often based on dates with other dried fruit and nut additions and, in some cases, flavorings. |
| NCA | The National Confectioners Association is an American trade organization that promotes chocolate, candy, gum and mints, and the companies that make these treats. |
| CGMP | Current good manufacturing practices are those conforming to the guidelines recommended by relevant agencies. |
| Unstandardized foods | Unstandardized foods are those that do not have a standard of identity or that deviate from a prescribed standard in any manner. |
| GI | The glycemic index (GI) is a way of ranking carbohydrate-containing foods based on how slowly or quickly they are digested and increase blood glucose levels over a period of time |
| Skimmed milk powder | Skimmed milk powder is obtained by removing water from pasteurized skim milk by spray-drying. |
| Flavanols | Flavanols are a group of compounds found in cocoa, tea, apples, and many other plant-based foods and beverages. |
| WPC | Whey protein concentrate- the substance obtained by the removal of sufficient nonprotein constituents from pasteurized whey so that the finished dry product contains greater than 25% protein. |
| LDL | Low density Lipoprotein- the bad cholesterol |
| HDL | High density Lipoprotein- the good cholesterol |
| BHT | butylated Hydroxytoluene is a lab-made chemical that is added to foods as a preservative. |
| Carrageenan | Carrageenan is an additive used to thicken, emulsify, and preserve foods and drinks. |
| Free form | Not containing certain ingredients, such as gluten, dairy, or sugar. |
| Cocoa butter | It is a fatty substance obtained from cocoa beans, used in the manufacture of confectionery. |
| Pastellies | A type of of Brazilian candy made from sugar, eggs, and milk. |
| Draggees | Small, round candies that are coated with a hard sugar shell |
| CHOPRABISCO | Royal Belgian Association of the chocolate, pralines, biscuit, and confectionery industry- A trade association that represents the Belgian chocolate industry. |
| European Directive 2000/13 | A European Union directive that regulates the labeling of food products |
| Kakao-Verordnung | The German chocolate ordinance, a set of regulations that define what can be labeled as "chocolate" in Germany. |
| FASFC | Federal Agency for the Safety of the Food Chain |
| Pectin | A natural substance that is derived from fruits and vegetables. It is used in confectionery to create a gel-like texture. |
| Invert sugars | A type of sugar that is made up of glucose and fructose. |
| Emulsifier | A substance that helps to mix to liquids that does not mix together. |
| Anthocyanins | A type of flavonoid that is responsible for the red, purple, and blue colors of confectionery. |
| Functional Foods | Foods that have been modified to provide additional health benefits beyond basic nutrition. |
| Kosher certificate | This certification verifies that the ingredients, production process including all machinery, and/or food-service process complies with the standards of Jewish dietary law |
| Chicory root extract | A natural extract from the chicory root that is a good source of fiber, calcium, phosphorous, and folate |
| RDD | Recommended daily dose |
| Gummies | A chewy gelatin-based candy that is often flavored with fruit. |
| Nutraceuticals | Food or dietary supplements that are claimed to have health benefits. |
| Energy bars | Snack bars that are high in carbohydrates and calories are designed to provide energy on the go. |
| BFSO | Belgian Food Safety Organization for the food chain. |


Research Methodology
Mordor Intelligence follows a four-step methodology in all our reports.
- Step-1: Identify Key Variables: In order to build a robust forecasting methodology, the variables and factors identified in Step 1 are tested against available historical market numbers. Through an iterative process, the variables required for market forecast are set, and the model is built on the basis of these variables.
- Step-2: Build a Market Model: Market-size estimations for the forecast years are in nominal terms. Inflation is not a part of the pricing, and the average selling price (ASP) is kept constant throughout the forecast period for each country.
- Step-3: Validate and Finalize: In this important step, all market numbers, variables, and analyst calls are validated through an extensive network of primary research experts from the market studied. The respondents are selected across levels and functions to generate a holistic picture of the market studied.
- Step-4: Research Outputs: Syndicated Reports, Custom Consulting Assignments, Databases & Subscription Platforms


