APAC Commercial Vehicle Market Size

| Icons | Lable | Value |
|---|---|---|
|
|
Study Period | 2016 - 2029 |
|
|
Market Size (2024) | USD 399.92 Billion |
|
|
Market Size (2029) | USD 611.06 Billion |
|
|
Largest Share by Body Type | Trucks |
|
|
CAGR (2024 - 2029) | 8.85 % |
|
|
Largest Share by Country | China |
Major Players |
||
|
|
||
|
*Disclaimer: Major Players sorted in no particular order |
APAC Commercial Vehicle Market Analysis
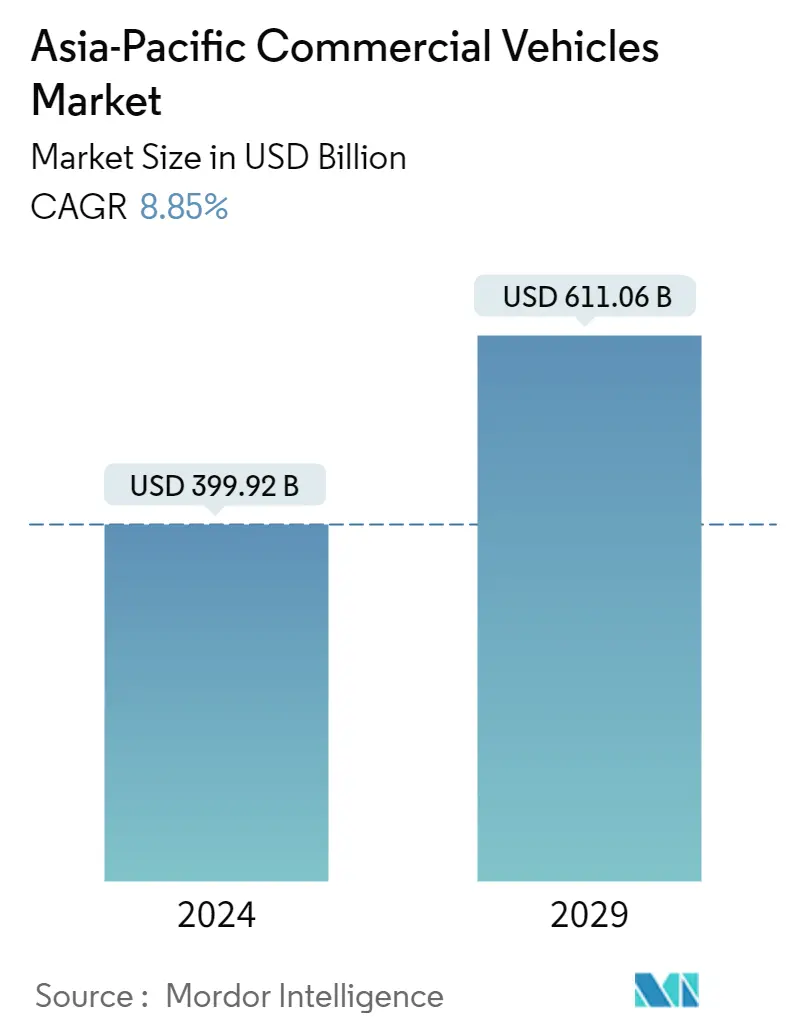
The Asia-Pacific Commercial Vehicles Market size is estimated at USD 399.92 billion in 2024, and is expected to reach USD 611.06 billion by 2029, growing at a CAGR of 8.85% during the forecast period (2024-2029).
- Largest Segment by Fuel Type - Gasoline : The majority of sales across all fuel categories were diesel-fueled CV, as diesel is the traditional fuel engine, generates more power, and is easy availability is a must in commercial usage.
- Fastest-growing Segment by Fuel Type - HEV : The norms introduced by the government, awareness of e-mobility, development in charging infrastructure and incentiveS is making BEV as fastest growing fuel type in the APAC commercial vehicle market.
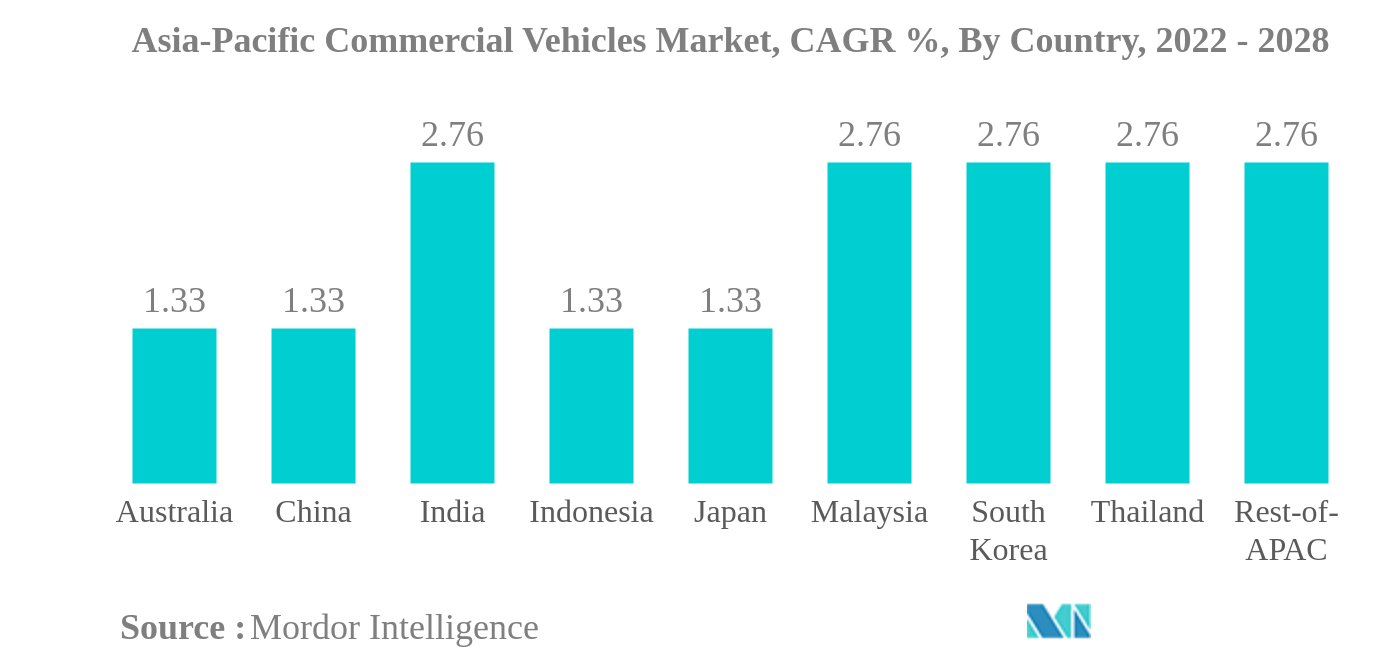
- Largest Country market - China : China has witnessed the largest share in APAC commercial vehicle sales due to the growth in construction, the eCommerce sector, and logistics activities over the past few years.
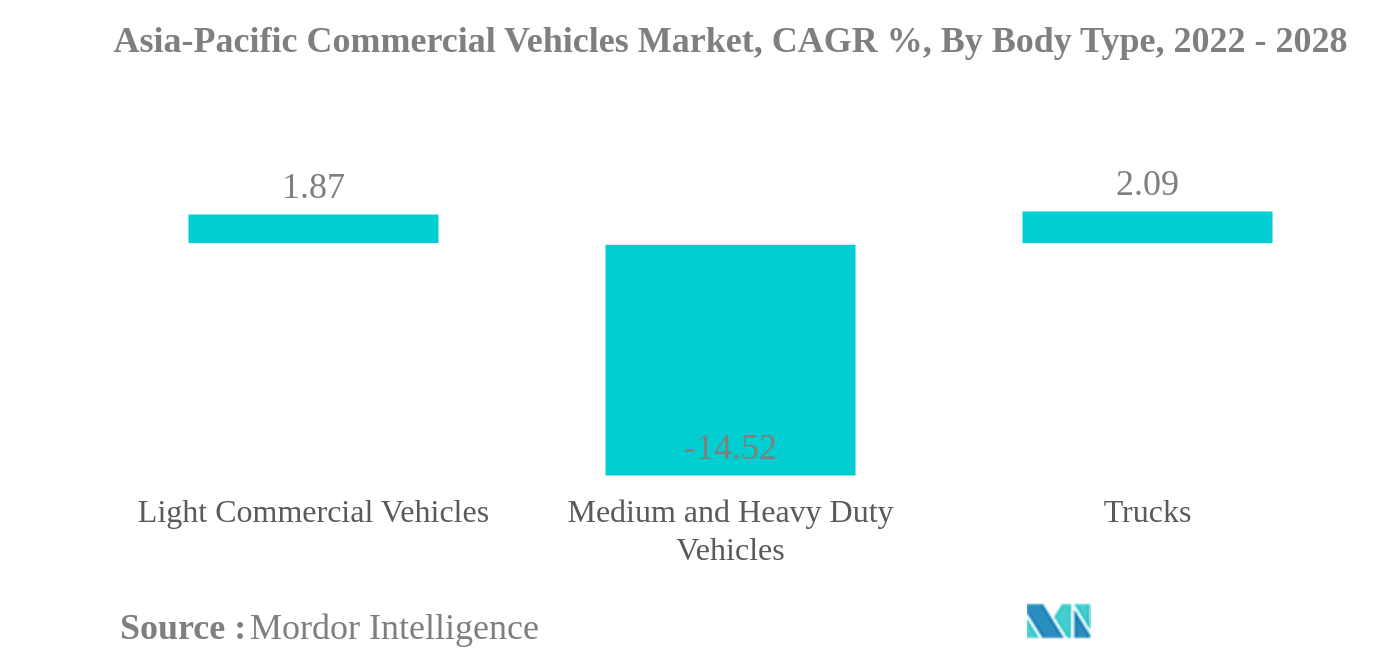
- Largest Segment by Body Type - Trucks : The demand for light commercial cars is growing continuously owing to the expanding logistics and e-commerce sectors and development in construction activities.
APAC Commercial Vehicle Market Trends
This section covers the major market trends shaping the APAC Commercial Vehicle Market according to our research experts:
Trucks is the largest segment by Body Type.
China is the largest segment by Country.
- Trade channels have been opened due to the relocation of industrial output to Asia, particularly China, which has indirectly benefited the market for commercial vehicles and the logistics sector. Due to the expansion of the logistics and e-commerce sectors, there will certainly be a rise in the demand for LCVs. The expanding Chinese economy has given the middle class in China more disposable income. This has a favorable effect on the rising demand for both commercial and passenger automobiles. Due to the low cost of production in the nation, the demand for automobile production has significantly increased over the past five years.
- The COVID-19 outbreak has prevented the growth of the Asia-Pacific commercial vehicle sector because of restrictions on commerce and travel imposed by the local authorities. Due to the local COVID-19 outbreak, commercial vehicle sales plummeted. As a result of the COVID-19 pandemic, shoppers are seeking low-cost goods, which is changing the local commercial vehicle market.
- Despite numerous obstacles to the adoption of EVs, the Government of India is aiming to develop a shared, connected, and electric mobility option. Such efforts will surely spur the expansion of commercial vehicles in the long run. Governments in Asia must invest USD 26 trillion in infrastructure by 2030, which will substantially facilitate the transportation of building supplies and machinery throughout the continent. Strict pollution rules prompted automakers (OEMs) to switch to electric vehicles. As they learn more about the future of mobility, modern start-ups and entrepreneurs are increasingly choosing commercial electric vehicles as their top option.
APAC Commercial Vehicle Industry Overview
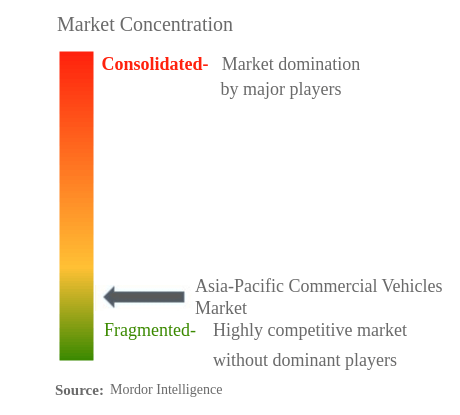
The Asia-Pacific Commercial Vehicles Market is fragmented, with the top five companies occupying 28.45%. The major players in this market are Dongfeng Motor Corporation, Ford Motor Company, Isuzu Motors Ltd, Tata Motors and Toyota Motor Corporation (sorted alphabetically).
APAC Commercial Vehicle Market Leaders
Dongfeng Motor Corporation
Ford Motor Company
Isuzu Motors Ltd
Tata Motors
Toyota Motor Corporation
*Disclaimer: Major Players sorted in no particular order
APAC Commercial Vehicle Market News
- August 2022: Tata Motors Ltd, and Ford India Private Limited (FIPL), have signed a Unit Transfer Agreement (UTA) for the acquisition of FIPL's manufacturing plant situated at Sanand, Gujarat.
- August 2022: Mahindra & Mahindra Ltd. (M&M) and the Volkswagen Group announced to expand their cooperation. Both companies signed a term sheet on the supply of MEB electric components for Mahindra's new, purpose-built electric platform INGLO, deepening the partnering agreement from earlier this year.
- August 2022: Mahindra & Mahindra Ltd. announced the launch of the Bolero MaXX Pik-Up, a new brand of futuristic pickups, catering to the transport and logistics needs of modern India.
APAC Commercial Vehicle Market Report - Table of Contents
1. EXECUTIVE SUMMARY & KEY FINDINGS
2. REPORT OFFERS
3. INTRODUCTION
3.1. Study Assumptions & Market Definition
3.2. Scope of the Study
3.3. Research Methodology
4. KEY INDUSTRY TRENDS
4.1. Population
4.2. GDP
4.3. CVP
4.4. Inflation Rate
4.5. Interest Rate For Auto Loans
4.6. Battery Price (per Kwh)
4.7. Logistics Performance Index
4.8. Electrification Impact
4.9. New XEV Models Announced
4.10. Charging Stations Deployment
4.11. Regulatory Framework
4.12. Value Chain & Distribution Channel Analysis
5. MARKET SEGMENTATION
5.1. Vehicle Type
5.1.1. Commercial Vehicles
5.1.1.1. Buses
5.1.1.2. Heavy-duty Commercial Trucks
5.1.1.3. Light Commercial Pick-up Trucks
5.1.1.4. Light Commercial Vans
5.1.1.5. Medium-duty Commercial Trucks
5.2. Engine Type
5.2.1. Hybrid And Electric Vehicles
5.2.1.1. By Fuel Type
5.2.1.1.1. BEV
5.2.1.1.2. FCEV
5.2.1.1.3. HEV
5.2.1.1.4. PHEV
5.2.2. ICE
5.2.2.1. By Fuel Type
5.2.2.1.1. CNG
5.2.2.1.2. Diesel
5.2.2.1.3. Gasoline
5.2.2.1.4. LPG
5.3. Country
5.3.1. Australia
5.3.2. China
5.3.3. India
5.3.4. Indonesia
5.3.5. Japan
5.3.6. Malaysia
5.3.7. South Korea
5.3.8. Thailand
5.3.9. Rest-of-APAC
6. COMPETITIVE LANDSCAPE
6.1. Key Strategic Moves
6.2. Market Share Analysis
6.3. Company Landscape
6.4. Company Profiles
6.4.1. BYD Co. Ltd
6.4.2. Daihatsu Motor Co. Ltd
6.4.3. Dongfeng Motor Corporation
6.4.4. Fiat Chrysler Automobiles
6.4.5. Ford Motor Company
6.4.6. Hino Motor Ltd
6.4.7. Honda Motor Company
6.4.8. Hyundai Motor Company
6.4.9. Isuzu Motors Ltd
6.4.10. Mahindra & Mahindra
6.4.11. Mitsubishi
6.4.12. Scania AB
6.4.13. Tata Motors
6.4.14. Toyota Motor Corporation
7. KEY STRATEGIC QUESTIONS FOR VEHICLES CEOS
8. APPENDIX
8.1. Global Overview
8.1.1. Overview
8.1.2. Porter's Five Forces Framework
8.1.3. Global Value Chain Analysis
8.1.4. Market Dynamics (DROs)
8.2. Sources & References
8.3. List of Tables & Figures
8.4. Primary Insights
8.5. Data Pack
8.6. Glossary of Terms
List of Tables & Figures
- Figure 1:
- ASIA-PACIFIC COMMERCIAL VEHICLES MARKET, POPULATION YOY GROWTH RATE, MILLION UNITS, 2016 – 2026
- Figure 2:
- ASIA-PACIFIC COMMERCIAL VEHICLES MARKET, GDP YOY GROWTH RATE, USD MILLION, 2016 – 2026
- Figure 3:
- ASIA-PACIFIC COMMERCIAL VEHICLES MARKET, CVP YOY GROWTH RATE, 2016 – 2027
- Figure 4:
- ASIA-PACIFIC COMMERCIAL VEHICLES MARKET, INFLATION RATE YOY GROWTH RATE, PERCENT, 2016 – 2026
- Figure 5:
- ASIA-PACIFIC COMMERCIAL VEHICLES MARKET, INTEREST RATE FOR AUTO LOANS YOY GROWTH RATE, PERCENT, 2016 – 2026
- Figure 6:
- ASIA-PACIFIC COMMERCIAL VEHICLES MARKET, BATTERY PRICES YOY GROWTH RATE, 2016 – 2026
- Figure 7:
- ASIA-PACIFIC COMMERCIAL VEHICLES MARKET, LPI YOY GROWTH RATE, 2016 – 2026
- Figure 8:
- ASIA-PACIFIC COMMERCIAL VEHICLES MARKET, ELECTRIFICATION IMPACT, VOLUME, YOY GROWTH RATE, PERCENT, 2016 – 2026
- Figure 9:
- ASIA-PACIFIC COMMERCIAL VEHICLES MARKET, NEW XEV MODELS ANNOUNCED, VOLUME, YOY GROWTH RATE, UNITS, 2016 – 2026
- Figure 10:
- ASIA-PACIFIC COMMERCIAL VEHICLES MARKET, CHARGING STATIONS DEPLOYMENT, VOLUME, YOY GROWTH RATE, UNITS, 2016 – 2026
- Figure 11:
- ASIA-PACIFIC COMMERCIAL VEHICLES MARKET, VOLUME IN UNITS, 2016 – 2026
- Figure 12:
- ASIA-PACIFIC COMMERCIAL VEHICLES MARKET, VALUE IN USD, 2016 – 2026
- Figure 13:
- ASIA-PACIFIC COMMERCIAL VEHICLES MARKET, BY SUB BODY TYPE, BY VOLUME IN UNITS, 2016-2028
- Figure 14:
- ASIA-PACIFIC COMMERCIAL VEHICLES MARKET, BY SUB BODY TYPE, BY VALUE IN USD, 2016-2028
- Figure 15:
- ASIA-PACIFIC COMMERCIAL VEHICLES MARKET MARKET, SHARE(%), BY SUB BODY TYPE, 2016 - 2028
- Figure 16:
- ASIA-PACIFIC COMMERCIAL VEHICLES MARKET MARKET, SHARE(%), BY SUB BODY TYPE, 2016 - 2028
- Figure 17:
- ASIA-PACIFIC COMMERCIAL VEHICLES MARKET, BY BUSES, BY VOLUME IN UNITS, 2016-2028
- Figure 18:
- ASIA-PACIFIC COMMERCIAL VEHICLES MARKET, BY BUSES, BY VALUE IN USD, 2016-2028
- Figure 19:
- ASIA-PACIFIC COMMERCIAL VEHICLES MARKET MARKET, SHARE(%), BY ENGINE TYPE, 2021 - 2028
- Figure 20:
- ASIA-PACIFIC COMMERCIAL VEHICLES MARKET, BY HEAVY-DUTY COMMERCIAL TRUCKS, BY VOLUME IN UNITS, 2016-2028
- Figure 21:
- ASIA-PACIFIC COMMERCIAL VEHICLES MARKET, BY HEAVY-DUTY COMMERCIAL TRUCKS, BY VALUE IN USD, 2016-2028
- Figure 22:
- ASIA-PACIFIC COMMERCIAL VEHICLES MARKET MARKET, SHARE(%), BY ENGINE TYPE, 2021 - 2028
- Figure 23:
- ASIA-PACIFIC COMMERCIAL VEHICLES MARKET, BY LIGHT COMMERCIAL PICK-UP TRUCKS, BY VOLUME IN UNITS, 2016-2028
- Figure 24:
- ASIA-PACIFIC COMMERCIAL VEHICLES MARKET, BY LIGHT COMMERCIAL PICK-UP TRUCKS, BY VALUE IN USD, 2016-2028
- Figure 25:
- ASIA-PACIFIC COMMERCIAL VEHICLES MARKET MARKET, SHARE(%), BY ENGINE TYPE, 2021 - 2028
- Figure 26:
- ASIA-PACIFIC COMMERCIAL VEHICLES MARKET, BY LIGHT COMMERCIAL VANS, BY VOLUME IN UNITS, 2016-2028
- Figure 27:
- ASIA-PACIFIC COMMERCIAL VEHICLES MARKET, BY LIGHT COMMERCIAL VANS, BY VALUE IN USD, 2016-2028
- Figure 28:
- ASIA-PACIFIC COMMERCIAL VEHICLES MARKET MARKET, SHARE(%), BY ENGINE TYPE, 2021 - 2028
- Figure 29:
- ASIA-PACIFIC COMMERCIAL VEHICLES MARKET, BY MEDIUM-DUTY COMMERCIAL TRUCKS, BY VOLUME IN UNITS, 2016-2028
- Figure 30:
- ASIA-PACIFIC COMMERCIAL VEHICLES MARKET, BY MEDIUM-DUTY COMMERCIAL TRUCKS, BY VALUE IN USD, 2016-2028
- Figure 31:
- ASIA-PACIFIC COMMERCIAL VEHICLES MARKET MARKET, SHARE(%), BY ENGINE TYPE, 2021 - 2028
- Figure 32:
- ASIA-PACIFIC COMMERCIAL VEHICLES MARKET, BY ENGINE TYPE, BY VOLUME IN UNITS, 2016-2028
- Figure 33:
- ASIA-PACIFIC COMMERCIAL VEHICLES MARKET, BY ENGINE TYPE, BY VALUE IN USD, 2016-2028
- Figure 34:
- ASIA-PACIFIC COMMERCIAL VEHICLES MARKET MARKET, SHARE(%), BY ENGINE TYPE, 2016 - 2028
- Figure 35:
- ASIA-PACIFIC COMMERCIAL VEHICLES MARKET MARKET, SHARE(%), BY ENGINE TYPE, 2016 - 2028
- Figure 36:
- ASIA-PACIFIC COMMERCIAL VEHICLES MARKET, BY FUEL TYPE, BY VOLUME IN UNITS, 2016-2028
- Figure 37:
- ASIA-PACIFIC COMMERCIAL VEHICLES MARKET, BY FUEL TYPE, BY VALUE IN USD, 2016-2028
- Figure 38:
- ASIA-PACIFIC COMMERCIAL VEHICLES MARKET MARKET, SHARE(%), BY FUEL TYPE, 2016 - 2028
- Figure 39:
- ASIA-PACIFIC COMMERCIAL VEHICLES MARKET MARKET, SHARE(%), BY FUEL TYPE, 2016 - 2028
- Figure 40:
- ASIA-PACIFIC COMMERCIAL VEHICLES MARKET, BY BEV, BY VOLUME IN UNITS, 2016-2028
- Figure 41:
- ASIA-PACIFIC COMMERCIAL VEHICLES MARKET, BY BEV, BY VALUE IN USD, 2016-2028
- Figure 42:
- ASIA-PACIFIC COMMERCIAL VEHICLES MARKET MARKET, SHARE(%), BY BODY TYPE, 2021 - 2028
- Figure 43:
- ASIA-PACIFIC COMMERCIAL VEHICLES MARKET, BY FCEV, BY VOLUME IN UNITS, 2016-2028
- Figure 44:
- ASIA-PACIFIC COMMERCIAL VEHICLES MARKET, BY FCEV, BY VALUE IN USD, 2016-2028
- Figure 45:
- ASIA-PACIFIC COMMERCIAL VEHICLES MARKET MARKET, SHARE(%), BY BODY TYPE, 2021 - 2028
- Figure 46:
- ASIA-PACIFIC COMMERCIAL VEHICLES MARKET, BY HEV, BY VOLUME IN UNITS, 2016-2028
- Figure 47:
- ASIA-PACIFIC COMMERCIAL VEHICLES MARKET, BY HEV, BY VALUE IN USD, 2016-2028
- Figure 48:
- ASIA-PACIFIC COMMERCIAL VEHICLES MARKET MARKET, SHARE(%), BY BODY TYPE, 2021 - 2028
- Figure 49:
- ASIA-PACIFIC COMMERCIAL VEHICLES MARKET, BY PHEV, BY VOLUME IN UNITS, 2016-2028
- Figure 50:
- ASIA-PACIFIC COMMERCIAL VEHICLES MARKET, BY PHEV, BY VALUE IN USD, 2016-2028
- Figure 51:
- ASIA-PACIFIC COMMERCIAL VEHICLES MARKET MARKET, SHARE(%), BY BODY TYPE, 2021 - 2028
- Figure 52:
- ASIA-PACIFIC COMMERCIAL VEHICLES MARKET, BY FUEL TYPE, BY VOLUME IN UNITS, 2016-2028
- Figure 53:
- ASIA-PACIFIC COMMERCIAL VEHICLES MARKET, BY FUEL TYPE, BY VALUE IN USD, 2016-2028
- Figure 54:
- ASIA-PACIFIC COMMERCIAL VEHICLES MARKET MARKET, SHARE(%), BY FUEL TYPE, 2016 - 2028
- Figure 55:
- ASIA-PACIFIC COMMERCIAL VEHICLES MARKET MARKET, SHARE(%), BY FUEL TYPE, 2016 - 2028
- Figure 56:
- ASIA-PACIFIC COMMERCIAL VEHICLES MARKET, BY CNG, BY VOLUME IN UNITS, 2016-2028
- Figure 57:
- ASIA-PACIFIC COMMERCIAL VEHICLES MARKET, BY CNG, BY VALUE IN USD, 2016-2028
- Figure 58:
- ASIA-PACIFIC COMMERCIAL VEHICLES MARKET MARKET, SHARE(%), BY BODY TYPE, 2021 - 2028
- Figure 59:
- ASIA-PACIFIC COMMERCIAL VEHICLES MARKET, BY DIESEL, BY VOLUME IN UNITS, 2016-2028
- Figure 60:
- ASIA-PACIFIC COMMERCIAL VEHICLES MARKET, BY DIESEL, BY VALUE IN USD, 2016-2028
- Figure 61:
- ASIA-PACIFIC COMMERCIAL VEHICLES MARKET MARKET, SHARE(%), BY BODY TYPE, 2021 - 2028
- Figure 62:
- ASIA-PACIFIC COMMERCIAL VEHICLES MARKET, BY GASOLINE, BY VOLUME IN UNITS, 2016-2028
- Figure 63:
- ASIA-PACIFIC COMMERCIAL VEHICLES MARKET, BY GASOLINE, BY VALUE IN USD, 2016-2028
- Figure 64:
- ASIA-PACIFIC COMMERCIAL VEHICLES MARKET MARKET, SHARE(%), BY BODY TYPE, 2021 - 2028
- Figure 65:
- ASIA-PACIFIC COMMERCIAL VEHICLES MARKET, BY LPG, BY VOLUME IN UNITS, 2016-2028
- Figure 66:
- ASIA-PACIFIC COMMERCIAL VEHICLES MARKET, BY LPG, BY VALUE IN USD, 2016-2028
- Figure 67:
- ASIA-PACIFIC COMMERCIAL VEHICLES MARKET MARKET, SHARE(%), BY BODY TYPE, 2021 - 2028
- Figure 68:
- ASIA-PACIFIC COMMERCIAL VEHICLES MARKET, BY COUNTRY, BY VOLUME IN UNITS, 2016-2028
- Figure 69:
- ASIA-PACIFIC COMMERCIAL VEHICLES MARKET, BY COUNTRY, BY VALUE IN USD, 2016-2028
- Figure 70:
- ASIA-PACIFIC COMMERCIAL VEHICLES MARKET MARKET, SHARE(%), BY COUNTRY, 2016 - 2028
- Figure 71:
- ASIA-PACIFIC COMMERCIAL VEHICLES MARKET MARKET, SHARE(%), BY COUNTRY, 2016 - 2028
- Figure 72:
- ASIA-PACIFIC COMMERCIAL VEHICLES MARKET, BY AUSTRALIA, BY VOLUME IN UNITS, 2016-2028
- Figure 73:
- ASIA-PACIFIC COMMERCIAL VEHICLES MARKET, BY AUSTRALIA, BY VALUE IN USD, 2016-2028
- Figure 74:
- ASIA-PACIFIC COMMERCIAL VEHICLES MARKET MARKET, SHARE(%), BY BODY TYPE, 2021 - 2028
- Figure 75:
- ASIA-PACIFIC COMMERCIAL VEHICLES MARKET, BY CHINA, BY VOLUME IN UNITS, 2016-2028
- Figure 76:
- ASIA-PACIFIC COMMERCIAL VEHICLES MARKET, BY CHINA, BY VALUE IN USD, 2016-2028
- Figure 77:
- ASIA-PACIFIC COMMERCIAL VEHICLES MARKET MARKET, SHARE(%), BY BODY TYPE, 2021 - 2028
- Figure 78:
- ASIA-PACIFIC COMMERCIAL VEHICLES MARKET, BY INDIA, BY VOLUME IN UNITS, 2016-2028
- Figure 79:
- ASIA-PACIFIC COMMERCIAL VEHICLES MARKET, BY INDIA, BY VALUE IN USD, 2016-2028
- Figure 80:
- ASIA-PACIFIC COMMERCIAL VEHICLES MARKET MARKET, SHARE(%), BY BODY TYPE, 2021 - 2028
- Figure 81:
- ASIA-PACIFIC COMMERCIAL VEHICLES MARKET, BY INDONESIA, BY VOLUME IN UNITS, 2016-2028
- Figure 82:
- ASIA-PACIFIC COMMERCIAL VEHICLES MARKET, BY INDONESIA, BY VALUE IN USD, 2016-2028
- Figure 83:
- ASIA-PACIFIC COMMERCIAL VEHICLES MARKET MARKET, SHARE(%), BY BODY TYPE, 2021 - 2028
- Figure 84:
- ASIA-PACIFIC COMMERCIAL VEHICLES MARKET, BY JAPAN, BY VOLUME IN UNITS, 2016-2028
- Figure 85:
- ASIA-PACIFIC COMMERCIAL VEHICLES MARKET, BY JAPAN, BY VALUE IN USD, 2016-2028
- Figure 86:
- ASIA-PACIFIC COMMERCIAL VEHICLES MARKET MARKET, SHARE(%), BY BODY TYPE, 2021 - 2028
- Figure 87:
- ASIA-PACIFIC COMMERCIAL VEHICLES MARKET, BY MALAYSIA, BY VOLUME IN UNITS, 2016-2028
- Figure 88:
- ASIA-PACIFIC COMMERCIAL VEHICLES MARKET, BY MALAYSIA, BY VALUE IN USD, 2016-2028
- Figure 89:
- ASIA-PACIFIC COMMERCIAL VEHICLES MARKET MARKET, SHARE(%), BY BODY TYPE, 2021 - 2028
- Figure 90:
- ASIA-PACIFIC COMMERCIAL VEHICLES MARKET, BY SOUTH KOREA, BY VOLUME IN UNITS, 2016-2028
- Figure 91:
- ASIA-PACIFIC COMMERCIAL VEHICLES MARKET, BY SOUTH KOREA, BY VALUE IN USD, 2016-2028
- Figure 92:
- ASIA-PACIFIC COMMERCIAL VEHICLES MARKET MARKET, SHARE(%), BY BODY TYPE, 2021 - 2028
- Figure 93:
- ASIA-PACIFIC COMMERCIAL VEHICLES MARKET, BY THAILAND, BY VOLUME IN UNITS, 2016-2028
- Figure 94:
- ASIA-PACIFIC COMMERCIAL VEHICLES MARKET, BY THAILAND, BY VALUE IN USD, 2016-2028
- Figure 95:
- ASIA-PACIFIC COMMERCIAL VEHICLES MARKET MARKET, SHARE(%), BY BODY TYPE, 2021 - 2028
- Figure 96:
- ASIA-PACIFIC COMMERCIAL VEHICLES MARKET, BY REST-OF-APAC, BY VOLUME IN UNITS, 2016-2028
- Figure 97:
- ASIA-PACIFIC COMMERCIAL VEHICLES MARKET, BY REST-OF-APAC, BY VALUE IN USD, 2016-2028
- Figure 98:
- ASIA-PACIFIC COMMERCIAL VEHICLES MARKET MARKET, SHARE(%), BY BODY TYPE, 2021 - 2028
- Figure 99:
- ASIA-PACIFIC COMMERCIAL VEHICLES MARKET, MOST ACTIVE COMPANIES, BY NUMBER OF STRATEGIC MOVES, 2018 - 2021
- Figure 100:
- ASIA-PACIFIC COMMERCIAL VEHICLES MARKET, MOST ADOPTED STRATEGIES, 2018 - 2021
- Figure 101:
- ASIA-PACIFIC COMMERCIAL VEHICLES MARKET SHARE(%), BY MAJOR PLAYERS, 2021
APAC Commercial Vehicle Industry Segmentation
Commercial Vehicles are covered as segments by Vehicle Type. Hybrid And Electric Vehicles, ICE are covered as segments by Engine Type. Australia, China, India, Indonesia, Japan, Malaysia, South Korea, Thailand, Rest-of-APAC are covered as segments by Country.| Vehicle Type | |||||||
|
| Engine Type | ||||||||
| ||||||||
|
| Country | |
| Australia | |
| China | |
| India | |
| Indonesia | |
| Japan | |
| Malaysia | |
| South Korea | |
| Thailand | |
| Rest-of-APAC |
Market Definition
- Body Type - It includes buses, light commercial vehicles, medium& heavy-duty vehicles, medium and heavy-duty buses, trucks, M&HDT.
- Engine Type - Hybrid and electric vehicles are vehicles that run on batteries and use one or more electric motors for propulsion. .
- Fuel Type - Hybrid and electric vehicles include HEV, PHEV, BEV, and FCEV.
- Sub Body Type - Under this category, buses, heavy-duty commercial trucks, light commercial pickup trucks, light commercial vans, and medium-duty commercial trucks have been included.
- Vehicle Type - It includes passenger vehicles, commercial vehicles, and two wheelers.
- report_titles - Global Electric Vehicles Market
Research Methodology
Mordor Intelligence follows a four-step methodology in all our reports.
- Step-1: Identify Key Variables: In order to build a robust forecasting methodology, the variables and factors identified in Step-1 are tested against available historical market numbers. Through an iterative process, the variables required for market forecast are set and the model is built on the basis of these variables.
- Step-2: Build a Market Model: Market-size estimations for the historical and forecast years have been provided in revenue and volume terms. For sales conversion to volume, the average selling price (ASP) is kept constant throughout the forecast period for each country, and inflation is not a part of the pricing.
- Step-3: Validate and Finalize: In this important step, all market numbers, variables and analyst calls are validated through an extensive network of primary research experts from the market studied. The respondents are selected across levels and functions to generate a holistic picture of the market studied.
- Step-4: Research Outputs: Syndicated Reports, Custom Consulting Assignments, Databases & Subscription Platforms


