
Digital Holography Market Size and Share
Market Overview
| Study Period | 2020 - 2031 |
|---|---|
| Market Size (2026) | USD 5.58 Billion |
| Market Size (2031) | USD 11.03 Billion |
| Growth Rate (2026 - 2031) | 14.62 % |
| Fastest Growing Market | Asia Pacific |
| Largest Market | North America |
| Market Concentration | Low |
Major Players *Disclaimer: Major Players sorted in no particular order Image © Mordor Intelligence. Reuse requires attribution under CC BY 4.0. | |
Digital Holography Market Analysis by Mordor Intelligence
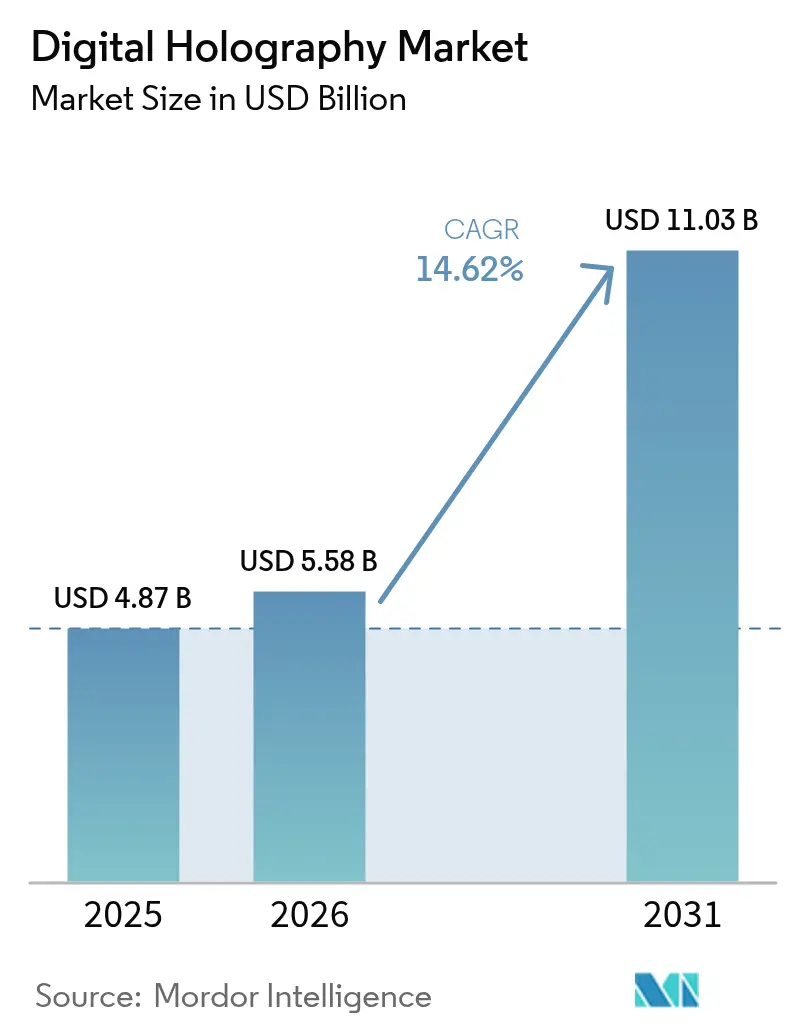
The digital holography market size is expected to grow from USD 4.87 billion in 2025 to USD 5.58 billion in 2026 and is forecast to reach USD 11.03 billion by 2031 at 14.62% CAGR over 2026-2031. A sequence of defense, medical and automotive roll-outs has raised adoption far above the broader imaging-technology field. U.S. programs funding holographic LiDAR for military intelligence, Japanese and South Korean grants supporting label-free cell analysis, and German premium-vehicle head-up-display (HUD) design wins have converged to create a powerful pull for commercial deployments. Bandwidth barriers that once constrained real-time 3D meetings receded after Versatile Video Coding (H.266/VVC) cut data loads by 40%, enabling nationwide U.S. 5G telepresence pilots. Simultaneously, Chinese tier-1 malls proved that volumetric advertising can lift featured-product sales 40%, attracting retailers across Southeast Asia to the digital holography market.
Key Report Takeaways
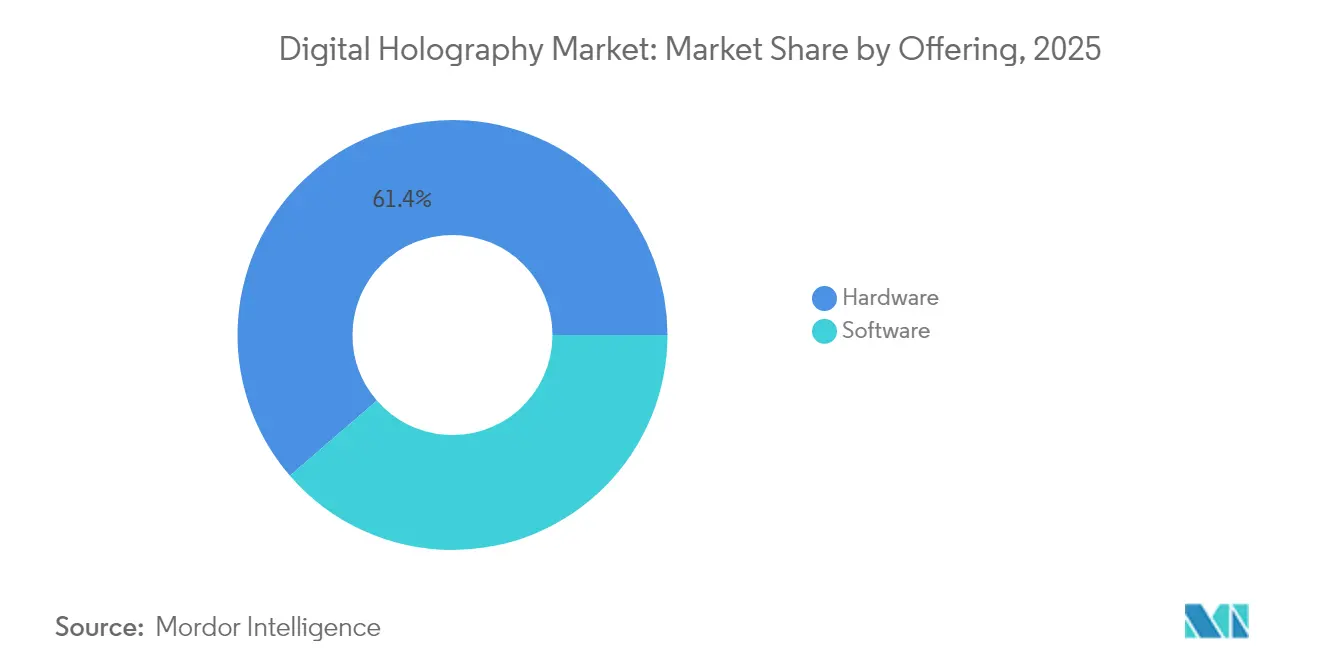
- By offering, hardware held 61.35% of digital holography market share in 2025, whereas software is advancing with a 14.73% CAGR through 2031.
- By technique, off-axis holography led with 68.50% revenue share in 2025; synthetic-aperture methods are rising fastest at a 16.42% CAGR to 2031.
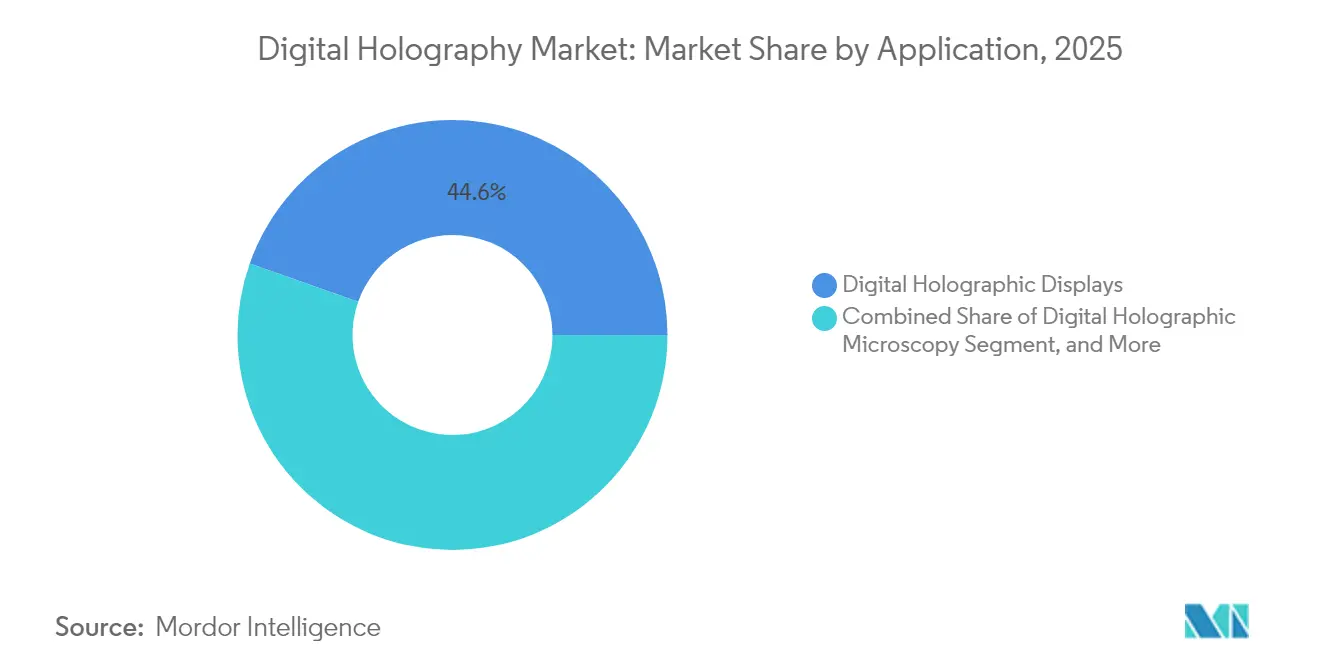
- By application, digital holographic displays accounted for 44.60% share of the digital holography market size in 2025, while telepresence solutions are forecast to expand at 15.22% CAGR.
- By end-user vertical, medical and life sciences captured 31.10% of digital holography market share in 2025; the automotive sector is projected to grow at 15.56% CAGR.
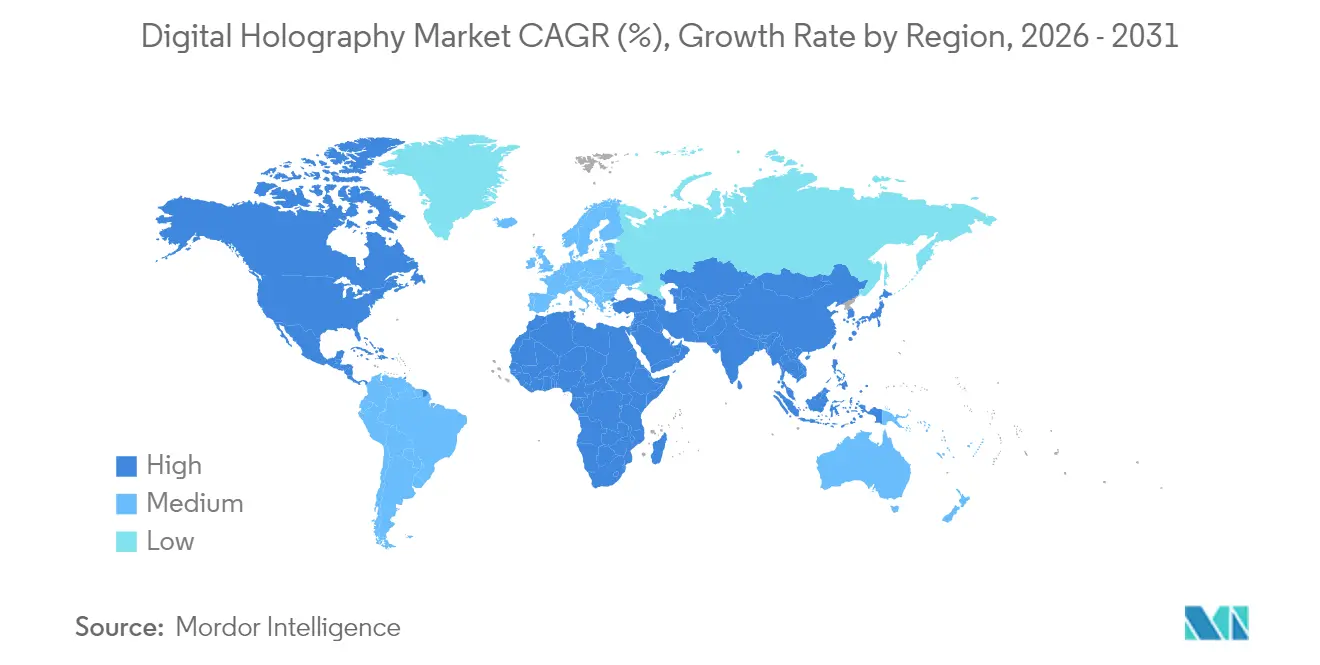
- By region, North America dominated with 41.70% share in 2025, yet Asia–Pacific is projected to rise at a 15.92% CAGR to 2031.
Note: Market size and forecast figures in this report are generated using Mordor Intelligence’s proprietary estimation framework, updated with the latest available data and insights as of 2026.
Market Trends and Insights
Drivers Impact Analysis of Digital Holography Market*
| Driver | (~) % Impact on CAGR Forecast | Geographic Relevance | Impact Timeline |
|---|---|---|---|
| Label-free quantitative phase imaging in regenerative-medicine trials | +2.2% | Japan and South Korea with spillover to US/EU | Medium term (2-4 years) |
| Holographic HUD adoption by premium German OEMs | +2.3% | Germany; expansion across Europe and North America | Short term (≤ 2 years) |
| H.266/VVC codec enabling bandwidth-light telepresence | +2.3% | United States with global implications | Medium term (2-4 years) |
| Defense funding for holographic LiDAR ISR payloads | +2.5% | Israel and UAE; technology transfer to US | Medium term (2-4 years) |
| Edge-rendered volumetric ads on Chinese 5G-Advanced | +2.4% | China; early roll-outs in SE Asia | Short term (≤ 2 years) |
| AI-assisted reconstruction algorithms boosting image fidelity | +2.1% | Global research labs and OEM toolchains | Medium term (2-4 years) |
| Source: Mordor Intelligence | |||
Surge in label-free quantitative phase imaging demand in regenerative medicine trials
Japanese and South Korean regenerative-medicine investigators increasingly relied on digital holographic microscopy to study living cells without stains, supported by Japan’s USD 215 million grant program in 2025. The ability of digital holography to capture both amplitude and phase information simultaneously enables researchers to analyze living cells with unprecedented detail, revealing cellular morphology and dynamics that remain invisible to conventional microscopy.[1]Frontiers in Physiology, “Cell Image Reconstruction Using Digital Holography With an Improved GS Algorithm,” frontiersin.org Phase Holographic Imaging reported a strategic expansion into the Spanish and Portuguese markets in Q1 2024, specifically targeting regenerative medicine applications. The resulting ability to monitor morphology and cell-cycle kinetics in real time sharpened trial design, shortened discovery timelines and reinforced Asia’s first-mover status in precision cell therapy. Spillover demand appeared in U.S. cancer-research centers adopting the same quantitative-phase workflows.
Adoption of holographic HUDs in premium German automotive OEM 2026 line-ups
German automotive manufacturers are at the forefront of integrating holographic head-up displays (HUDs) into their premium vehicle models, with production implementations scheduled for 2026. BMW Group, Mercedes-Benz and Audi confirmed 2026 model-year launches using windshield-embedded holographic HUDs that maintain 5 000-nit brightness and remain visible through polarized sunglasses.[2]MotorTrend, “Are You Not Infotained?! New In-Car Screen Tech Is Jaw-Dropping at CES 2025,” motortrend.com Eastman, Ceres Holographics and Covestro supplied Holographic In-Plane Transparent Display (HIPTD) films that anchor the solution.[3]Eastman, “Eastman, Ceres Holographics and Covestro Partner to Advance Holographic Transparent Display HUD Technology,” saflex-vanceva.eastman.com By relocating speed, navigation and ADAS alerts into the driver’s line of sight, OEMs targeted higher Euro NCAP scores and reduced distraction-related incidents.
Standardization of H.266/VVC enabling bandwidth-light holographic telepresence on U.S. 5G networks
The finalization of the H.266/Versatile Video Coding (VVC) standard represents a watershed moment for holographic telepresence applications, reducing bandwidth requirements by approximately 40% compared to previous codecs. This efficiency gain is critical for holographic communication, which traditionally demands massive data transmission capabilities. U.S. telecommunications providers are leveraging this advancement to enable real-time holographic telepresence over 5G networks, with commercial deployments beginning in major metropolitan area.[4]Telecom Review Asia, “The Emergence of Holographic Communication in Asia-Pacific Telecommunications,” telecomreviewasia.com Enterprises began evaluating remote-training and executive-briefing applications that promise travel-cost savings and carbon-footprint reductions.
Defense funding for long-range holographic LiDAR ISR payloads in Israel and UAE
Israeli and Emirati ministries of defense awarded multi-year contracts for drone-borne holographic LiDAR able to map 10 km targets with millimeter accuracy, enhancing ISR reach while shrinking sensor weight by 30% compared with scanning-mirror systems. These systems utilize digital holography to achieve unprecedented range and resolution in target identification while maintaining compact form factors suitable for drone and vehicle-mounted deployments. The technology enables 3D mapping of terrain and structures with millimeter-level precision at distances exceeding 10 kilometers, representing a significant advancement over conventional LiDAR systems. Lockheed Martin highlighted the integration of holographic technologies in space and defense applications, noting that these systems enhance situational awareness while reducing size, weight, and power requirements.[5]Lockheed Martin, “Space Technology Trends 2025,” lockheedmartin.com U.S. primes licensed the architecture under export agreements, anticipating integration into next-generation under-30 kg reconnaissance drones.
Restraints Impact Analysis of Digital Holography Market*
| Restraint | (~) % Impact on CAGR Forecast | Geographic Relevance | Impact Timeline |
|---|---|---|---|
| Sparse supply of high-efficiency 4K spatial-light modulators | -0.8% | Global, acute for North America and Europe | Short term (≤ 2 years) |
| Prohibitive clean-room CAPEX (> USD 80 million) for phase-only SLMs | -0.9% | Global, highest for emerging entrants | Long term (≥ 4 years) |
| Lack of volumetric-video standards among LATAM broadcasters | -0.7% | Latin America; secondary global effects | Medium term (2-4 years) |
| Clinician scepticism absent multi-centre RCT evidence | -0.8% | EU and North American healthcare markets | Medium term (2-4 years) |
| Source: Mordor Intelligence | |||
Sparse supply of high-efficiency 4K spatial light modulators from APAC foundries
The digital holography market faces significant supply constraints for high-efficiency 4K spatial light modulators (SLMs), a critical component in holographic display systems. APAC foundries, particularly in Japan and South Korea, are struggling to meet growing demand due to production capacity limitations and competing priorities for semiconductor manufacturing lines. This supply shortage is exacerbated by the specialized nature of SLM production, which requires expertise in both semiconductor fabrication and optical engineering. Recent research has explored alternative approaches, such as digital micromirror devices (DMDs), which offer advantages including higher resolution and faster switching speeds compared to traditional liquid crystal SLMs. Spot prices for phase-only devices spiked 18% in 2025.
Prohibitive clean-room CAPEX (> USD 80 m) for phase-only SLM fabrication
The establishment of new production facilities for phase-only spatial light modulators requires capital expenditures exceeding USD 80 million, primarily for clean-room environments that meet the stringent requirements for optical-grade component manufacturing. This substantial investment barrier is deterring new entrants and limiting expansion of existing production capacity. The high costs are driven by the need for Class 10 or better clean rooms, specialized lithography equipment, and precision optical testing facilities. A study published in Photonics highlighted the challenges in fabricating SLMs with the necessary pixel density and phase modulation capabilities for advanced holographic applications.
*Our forecasts treat driver/restraint impacts as directional, not additive. The impact forecasts reflect baseline growth, mix effects, and variable interactions.
Digital Holography Market Segment Analysis
By Offering:
Software Solutions Accelerate TransformationHardware captured 61.35% of digital holography market share in 2025, anchored by lasers, cameras and spatial-light modulators that convert optical interference into raw holograms. Cameras now exceed 100 MP at sub-3 µm pixel pitches, lifting system-level resolution. Meanwhile, software revenue is on course to add USD 1.58 billion through 2031 as iterative-phase retrieval, neural up-scaling and compression modules become indispensable for turnkey deployments. UCLA researchers demonstrated a recurrent-neural-network reconstruction that lifted structural-similarity metrics 40% and shortened compute time fifteen-fold, underscoring software’s role in unlocking latent value. Industrial original-equipment buyers have shifted to subscription models that bundle firmware upgrades, cloud render pipelines and on-premises debugging utilities in multi-year service-level agreements. These shifts point toward a future in which vendors package complete stacks, compressing integration timelines and amplifying switching costs-thereby raising the digital holography market size in recurring-revenue terms.
Second-generation application-programming interfaces link hologram generation engines with AR/VR design packages, removing barriers that previously fragmented content pipelines. Medical imaging labs exploit open-source Python plug-ins to automate phase-unwrap workflows, cutting experiment-setup times from hours to minutes. Automotive dashboard suppliers license proprietary calibration algorithms that align laser modulators to curved windshields, simplifying field-service logistics and protecting margin. Collectively, these dynamics confirm that software, though representing the smaller top-line slice today, will deliver disproportionate long-term profitability inside the digital holography industry.



By Technique:
Synthetic-Aperture Methods Raise ResolutionOff-axis holography retained 68.50% of revenue in 2025 owing to robust photolithography-mask inspection and aerospace metrology installations. Users appreciate its single-exposure acquisition and inherent noise rejection, which preserve data integrity on vibrating factory floors. Yet synthetic-aperture and hybrid approaches are projected to climb at a 16.42% CAGR, propelled by multiview registration algorithms that chain sequential captures into one ultra-high-numerical-aperture composite. UCLA, Beihang University and Fraunhofer teams each reported > 57° viewing angles derived from synthetic-aperture assembly, tearing down the field-of-view wall that once limited commercial viability.
In-line holography, a workhorse for label-free microscopy, maintains a niche in cost-sensitive university labs that favor simpler alignments over maximal resolution. Touchable-holography prototypes from the Public University of Navarra added tactile feedback via ultrasonic phased arrays in April 2025, prompting museum and ed-tech pilots. The confluence of decreasing laser-diode pricing, precision-servo advances and AI reconstruction now positions hybrid systems to usurp legacy interferometers in inspection lines, potentially redirecting another 5% share toward synthetic-aperture architectures by 2028. If spatial-light-modulator supply stabilizes, the digital holography market share of these techniques could accelerate faster than forecast.
By Application:
Telepresence Momentum Continues Post-PandemicDigital holographic displays accounted for 44.60% of 2025 revenue, serving flagship retail windows, medical theatres and defense planning cells. Brands such as Louis Vuitton reported 30% foot-traffic lifts when volumetric showcases rotated augmented bags in Shanghai malls. Concurrently, telepresence applications chart the quickest 15.22% CAGR. Early adopters in legal arbitration and surgical consulting validated productivity gains when remote participants interacted with life-size holograms rather than two-dimensional video tiles. The IEEE 1918.1.1 working group is drafting content-stream specifications expected to be ratified by 2026, smoothing cross-vendor interoperability.
Microscopy remains indispensable for live-cell biomechanics, corrosion-growth tracking and additive-manufacturing process control. Automotive HUD packages, now shipping in pilot fleets, are slated to enter mid-market trims once cost curves break USD 500 per windshield. Digital-holography-based data-vaults that store interference patterns in photopolymer discs reached 2-terabyte density demonstrations in 2024 and will target sensitive defense archives first. Authentication tags etched as nano-scale phase-gratings onto high-value documents surpassed 1 billion units shipped, illustrating how diversified the digital holography market size has become across use cases.
By End-User Vertical:
Automotive Adoption Curve SteepensMedical and life-science institutions commanded 31.10% of digital holography market share in 2025, financing turnkey microscopes that deliver quantitative-phase videos at 30 fps for stem-cell characterization. Hospitals in Germany and the United States trialed real-time holographic overlays during minimally invasive procedures, using gesture controls to pivot organ models without breaking sterile fields. In parallel, the automotive sector is poised to register a 15.56% CAGR as HUD penetration rises from niche luxury packages to mainstream ADAS platforms. Hyundai Mobis and Zeiss introduced holographic optical elements (HOEs) that refract light for sunlight-readable dashboards, trimming energy budgets versus LCD clusters.
Aerospace defense integrators integrate holographic sensors into small-satellite payloads for Earth-observation data cubes. Retail deploys volumetric ad walls in experiential flagships, and education ministries in South Korea equip classrooms with interactive holography kits to stimulate STEM enrollment. Semiconductor-inspection vendors use sub-nanometric phase mapping to quantify overlay errors, driving metrology tool upgrades on every lithography-node shrink. As these deployments converge, the automotive vertical’s incremental spend acts as a bellwether for consumer-facing holography, further broadening the overall digital holography market.
Geography Analysis
North America Digital Holography Market
North America captured 41.70% of global revenue in 2025, driven by Pentagon R&D allocations and Silicon Valley enterprise pilots. U.S. telecom carriers fast-tracked city-center telepresence studios after H.266/VVC proved bandwidth-viable, turning Chicago, Dallas and San Francisco into early hubs. Canada emerged as a HUD-design incubator, leveraging provincial tax credits to lure optical-component start-ups that feed Detroit and Munich supply chains. Venture funding exceeded USD 300 million in 2025 for Montreal-based sensor firms.
APAC Digital Holography Market
Asia–Pacific, already the fastest-growing region with a 15.92% CAGR, benefited from Beijing’s 5G-Advanced footprint that streams real-time product holograms to high-street boutiques, advancing the digital holography market size for retail. Japanese life-science complexes adopted high-throughput phase-imaging rigs for regenerative-medicine assays, while South Korean automakers synchronized HOE tooling with HUD electronics to shorten ramp-up cycles. India’s e-waste challenge repurposed obsolete LCD backlights into holography-ready light-engines, diverting 500 tons of landfill in 2025.
Europe, Middle East and LATAM Digital Holography Market
Europe sustained momentum through Germany’s auto-tech partnerships and the UK’s National Health Service pilots. Horizon Europe earmarked EUR 95 million for advanced photonics projects in 2025, with phase-only SLM and polymer-film waveguide research receiving first-round grants. Israel and the UAE advanced defense LiDAR adoption, while Turkey initiated smart-city holographic-mapping bids. Latin America trailed due to volumetric-video standard gaps; Brazil’s broadcasters postponed 3D studio renovations pending specification clarity. Notwithstanding, Mexican architectural firms used holographic walk-throughs to win offshore contracts, hinting at latent demand growth once standards mature.

Regulatory Landscape
Digital holography deployments increasingly reference formal interoperability and measurement standards rather than ad hoc file formats and lab-specific calibration. ISO/IEC published ISO/IEC 21794-5:2026 (JPEG Pleno, Part 5: Holography), which defines syntax and decompression for binary and continuous-tone holograms and extends the JPEG Pleno File Format, helping align content capture, storage, and decoding across software stacks. Separately, ISO confirmed ISO 17901-1:2015 in 2025 (systematic review closed June 2025 and confirmation published November 2025), keeping measurement methods for diffraction efficiency and optical characteristics of holograms current for quality-control and procurement specifications.
For regulated end users, compliance requirements shape system design and validation pathways more than display novelty. In Europe, medical and life-science use cases that position holographic visualization or guidance as a medical device must align to EU MDR conformity assessment expectations, while US commercialization commonly maps to FDA clearance routes such as 510(k) or De Novo depending on intended use. As AI-assisted reconstruction and guidance modules become embedded in clinical workflows, risk-based conformity obligations under emerging AI governance frameworks (for example, the EU AI Act) increase the need for traceability, validation datasets, and documented performance limits, alongside optical safety and basic electrical safety standards used in hospital procurement.
Value Chain Analysis
The value chain spans upstream photonics and microfabrication inputs, midstream hologram generation and replication, and downstream integration into vertical solutions such as microscopy, telepresence, and automotive HUDs. Upstream, lithography and patterning toolchains (for example, RAITH workflow solutions for holography) support mastering of holographic optical elements (HOEs), while specialized materials such as photopolymer films remain critical gating items for volume replication. Midstream players combine lasers, image sensors, and spatial light modulators with reconstruction, rendering, and compression software. This reflects the market split where hardware anchors deployments, while software increasingly differentiates performance through AI-assisted reconstruction and system calibration.
Downstream integration is moving toward coordinated consortia that connect materials, optical films, lamination, and Tier-1 module integration for automotive holographic windshield displays. ZEISS formed the QuadAlliance with tesa, Saint-Gobain Sekurit, and Hyundai Mobis in 2026 to align concept design, HOE mastering, replication, lamination, and picture generation unit integration in one coordinated supply chain. Earlier steps include ZEISS agreements in 2025 to strengthen photopolymer film supply with LG Chem and to formalize work with tesa for serial replication of large-format holographically functionalized films. Eastman, Ceres Holographics, and Covestro also signed a 2024 MOU around HIPTD film stacks for HUDs. In parallel, geographic manufacturing strategies are expanding outside traditional optics hubs, illustrated by DigiLens partnering with Kaynes Technology India in 2024 to scale waveguide manufacturing at a greenfield facility in Hyderabad for AR devices, supporting cost, yield, and capacity needs for display-adjacent holographic components.
Competitive Landscape
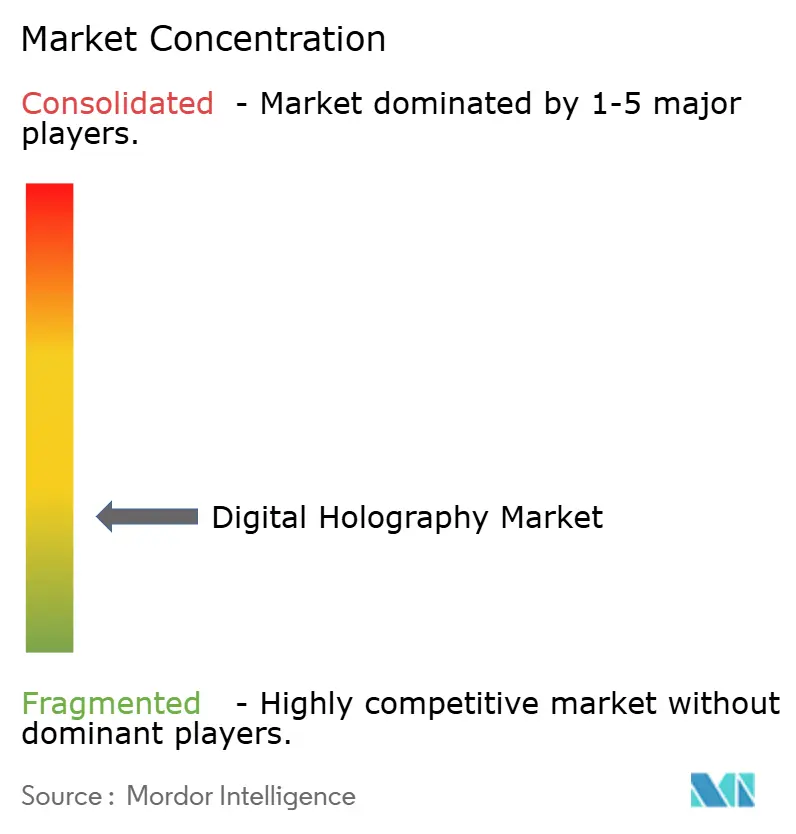
Market concentration remained moderate: the top five suppliers controlled roughly 35% revenue in 2024, leaving space for vertical-specific entrants. Incumbents pursued joint ventures that fuse optics, materials and computation. The Eastman-Ceres-Covestro MoU established a complete windshield-display stack under one roof, reducing OEM validation burdens. RealView Imaging expanded its holographic cardiac-navigation suite, enabling catheter-lab teams to manipulate floating anatomy with ungloved hands. Lyncee TEC shipped interferometric microscopes calibrated for semiconductor front-end lines, tripling Swiss export revenue.
Start-ups targeted whitespace: WayRay delivered proof-of-concept holographic navigation for ride-hale fleets, and Light Field Lab sealed a USD 50 million Series C to miniaturize solid-state emitter arrays for gaming monitors. Component makers hedged supply risk by dual-sourcing phase-shifting backplanes from Taiwanese foundries. AI-centric algorithm suppliers moved upstream, bundling source code with FPGA reference designs to lock in silicon-level dependencies. Collectively these maneuvers intensified the fight for digital holography market share yet also expanded the total addressable market by bundling complementary offerings.
Niche applications remain ripe for first movers. Pharmaceutical simulation suites that visualize protein docking in volumetric space could shave months from drug-discovery cycles. Construction firms piloted on-site holographic blueprints that overlay wiring paths on bare studs, cutting rework costs. As defense, healthcare and mobility leaders validate such use cases, expect sustained M&A as conglomerates assemble capability portfolios, inching concentration upward over the forecast horizon.
Digital Holography Industry Leaders
RealView Imaging Ltd.
Lyncee TEC SA
Leia Inc
Holoxica Limited
EON Reality Inc.
- *Disclaimer: Major Players sorted in no particular order
Digital Holography Market Companies Covered in this Report
- RealView Imaging Ltd.
- Lyncee TEC SA
- Phase Holographic Imaging AB
- EON Reality Inc.
- Geola Digital UAB
- MetroLaser Inc.
- Leia Inc.
- Intelligent Imaging Innovations Inc.
- Light Logics Holography and Optics
- Jasper Display Corporation
- Holoxica Limited
- zSpace Inc.
- EchoPixel Inc.
- Zebra Imaging
- NKT Photonics A/S
- HYPERVSN (Baylan Ltd.)
- Ovizio Imaging Systems NV
- Realfiction ApS
- VNTANA
- Looking Glass Factory Inc.
- SeeReal Technologies GmbH
- Light Field Lab Inc.
- HoloTech Switzerland AG
- Daqri LLC

Market Opportunities and Future Outlook
Standardized hologram coding and file formats create whitespace for cross-vendor content pipelines and managed services that sit above hardware constraints. ISO/IEC 21794-5:2026 (JPEG Pleno holography) provides an interoperability anchor for software vendors offering encoding, decoding, and archiving toolchains for holographic telepresence and volumetric advertising, where content reuse across venues and devices is a commercial requirement. Ongoing work on content-stream specifications in groups such as IEEE 1918.1.1 also supports opportunities for plug-ins, gateways, and QA tooling that reduce integration friction between capture rigs, render engines, and network delivery.
Performance and cost improvements in microscopy and industrial metrology create additional product-market space, particularly where robustness and compactness matter more than maximum optical complexity. Research published in early 2026 highlights pathways such as PEAR-FINCH computational imaging (reported by University of Tartu coverage) to increase depth of focus after recording, and common-path, multi-wavelength, varifocal digital holographic microscopy configurations that improve stability for quantitative phase analysis. These advances align with use cases active in the market context, including label-free cell analysis programs in Japan and South Korea and semiconductor and manufacturing inspection workflows that value repeatability and throughput. The opportunity centers on translating these methods into turnkey, validated instruments and software modules (denoising, phase unwrapping, neural reconstruction) that can be deployed in multi-site trials and production lines without extensive optical reconfiguration.
Recent Industry Developments in Digital Holography Market
- February 2026: Leia Inc. announced a strategic expansion of the Immersity platform into enterprise-grade deployments and multi-device support following demonstrations at MWC Barcelona 2026. The initiative broadens application beyond consumer-centric holographic displays and positions Leia to pursue enterprise contracts and cross-device integration. The update aligns with ongoing industry shifts toward software-defined holography in holographic display ecosystems.
- December 2025: Leia Inc. and Morphotonics completed installation and qualification of the Aurora 1100 Platform, a fully automated Gen-5 roll-to-plate nanoimprint lithography line, to scale production of Immersity Cells. Industrializing nanoimprint capacity supports higher-volume component supply for immersive displays and reduces dependence on smaller-batch pilot lines.
- January 2025: Park Systems Corp. completed its acquisition of Lyncée Tec SA to add digital holographic microscopy capabilities to its metrology portfolio. This combination strengthens automated 3D measurement offerings for semiconductor and advanced packaging workflows, where non-contact inspection is gaining priority.


Digital Holography Market Report Scope and Research Methodology
Market Definition and Coverage
For this study, the digital holography market covers revenue generated from digital capture, processing, reconstruction, and display of holographic information through related hardware and software sold into commercial and institutional uses.
Scope exclusions: We exclude traditional analog holography and optical components sold as general purpose parts when they are not marketed for holography workflows.
Segments Covered in This Report
- By Offering
- Hardware
- Lasers
- CCD/CMOS Image Sensors
- Spatial Light Modulators
- Beam Splitters and Optics
- Processors and Memory
- Software
- Reconstruction Algorithms
- Visualization/Rendering Engines
- Compression and Transmission Software
- Hardware
- By Technique
- Off-Axis Holography
- In-Line Holography
- Synthetic Aperture and Hybrid Techniques
- Touchable Holography
- By Application
- Digital Holographic Displays
- Digital Holographic Microscopy
- Holographic Telepresence and Communication
- Head-Up Displays (Automotive and Aviation)
- Data Storage and Security Authentication
- Manufacturing and Metrology Inspection
- By End-User Vertical
- Medical and Life Sciences
- Aerospace and Defense
- Automotive
- Commercial and Retail
- Education and Research Institutes
- Industrial Automation
- Media and Entertainment
- Consumer Electronics
- By Geography
- North America
- United States
- Canada
- Mexico
- Europe
- Germany
- United Kingdom
- France
- Italy
- Spain
- Nordics (Denmark, Sweden, Norway, Finland)
- Rest of Europe
- Asia-Pacific
- China
- Japan
- South Korea
- India
- Southeast Asia
- Australia
- Rest of Asia-Pacific
- South America
- Brazil
- Argentina
- Rest of South America
- Middle East
- Gulf Cooperation Council Countries
- Turkey
- Rest of Middle East
- Africa
- South Africa
- Nigeria
- Rest of Africa
- North America
Data Sources, Market Sizing, and Validation
Desk Research
Desk work starts with building a clean view of how holography is used and paid for across major end markets, then mapping that to what can be tracked in public data. Sources used include items such as US FDA databases for cleared imaging related products, US Patent and Trademark Office filings for holography related patents, and peer reviewed optics journals that describe adoption in microscopy and metrology.
To understand the demand environment, we also refer to sources such as the US Bureau of Labor Statistics for medical and lab employment signals, OECD and World Bank indicators for R&D intensity and industrial output, and relevant standards and association pages for imaging and photonics. Company annual reports, earnings call notes, and investor presentations help confirm how revenues are described and which applications are prioritized. In a few cases, paid subscriptions for company financials and patent databases are used to fill gaps on private firms and technology activity. The sources listed here are illustrative, and many other public references were also used for data collection, validation, and clarification.
Primary Interviews and Surveys
Primary work is used to sanity check the sizing logic and to pressure test assumptions that desk research cannot fully settle, such as attach rates, typical deal sizes, and the split between microscopy, metrology, and display-led demand. We speak with product owners, sales leaders, application engineers, lab users, and system integrators across APAC, EMEA, and the Americas, because buying decisions can vary by use case and by regional procurement practices.
Distribution of primary research fieldwork respondents
| Company type | Respondent position | Region |
|---|---|---|
| Top tier: 30% | CXOs: 17% | APAC: 41% |
| Mid tier: 51% | Functional/Unit leaders: 26% | EMEA: 37% |
| Smaller Players: 19% | Managers: 57% | Americas: 22% |
Market-Sizing & Forecasting
Market sizing is constructed using a top-down build that starts from the addressed demand pool and then narrows it using observable adoption and spend signals. In practice, we link end-market activity to the points where holography is actually purchased, which are imaging and inspection workflows, lab upgrades, and specialized visualization deployments.
Key inputs include the installed base growth of microscopy and inspection setups in target labs and factories, typical refresh cycles for imaging equipment, the share of workflows that can shift from 2D to holographic reconstruction, and average selling price bands by system type (hardware plus bundled software). We also track indicators like R&D spending trends, the pace of automation in quality control, and the number of advanced imaging publications as supporting signals. Once the top-down totals are built, they are corroborated through selective bottom-up approximations, such as sampled ASP times estimated unit volumes from channel checks and a partial supplier revenue roll-up, and then adjusted where gaps show up.
For forecasting, scenario analysis is used because adoption depends on how fast use cases scale from pilots to routine use. Assumptions for adoption rates, pricing changes, and replacement cycles are aligned to what primary respondents view as realistic over the forecast window, and the final projection is kept consistent with macro indicators and visible capacity constraints. Where bottom-up evidence is thin, such as smaller private suppliers, we bridge the gap using conservative price bands and validated penetration ranges rather than forcing precise unit counts.
Data Validation & Update Cycle
Validation is done by checking whether the modeled totals align with independent signals, such as equipment shipment narratives, lab capital spend direction, and the pacing of new product introductions across key applications. If a segment result looks off, we re-check the driver inputs, review the calculations, and then re-contact a small set of respondents to confirm whether the change is real or just a modeling artifact.
Before sign-off, the work moves through multi-step analyst reviews that look for outliers, sudden jumps, and region splits that do not match known demand patterns. The report is refreshed annually, and interim updates are made when material events occur that can shift pricing, availability, or adoption. Right before delivery, an analyst performs a final pass to ensure the latest public disclosures and market signals are reflected in the published numbers.
Mordor Intelligence's Digital Holography Market Size Measured Against Other Published Estimates
Published market values for digital holography can look far apart because researchers do not always count the same revenue boundaries and they also pick different starting years. Differences in how hardware, software, and services are bundled, plus how rapidly prices are assumed to decline, tend to create the biggest spread.
Key gap drivers usually come from scope and timing choices that are easy to miss. Some estimates lean heavily toward display and experience-led use cases, while others are more centered on microscopy and metrology where purchase cycles and price points behave differently. Currency conversion timing, the choice of base year, and whether interim updates are applied after major product launches can also move the final number even when the CAGR looks similar.
Benchmark comparison
| Source | Market Size | Gaps in Research Methodology |
|---|---|---|
| Mordor Intelligence | USD 5.58 B (2026) | |
| Industry Research Publisher A | USD 4.22 B (2024) | Uses a 2024 base year and a shorter forecast window, which can understate the step-up from newer deployments that ramp after early pilots, especially in lab and inspection buying cycles. |
| Industry Research Publisher B | USD 6.19 B (2026) | Applies a broader scope that can pull in adjacent holographic display and experience spending, and the price and adoption assumptions appear more aggressive across the long-range horizon. |
Equipment refresh-cycle checks and application-level adoption interviews are the evidence that keep Mordor Intelligence tied to what is actually purchased in microscopy, metrology, and specialized visualization, and that is why the 2026 value can sit between a lower base-year anchored view and a wider-scope estimate. The spread in the table mostly comes down to what gets counted as digital holography revenue and how quickly adoption is assumed to scale, which are choices that can be reviewed and repeated when the inputs are clearly stated.


Key Questions Answered in the Report
What core factors are propelling the digital holography market?
Automotive HUD roll-outs, defense spending on long-range LiDAR and rising hospital demand for quantitative phase imaging collectively drive a 14.62% CAGR toward 2031.
Which region is growing fastest and why?
Asia–Pacific is expanding at a 15.92% CAGR, boosted by Chinese retail holography, Japanese regenerative-medicine grants and South Korean industrial deployments.
How does the H.266/VVC codec influence market adoption?
H.266/VVC trims volumetric-stream bandwidth by about 40%, enabling real-time holographic telepresence over existing 5G networks without infrastructure upgrades.
Why is spatial-light-modulator supply a constraint?
High-efficiency 4K SLMs require specialized fabs; limited capacity in Japan and South Korea has raised lead times and costs, hindering new product launches.
Which vertical commands the largest share of revenue?
Medical and life-science users held 31.10% of 2025 revenue because holography delivers non-invasive, high-resolution imaging vital for cell therapy and surgical planning.
How are leading companies strengthening competitive positions?
They form alliances that integrate optics, materials and AI-such as Eastman, Ceres Holographics and Covestro-shortening time-to-market and securing incremental digital holography market share.
How large is the Digital Holography market in 2026?
The digital holography market is expected to grow from USD 4.87 billion in 2025 to USD 5.58 billion in 2026 and is forecast to reach USD 11.03 billion by 2031 at 14.62% CAGR over 2026-2031
Page last updated on:


 Your data is secure and never sold or shared.


