Market Overview
| Study Period | 2019 - 2031 |
|---|---|
| Forecast Data Period | 2026 - 2031 |
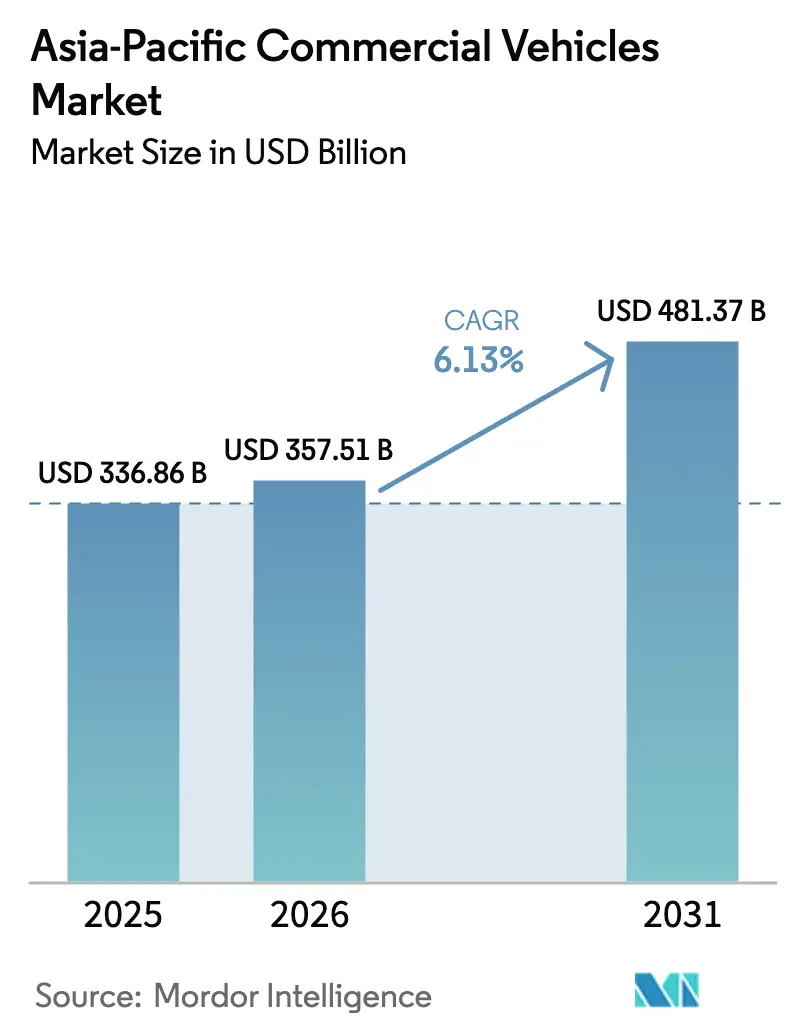
| Base Year Market Size (2025) | USD 336.86 Billion |
| Market Size (2026) | USD 357.51 Billion |
| Market Size (2031) | USD 481.37 Billion |
| Growth Rate (2026 - 2031) | 6.13% CAGR |
| Market Concentration | Medium |
Major Players*Disclaimer: Major Players sorted in no particular order Image © Mordor Intelligence. Reuse requires attribution under CC BY 4.0. | |
Asia-Pacific Commercial Vehicles Market Analysis by Mordor Intelligence
The Asia-Pacific commercial vehicles market size is expected to grow from USD 336.86 billion in 2025 to USD 357.51 billion in 2026 and is forecast to reach USD 481.37 billion by 2031 at a 6.13% CAGR over 2026–2031. Strong e-commerce activity, synchronized infrastructure corridors, and tightening urban emission mandates are reshaping fleet renewal decisions across the region. Light commercial vans are gaining favor among last-mile operators that value enclosed payload flexibility, while internal-combustion models still dominate long-haul freight but face pressure from battery-electric and fuel-cell alternatives. China holds scale advantages through vertically integrated supply chains, yet India is registering faster growth on the back of industrial incentives and new expressway links. Competitive strategies now revolve around vertical battery integration, fleet-as-a-service contracts, and cross-OEM technology partnerships.
Key Report Takeaways
- By vehicle type, light commercial pick-up trucks led with a 34.26% Asia-Pacific commercial vehicles market share in 2025, while light commercial vans are forecast to advance at a 6.15% CAGR through 2031.
- By propulsion type, internal-combustion engines accounted for 61.73% of the Asia-Pacific commercial vehicles market size in 2025; electric models are growing at a 6.22% CAGR to 2031.
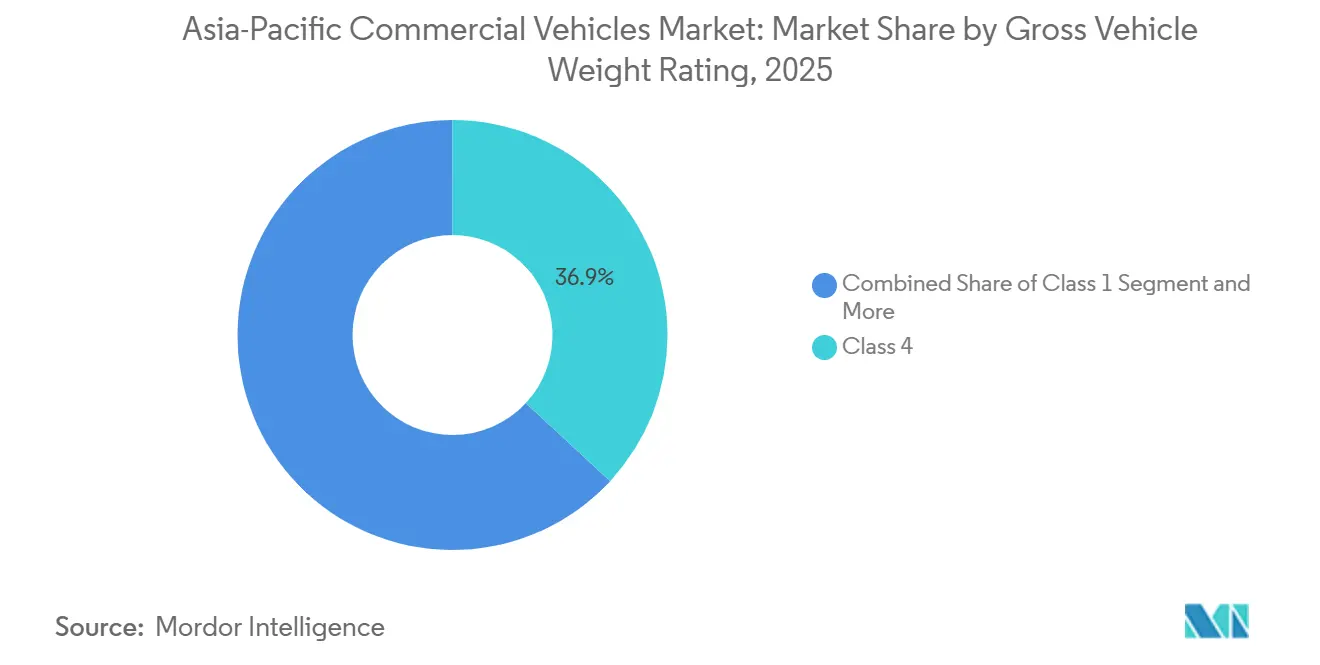
- By gross vehicle weight, Class 4 trucks captured 36.87% of volume in 2025, whereas Class 1 platforms are set to expand at a 6.25% CAGR.
- By end-use industry, logistics and e-commerce represented 44.46% of demand in 2025 and will rise at a 6.17% CAGR through 2031.
- By country, China commanded 38.74% of regional volume in 2025; India is projected to expand at a 6.19% CAGR to 2031.
Note: Market size and forecast figures in this report are generated using Mordor Intelligence’s proprietary estimation framework, updated with the latest available data and insights as of January 2026.
Asia-Pacific Commercial Vehicles Market Trends and Insights
Drivers Impact Analysis*
| Driver | (~) % Impact on CAGR Forecast | Geographic Relevance | Impact Timeline |
|---|---|---|---|
| E-commerce boom driving LMD van and pickup demand | +1.5% | Global, with concentration in China, India, Southeast Asia urban clusters | Short term (≤ 2 years) |
| Stricter CO₂ & NOx regulations accelerating fleet renewal | +1.2% | China, Japan, South Korea, with spillover to ASEAN-6 | Medium term (2-4 years) |
| Infrastructure stimulus expanding haulage routes | +0.9% | India, Indonesia, Thailand, Vietnam | Long term (≥ 4 years) |
| OEM-led battery-swap ecosystems lowering TCO | +0.8% | China, India, Singapore | Medium term (2-4 years) |
| Digital freight-matching platforms raising asset utilization | +0.7% | India, China, Indonesia | Medium term (2-4 years) |
| Hydrogen corridor pilots for long-haul HDTs | +0.4% | Japan, South Korea, Australia | Long term (≥ 4 years) |
| Source: Mordor Intelligence | |||


E-Commerce Boom Driving LMD Van & Pickup Demand
In 2025, online retail penetration in Southeast Asia reached a significant portion of total sales, driving a notable increase in orders for additional light commercial vehicles with each percentage-point rise in e-commerce share. China, in 2025, handled an immense volume of express parcels, supported by a substantial fleet of vans and pickups. Meanwhile, India's quick-commerce hubs significantly expanded their fleets during the same year.
Stricter CO₂ & NOx Regulations Accelerating Fleet Renewal
National VI-b limits in China, Bharat Stage VI upgrades in India, and expanded low-emission zones in South Korea are compelling operators to retire pre-2015 diesel trucks sooner and invest in compliant models that secure access to high-revenue urban corridors.[1]“Implementation Rules for National VI-b Standards,” Ministry of Industry and Information Technology, miit.gov.cn Retrofit costs, which range fairly per vehicle, and weight-based tax penalties in Japan have tilted calculations toward leasing newer assets [2]“Weight-Based Tax Revisions 2024,” Ministry of Land, Infrastructure, Transport and Tourism, mlit.go.jp . Thailand has set a Euro III phase-out deadline of 2028, prompting a wave of advance replacements.
Infrastructure Stimulus Expanding Haulage Routes
India’s PM-Gatishakti program delivered a significant network of expressways over a short period, reducing average freight times considerably and driving increased demand for heavy-duty trucks. Similarly, Indonesia’s expansion of its Trans-Sumatra tolls and Thailand’s upgrades to the Eastern Economic Corridor have effectively shortened transit times, favoring the use of higher-speed vehicle classes.
OEM-Led Battery-Swap Ecosystems Lowering TCO for Urban Buses
CATL's EVOGO and Sun Mobility's stations have revolutionized bus operations, significantly reducing downtime. Due to their standardized pack interfaces, these stations facilitate quick battery swaps, boosting efficiency and minimizing disruptions. By moving away from conventional charging methods, fleet operators can enjoy heightened utilization rates and greater operational flexibility. Moreover, this groundbreaking approach could substantially lower the total cost of ownership over the long term, presenting a financially savvy choice for fleet operators and bolstering the shift towards sustainable transportation.
Restraints Impact Analysis*
| Restraint | (~) % Impact on CAGR Forecast | Geographic Relevance | Impact Timeline |
|---|---|---|---|
| High upfront cost of electric CVs | -0.9% | Global, with acute impact in India, Indonesia, Southeast Asia | Short term (≤ 2 years) |
| Semiconductor & component supply bottlenecks | -0.6% | Global, with concentration in Japan, South Korea manufacturing hubs | Short term (≤ 2 years) |
| Urban LEZ drayage restrictions disrupting diesel fleets | -0.5% | China, Japan, South Korea, Singapore, with expansion to Bangkok, Jakarta, Manila | Medium term (2-4 years) |
| Limited LFP-grade lithium supply in Indonesia delaying localization | -0.3% | Indonesia, with spillover to Malaysia, Thailand battery manufacturing plans | Medium term (2-4 years) |
| Source: Mordor Intelligence | |||
High Upfront Cost of Electric CVs
In 2025, electric commercial vehicles are significantly more expensive than their diesel counterparts. This price gap presents a formidable challenge, particularly in emerging ASEAN markets where access to low-interest green financing is limited. The steep upfront costs of electric vehicles hinder their adoption, especially among the small and medium-sized enterprises (SMEs) that predominantly populate these markets. While India's FAME-II initiative extends its support to electric buses, it neglects the light commercial segment. Consequently, urban delivery operators are increasingly turning to battery-as-a-service leases, finding them to be a more flexible and economical choice compared to outright vehicle ownership.
Semiconductor & Component Supply Bottlenecks
Due to a shortage of automotive chips, several automakers are facing delays in launching new models and implementing advanced driver-assistance features. This scarcity has disrupted the automotive supply chain, impacting production schedules and technological advancements across the industry. Both Isuzu and Hino have announced production cuts for 2025, attributing the decision to a constrained supply of inverters and battery controllers sourced from foundries in Taiwan and South Korea. These supply chain challenges highlight the ongoing dependency on semiconductor manufacturing hubs in Asia.
*Our forecasts treat driver/restraint impacts as directional, not additive. The impact forecasts reflect baseline growth, mix effects, and variable interactions.
Segment Analysis
By Vehicle Type: E-Commerce Reshapes Light-Duty Mix
Light commercial pick-ups held 34.26% of % Asia-Pacific commercial vehicles market share in 2025 as multipurpose workhorses across rural zones. The sub-segment’s utility in construction and agriculture keeps demand steady, though growth trails enclosed vans. Light commercial vans are set to outpace, climbing at a 6.15% CAGR through 2031 on last-mile delivery momentum. In the Asia-Pacific commercial vehicles market, buses are transitioning to battery-electric models, as highlighted by the significant deployment of new electric city buses in China in the mid-term. While heavy-duty trucks dominate long-haul corridors, their electrification is hindered by battery weight challenges. In contrast, medium-duty trucks are opting for range-extended hybrids tailored for regional routes.
In recent years, Toyota, Hino, and Mitsubishi Fuso unified their R&D efforts under the banner of Commercial Japan Partnership Technologies Corporation, aiming to accelerate fuel-cell product development. Recently, BYD capitalized on its vertically integrated batteries to reduce ownership costs, securing logistics tenders across Southeast Asia. Tata Motors achieved a milestone by selling a substantial number of Ace EV units, capturing a notable share of India's urban last-mile segment, underscoring the swift acceptance of sub-1.8-tonne electric vehicles.


By Propulsion Type: Electric Gains Despite ICE Dominance
Internal-combustion engines retained 61.73% share in 2025 across the Asia-Pacific commercial vehicles market, anchored by diesel’s long-haul performance. Electric propulsion, nevertheless, is rising at a 6.22% CAGR as pack costs dip below USD 100 per kilowatt-hour and battery-swap networks remove range concerns. In 2025, battery-electric vehicles dominated the electric commercial vehicle market, representing the vast majority of sales, primarily targeting urban vans and transit buses. Meanwhile, fuel-cell trucks, spearheaded by Japan and South Korea, advanced to the stage of commercial pilots. For fleets wary of fully embracing electrification, hybrid and plug-in hybrid variants present a viable refurbishment option.
In the internal combustion engine (ICE) landscape, diesel continues to hold a significant share. In contrast, compressed natural gas (CNG) maintains a notable presence in India and Pakistan, buoyed by favorable fuel economics. The remaining market share is divided between gasoline and LPG, predominantly in lighter pickups and vans, where emission regulations are more lenient.
By Gross Vehicle Weight Rating: Class 4 Leads, Class 1 Accelerates
Class 4 vehicles captured 36.87% of the Asia-Pacific commercial vehicles market size in 2025, bridging port-to-warehouse logistics. Class 1 platforms are projected to grow at a 6.25% CAGR as micro-fulfillment hubs multiply in dense cities.
Tata's Ace EV proves that Class 1 electric vehicles can achieve total-cost parity with high utilization. In the near future, BYD plans to export its medium-range Class 4 electric vehicles to Thailand and Indonesia, highlighting the growing acceptance in regional distribution.
By End-Use Industry: Logistics Dominates, Construction Lags
Logistics and e-commerce users commanded 44.46% of demand in 2025 and also registered a robust CAGR of 6.17% till 2031, mirroring digital retail dynamics. Project financing gaps have slowed equipment refresh cycles, causing construction and mining to trail behind other sectors.
Public transport agencies are increasingly transitioning to zero-emission fleets in response to urban mandates. Utilities and municipal services, influenced by noise and emission restrictions in residential areas, contribute a smaller share to the market.
Geography Analysis
China's domestic lithium mining, cell production, and final assembly synergies provide significant cost advantages over global competitors. Since the implementation of National VI-b emission rules, China, which held 38.74% of regional volume in 2025, has seen faster diesel fleet replacement, supporting a substantial increase in the registration of new electric buses. In India, the PM-Gati Shakti expressways have notably reduced freight times, driving a surge in demand for heavy-duty trucks, which is expected to grow at a robust CAGR of 6.19% until 2031. Meanwhile, Tata's success with its Ace EV highlights the growing viability of compact electric vehicles in densely populated metropolitan areas [3]“Ace EV Milestone Release,” Tata Motors, tatamotors.com .
Japan and South Korea are leading hydrogen initiatives, covering a significant portion of the additional costs for fuel-cell trucks and establishing refueling infrastructure. Upgrades to Thailand's Eastern Economic Corridor have resulted in a notable rise in truck registrations in key regions. Indonesia's Trans-Sumatra toll road has considerably shortened long-haul trips, boosting demand for medium-duty trucks. In Australia, the Clean Energy Finance Corporation is supporting hydrogen stations to facilitate the adoption of fuel-cell trucks in the coming years.
Vietnam's newly added lanes on the North-South Expressway have significantly reduced freight times between Hanoi and Ho Chi Minh City, encouraging a shift from coastal shipping to road transport for cargo. Meanwhile, the Philippines, Bangladesh, and Pakistan continue to rely on imported used diesel trucks, with Pakistan favoring CNG trucks due to government fuel subsidies.
Competitive Landscape
In the Asia-Pacific commercial vehicles market, the landscape is moderately fragmented, with the top OEMs commanding a significant share of the market volume. Key strategies to maintain market share include vertical battery integration, collaborative R&D consortia, and offering fleet-as-a-service bundles. Toyota, Hino, and Mitsubishi Fuso have collaborated on technology budgets, aiming to achieve substantial reductions in per-unit development costs over the coming years.
BYD leveraged its internal battery supply to clinch logistics contracts in Thailand, Indonesia, and Malaysia, achieving cost metrics that undercut traditional diesel competitors. Hyundai has patented advancements in fuel-cell durability, while Isuzu and Volvo have teamed up to develop electric medium-duty platforms tailored for Japan and Australia.
Innovations like digital twins, over-the-air updates, and adherence to ISO 26262 safety standards are becoming key differentiators in the market. Foton and Ashok Leyland are utilizing software solutions to minimize maintenance downtimes. Meanwhile, regional players like DRB-HICOM and Esemka are combining cost-effective assembly methods with partnerships from Chinese battery suppliers to cater to budget-conscious fleets.
Asia-Pacific Commercial Vehicles Industry Leaders
Anhui Ankai Automobile Co. Ltd.
Dongfeng Motor Corporation
Isuzu Motors Limited
Toyota Motor Corporation
Wuling Motors Holdings Limited
- *Disclaimer: Major Players sorted in no particular order

Recent Industry Developments
- June 2025: Toyota, Hino, and Daimler Truck began integration of Mitsubishi Fuso and Hino under a single holding company, positioning for a Tokyo listing to finance hydrogen and autonomous research.
- June 2025: Tata Motors introduced the Tata Ace Pro EV and Intra EV, each equipped with advanced telematics and greater payload for urban logistics.


Asia-Pacific Commercial Vehicles Market Report Scope
The scope of the report includes Vehicle Type (Buses, Heavy/Medium/Light-Duty Trucks, Pickups, and Vans), Propulsion (Electric and ICE), Weight Rating (Class 1 and More), End-Use (Logistics, Construction, Public Transport, Utilities, and Others), and Geography (Australia, China, India, Indonesia, Japan, Malaysia, South Korea, Thailand, and Rest of Asia-Pacific).
By Vehicle Type
| Buses |
| Heavy-Duty Commercial Trucks |
| Medium-Duty Commercial Trucks |
| Light Commercial Pick-up Trucks |
| Light Commercial Vans |
By Propulsion Type
| Electric | Battery Electric |
| Fuel-cell Electric | |
| Hybrid Electric | |
| Plug-in Hybrid Electric | |
| Internal Combustion Engine (ICE) | Diesel |
| CNG | |
| Gasoline | |
| LPG |
By Gross Vehicle Weight Rating (Tonnage Class)
| Class 1 (<1.8 t) |
| Class 2 (1.8 – 3.5 t) |
| Class 3 (3.5 – 7.5 t) |
| Class 4 (7.5 – 16 t) |
| Class 5 (>16 t) |
By End-Use Industry
| Logistics & E-commerce |
| Construction & Mining |
| Public Transport |
| Utilities & Municipal Services |
| Others (Agriculture, Retail) |
By Country
| Australia |
| China |
| India |
| Indonesia |
| Japan |
| Malaysia |
| South Korea |
| Thailand |
| Rest of Asia Pacific |
| By Vehicle Type | Buses | |
| Heavy-Duty Commercial Trucks | ||
| Medium-Duty Commercial Trucks | ||
| Light Commercial Pick-up Trucks | ||
| Light Commercial Vans | ||
| By Propulsion Type | Electric | Battery Electric |
| Fuel-cell Electric | ||
| Hybrid Electric | ||
| Plug-in Hybrid Electric | ||
| Internal Combustion Engine (ICE) | Diesel | |
| CNG | ||
| Gasoline | ||
| LPG | ||
| By Gross Vehicle Weight Rating (Tonnage Class) | Class 1 (<1.8 t) | |
| Class 2 (1.8 – 3.5 t) | ||
| Class 3 (3.5 – 7.5 t) | ||
| Class 4 (7.5 – 16 t) | ||
| Class 5 (>16 t) | ||
| By End-Use Industry | Logistics & E-commerce | |
| Construction & Mining | ||
| Public Transport | ||
| Utilities & Municipal Services | ||
| Others (Agriculture, Retail) | ||
| By Country | Australia | |
| China | ||
| India | ||
| Indonesia | ||
| Japan | ||
| Malaysia | ||
| South Korea | ||
| Thailand | ||
| Rest of Asia Pacific | ||


Market Definition
- Vehicle Type - The category covers light, medium, and heavy duty commercial vehicle.
- Vehicle Body Type - This includes Light Commercial Pick-up Trucks, Light Commercial Vans, Medium-duty Commercial Trucks, Heavy-duty Commercial Trucks, and Medium and Heavy Duty Buses.
- Fuel Category - The category includes various fuel types such as Gasoline, Diesel, LPG (Liquefied Petroleum Gas), CNG (Compressed Natural Gas), HEV (Hybrid Electric Vehicles), PHEV (Plug-in Hybrid Electric Vehicles), BEV (Battery Electric Vehicles), and FCEV (Fuel Cell Electric Vehicles)
| Keyword | Definition |
|---|---|
| Electric Vehicle (EV) | A vehicle which uses one or more electric motors for propulsion. Includes cars, buses, and trucks. This term includes all-electric vehicles or battery electric vehicles and plug-in hybrid electric vehicles. |
| BEV | A BEV relies completely on a battery and a motor for propulsion. The battery in the vehicle must be charged by plugging it into an outlet or public charging station. BEVs do not have an ICE and hence are pollution-free. They have a low cost of operation and reduced engine noise as compared to conventional fuel engines. However, they have a shorter range and higher prices than their equivalent gasoline models. |
| PEV | A plug-in electric vehicle is an electric vehicle that can be externally charged and generally includes all-electric vehicles as well as plug-in hybrids. |
| Plug-in Hybrid EV | A vehicle that can be powered either by an ICE or an electric motor. In contrast to normal hybrid EVs, they can be charged externally. |
| Internal combustion engine | An engine in which the burning of fuels occurs in a confined space called a combustion chamber. Usually run with gasoline/petrol or diesel. |
| Hybrid EV | A vehicle powered by an ICE in combination with one or more electric motors that use energy stored in batteries. These are continually recharged with power from the ICE and regenerative braking. |
| Commercial Vehicles | Commercial vehicles are motorized road vehicles designed for transporting people or goods. The category includes light commercial vehicles (LCVs) and medium and heavy-duty vehicles (M&HCV). |
| Passenger Vehicles | Passenger cars are electric motor– or engine-driven vehicles with at least four wheels. These vehicles are used for the transport of passengers and comprise no more than eight seats in addition to the driver’s seat. |
| Light Commercial Vehicles | Commercial vehicles that weigh less than 6,000 lb (Class 1) and in the range of 6,001–10,000 lb (Class 2) are covered under this category. |
| M&HDT | Commercial vehicles that weigh in the range of 10,001–14,000 lb (Class 3), 14,001–16,000 lb (Class 4), 16,001–19,500 lb (Class 5), 19,501–26,000 lb (Class 6), 26,001–33,000 lb (Class 7) and above 33,001 lb (Class 8) are covered under this category. |
| Bus | A mode of transportation that typically refers to a large vehicle designed to carry passengers over long distances. This includes transit bus, school bus, shuttle bus, and trolleybuses. |
| Diesel | It includes vehicles that use diesel as their primary fuel. A diesel engine vehicle have a compression-ignited injection system rather than the spark-ignited system used by most gasoline vehicles. In such vehicles, fuel is injected into the combustion chamber and ignited by the high temperature achieved when gas is greatly compressed. |
| Gasoline | It includes vehicles that use gas/petrol as their primary fuel. A gasoline car typically uses a spark-ignited internal combustion engine. In such vehicles, fuel is injected into either the intake manifold or the combustion chamber, where it is combined with air, and the air/fuel mixture is ignited by the spark from a spark plug. |
| LPG | It includes vehicles that use LPG as their primary fuel. Both dedicated and bi-fuel LPG vehicles are considered under the scope of the study. |
| CNG | It includes vehicles that use CNG as their primary fuel. These are vehicles that operate like gasoline-powered vehicles with spark-ignited internal combustion engines. |
| HEV | All the electric vehicles that use batteries and an internal combustion engine (ICE) as their primary source for propulsion are considered under this category. HEVs generally use a diesel-electric powertrain and are also known as hybrid diesel-electric vehicles. An HEV converts the vehicle momentum (kinetic energy) into electricity that recharges the battery when the vehicle slows down or stops. The battery of HEV cannot be charged using plug-in devices. |
| PHEV | PHEVs are powered by a battery as well as an ICE. The battery can be charged through either regenerative breaking using the ICE or by plugging into some external charging source. PHEVs have a better range than BEVs but are comparatively less eco-friendly. |
| Hatchback | These are compact-sized cars with a hatch-type door provided at the rear end. |
| Sedan | These are usually two- or four-door passenger cars, with a separate area provided at the rear end for luggage. |
| SUV | Popularly known as SUVs, these cars come with four-wheel drive, and usually have high ground clearance. These cars can also be used as off-road vehicles. |
| MPV | These are multi-purpose vehicles (also called minivans) designed to carry a larger number of passengers. They carry between five and seven people and have room for luggage too. They are usually taller than the average family saloon car, to provide greater headroom and ease of access, and they are usually front-wheel drive. |


Research Methodology
Mordor Intelligence follows a four-step methodology in all its reports.
- Step-1: Identify Key Variables: To build a robust forecasting methodology, the variables and factors identified in Step-1 are tested against available historical market numbers. Through an iterative process, the variables required for market forecast are set and the model is built based on these variables.
- Step-2: Build a Market Model: Market-size estimations for the historical and forecast years have been provided in revenue and volume terms. Market revenue is calculated by multiplying the sales volume with their respective average selling price (ASP). While estimating ASP factors like average inflation, market demand shift, manufacturing cost, technological advancement, and varying consumer preference, among others have been taken into account.
- Step-3: Validate and Finalize: In this important step, all market numbers, variables, and analyst calls are validated through an extensive network of primary research experts from the market studied. The respondents are selected across levels and functions to generate a holistic picture of the market studied.
- Step-4: Research Outputs: Syndicated Reports, Custom Consulting Assignments, Databases & Subscription Platforms.


