
Market Overview
| Study Period | 2021 - 2031 |
|---|---|
| Forecast Data Period | 2026 - 2031 |
| Base Year Market Size (2025) | USD 61.67 Billion |
| Market Size (2026) | USD 65.14 Billion |
| Market Size (2031) | USD 85.64 Billion |
| Growth Rate (2026 - 2031) | 5.62 % |
| Market Concentration | Medium |
Major Players *Disclaimer: Major Players sorted in no particular order Image © Mordor Intelligence. Reuse requires attribution under CC BY 4.0. | |
Asia-Pacific Agricultural Machinery Market Analysis by Mordor Intelligence
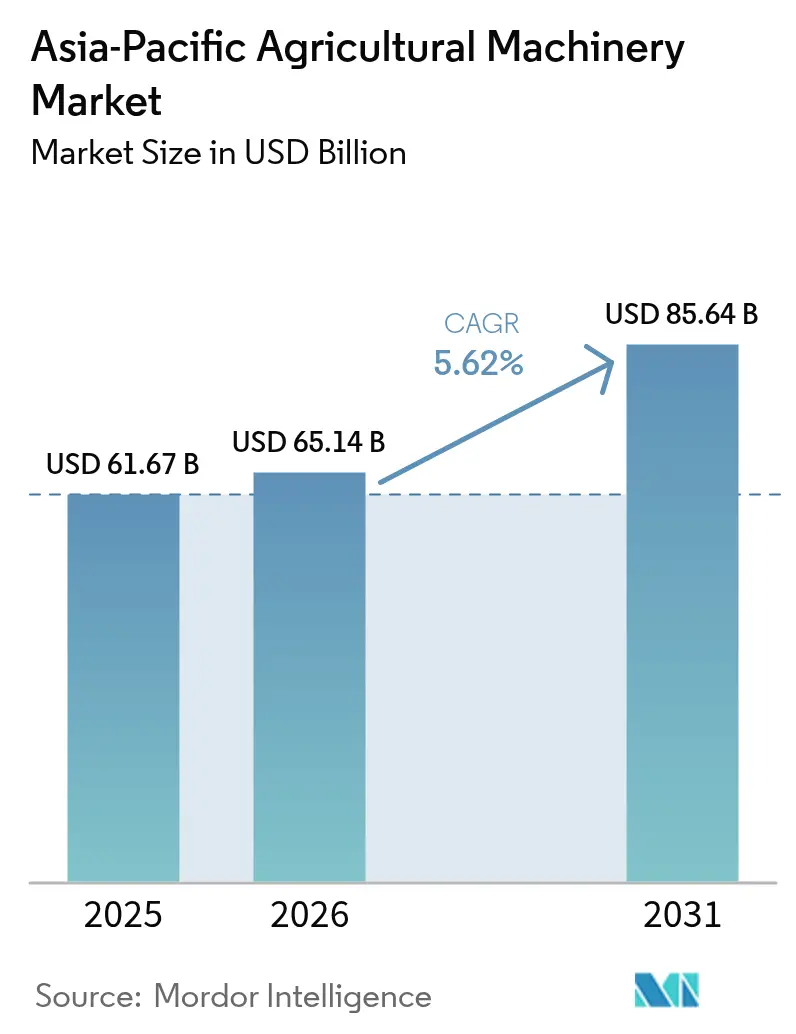
The Asia-Pacific agricultural machinery market size is expected to grow from USD 61.67 billion in 2025 to USD 65.14 billion in 2026 and is forecast to reach USD 85.64 billion by 2031 at 5.62% CAGR over 2026-2031. The mechanization imperative extends beyond developed markets, with Thailand's agricultural sector embracing precision farming as the only viable path forward amid workforce aging and climate variability challenges. Rapid mechanization continues as shrinking rural labor pools push growers toward tractors, harvesters, and smart implements. Government capital-subsidy programs and rising farm incomes sustain equipment purchases by smallholders, while climate-linked incentives accelerate drip irrigation and precision farming adoption. Original Equipment Manufacturers (OEMs) now bundle hardware with software and subscription services to smooth large up-front costs. Competitive intensity is rising as Korean and Chinese manufacturers expand abroad and incumbents race to embed autonomy and data analytics in product lines[1]Source: Asian Development Bank, “Sustaining Agricultural Production through Water-Saving Irrigation,” adb.org.
Key Report Takeaways
- By product type, tractors captured 57.15% of the Asia-Pacific agricultural machinery market share in 2025. Drip irrigation machinery is projected to expand at a 13.02% CAGR through 2031.
- By geography, China led with a 35.12% share of the Asia-Pacific agricultural machinery market size in 2025. India is advancing at an 8.4% CAGR through 2031.
Note: Market size and forecast figures in this report are generated using Mordor Intelligence’s proprietary estimation framework, updated with the latest available data and insights as of 2026.
Asia-Pacific Agricultural Machinery Market Trends and Insights
Drivers Impact Analysis*
| Driver | (~) % Impact on CAGR Forecast | Geographic Relevance | Impact Timeline |
|---|---|---|---|
| Farm-Labor Scarcity Accelerating Mechanization | +1.8% | Global, with acute impact in Japan, Thailand, and Malaysia | Short term (≤ 2 years) |
| Precision-Farming Adoption and Smart Implements | +1.2% | China, Thailand, and Taiwan, with spillover to India | Medium term (2-4 years) |
| Climate-Linked Yield-Assurance Incentives | +0.9% | Asia-Pacific core, with emphasis on drought-prone regions | Long term (≥ 4 years) |
| Government Credit Lines Targeting Smallholders | +1.1% | India, China, and Philippines, with policy support in Thailand | Medium term (2-4 years) |
| OEM "Power-as-a-Service" Subscription Models | +0.4% | Developed Asia-Pacific markets, expanding to emerging economies | Long term (≥ 4 years) |
| Ag-Carbon Credit Monetization Potential | +0.3% | Philippines and Thailand, with regulatory frameworks emerging | Long term (≥ 4 years) |
| Source: Mordor Intelligence | |||
Farm-labor scarcity accelerating mechanization
Severe worker shortages lift demand for hands-free machinery. Japan’s agriculture ministry earmarked JPY 1 billion (USD 7.5 million) for automation grants, leading vegetable growers to deploy autonomous harvesters that slash labor inputs by 50%[2]Source: Ministry of Agriculture Japan, “Automation Support Grants for Farmers,” nationthailand.com. Malaysian palm estates now rely on self-driving trucks and drone sprayers to offset curtailed migrant inflows. Thai rice operations adopt high-speed transplanters, lifting daily planting capacity fivefold. Together, these responses accelerate equipment turnover across the Asia-Pacific agricultural machinery market.
Precision-farming adoption and smart implements
IoT platforms, variable-rate controllers, and UAVs are penetrating field operations. Kubota’s Thai farm-management application logged 100 pilot plots, boosting yields up to 30% by matching soil tests to fertilizer maps[3]Source: Kubota Corporation, “The Demonstration Farm KUBOTA FARM Proposes a New Future for Agriculture,” kubota.com. Taiwan’s 25-year precision-agriculture program now integrates GIS, multispectral drones, and cloud analytics to refine irrigation scheduling[4]Source: FFTC, “Precision Agriculture in Taiwan: Examples and Experiences,” ap.fftc.org.tw. Beijing’s USD 1.4 trillion digital-infrastructure pledge, alongside a USD 320 million World Bank loan for climate-smart practices, underwrites future smart-implement uptake. These initiatives widen the addressable base for data-driven devices within the Asia-Pacific agricultural machinery market.
Climate-linked yield-assurance incentives
Governments tie mechanization to resilience goals. Thailand’s Bio-Circular-Green roadmap positions efficient equipment as central to mitigating drought losses. Water-saving drip systems inspired by fig-leaf geometry cut usage 70-80% while sustaining yields, demonstrating clear ROI under a scarce-water scenario. Australia still anticipates its mechanization sector to grow despite a significant farm-profit dip in 2023 drought conditions. Such incentives intensify demand for high-efficiency machines across the Asia-Pacific agricultural machinery market.
Ag-carbon credit monetization potential
Low-emission equipment positions growers to earn carbon offsets. Early frameworks in Thailand and the Philippines recognize avoided methane and nitrous-oxide emissions from precision application and reduced-tillage gear, creating a financial pull for advanced machinery within the Asia-Pacific agricultural machinery market. The adoption of low-emission equipment and precision farming technologies, supported by carbon offset frameworks in countries like Thailand and the Philippines, is anticipated to further accelerate market expansion in the coming years.
Restraints Impact Analysis*
| Restraint | (~) % Impact on CAGR Forecast | Geographic Relevance | Impact Timeline |
|---|---|---|---|
| High Up-Front Capital Costs | -1.3% | Global, with acute impact on smallholder segments | Short term (≤ 2 years) |
| Fragmented Land Holdings Limiting ROI | -0.8% | India, China, and Southeast Asia rural areas | Medium term (2-4 years) |
| Poor After-Sales Service Networks | -0.6% | Emerging Asia-Pacific markets, rural distribution gaps | Medium term (2-4 years) |
| Low Digital Literacy Among Farmers | -0.4% | Rural areas across developing Asia-Pacific economies | Long term (≥ 4 years) |
| Source: Mordor Intelligence | |||
Low digital literacy among farmers
Adoption of data-rich platforms lags where smartphone penetration and connectivity remain spotty. Training programs embedded in Thailand’s 4.0 initiative and China’s rural broadband rollout are narrowing the gap, yet consistent user-skill building is still required to unlock full value from precision equipment. The integration of precision farming technologies and sustainable practices positions the market for substantial growth, though infrastructure and training challenges need to be addressed for widespread adoption.
Fragmented land holdings limiting ROI
The small average farm size of less than 2 hectares in South and Southeast Asia limits the effective use of high-capacity agricultural equipment. This structural constraint slows the adoption of high-horsepower tractors and restricts overall mechanization levels. Governments promote multi-farm cooperatives and machinery sharing programs to consolidate farmland and improve investment returns. The fragmented nature of landholdings also impacts operational efficiency, making it difficult for farmers to achieve economies of scale. Additionally, the limited access to capital and financing options further compounds the challenges of mechanization adoption in these regions. To address these issues, agricultural policies increasingly focus on land consolidation initiatives and financial support mechanisms for farm equipment purchases.
*Our forecasts treat driver/restraint impacts as directional, not additive. The impact forecasts reflect baseline growth, mix effects, and variable interactions.
Segment Analysis
By Product Type: Tractors remain the mechanization cornerstone
Tractors represented 57.15% of the Asia-Pacific agricultural machinery market share in 2025 as growers rely on them for land preparation, transport, and power take-off tasks. The tractor market is projected to widen steadily through 2031 as below-40 HP models dominate Indian sales and above-50 HP units gain traction in Australian broad-acre farms. Utility tractors stand out for versatility, whereas row-crop variants support GPS steering and variable-rate seeding for precision agriculture. Daedong’s plan to introduce Korea’s first level-4 autonomous tractor by end-2025 signals a competitive leap that could reshape buyer expectations. Complementary plowing and cultivating implements form the second-largest category, as rice systems demand efficient puddling and seedbed preparation.
Demand for harvesting machinery follows labor-cost escalation. Combine harvesters cut rice reaping time from seven to two days, a gain valued in Thailand, where daily wages jumped 15% in 2024. Drip irrigation equipment, while currently smaller in revenue, is the fastest-growing sub-segment at 13.02% CAGR, reflecting intensified water-management mandates and incentive schemes. The attached to micro-irrigation could triple as drought episodes spur adoption across China’s northern plains and India’s Deccan plateau. OEMs offering bundled pumps, fertigation controllers, and cloud analytics stand to capture emerging cross-sell opportunities.




Geography Analysis
China accounted for 35.12% of the Asia-Pacific agricultural machinery market in 2025, yet tractor sales dropped sharply following tighter emission regulations. Expanded subsidies covering drones and smart terminals, plus a USD 1.4 trillion digital-agriculture stimulus package, underpin a recovery path that favors high-tech equipment. China is expected to resume mid-single-digit growth from 2026 onward as aging fleets are retired. India is the fastest-expanding geography at 8.4% CAGR, buoyed by rising rural incomes and Farm Machinery Banks offering shared access to seeders and harvesters.
Japan and Australia demonstrate established mechanization landscapes within the region. Tokyo's automation grant initiatives drive the adoption of robotic harvesters to address workforce aging challenges. Australia's agricultural machinery industry shows signs of recovery as farmers resume previously delayed equipment upgrades.
Thailand and other emerging Southeast Asian economies add significant depth to the Rest-of-Asia-Pacific segment. Thailand's machinery market continues to grow steadily, supported by Kubota's capacity expansion initiatives. Indonesia's increased tractor imports from TYM to service new rice-estate projects further demonstrate the broadening regional footprint of the Asia-Pacific agricultural machinery market.
Regulatory Landscape
Regulation across Asia-Pacific continues to tighten around emissions, safety testing, and cross-border conformity, shaping both product design and market access. In India, the Central Motor Vehicles (Eleventh Amendment) Rules, 2026 mandate TREM Stage-V emission standards for agricultural tractors and combine harvesters in the 56 kW to 560 kW range effective October 1, 2026, pushing OEMs and engine suppliers toward faster upgrades and re-certification cycles. India also sustains a multi-layer compliance structure covering CMVR type approval, performance testing used for subsidy eligibility, and BIS conformity under compulsory Quality Control Orders, which adds procedural load for new model introductions and imports.
Trade and standards alignment is moving in parallel, but enforcement remains country-led. In May 2026, the RCEP Secretariat launched a mutual recognition framework for green energy efficiency and safety aspects of agricultural equipment across member economies, while ASEAN markets continue to apply pre-shipment certification and local testing requirements for higher-horsepower and specialized machinery. At the same time, origin and tariff treatment can change quickly, highlighted by China Customs suspending RCEP-based zero-tariff treatment for certain agricultural machinery tariff lines exported to ASEAN in July 2026 due to certificate-of-origin classification disputes, which increases compliance and documentation scrutiny for exporters.
Competitive Landscape
Competition in the Asia-Pacific agricultural machinery market is moderately concentrated. Kubota Corporation, Deere & Company, CNH Industrial N.V., Mahindra & Mahindra Ltd., and AGCO Corporation defend leadership with full-line portfolios and dealer networks, while TYM and Daedong accelerate regional penetration via cost-competitive autonomous offerings. Chinese manufacturers, led by Zoomlion, unveil hybrid tractors and digital-farm platforms targeting export growth to 60 countries.
Integrated service models distinguish market contenders. Kubota Corporation operates demonstration farms delivering agronomy training and telematics insights to boost customer ROI. CNH Industrial N.V. launched per-ton sugarcane harvesting subscriptions in Thailand, converting capital outlay into variable costs. Yanmar Co. Ltd.’s acquisition of CLAAS KGaA mbH India upgrades the combined capacity for South Asian demand. Suppliers investing in after-sales parts hubs and remote diagnostics secure higher equipment uptime, a decisive factor for repeat purchases within the Asia-Pacific agricultural machinery market.
Digital capability is the new battleground. Deere & Company’s Operations Center, Kubota Corporation’s KSAS, and AGCO Corporation’s Fuse cloud suites compete to anchor equipment sales with data services. Carbon-credit marketplaces and AI-driven crop models promise incremental revenue streams, luring ag-tech start-ups into strategic alliances with incumbent OEMs.
Asia-Pacific Agricultural Machinery Industry Leaders
Deere & Company
AGCO Corporation
Mahindra & Mahindra Ltd.
KUBOTA Corporation
CNH Industrial N.V.
- *Disclaimer: Major Players sorted in no particular order


Market Opportunities and Future Outlook
OEM manufacturing localization and component localization are creating whitespace for export-oriented platforms and higher-spec machines tuned to Asia-Pacific operating conditions. In India, CNH Industrial disclosed plans in February 2026 to invest about INR 1,800 crore over two to three years, including a new greenfield tractor plant, and Kubota announced plans in June 2026 to build a fifth Indian factory to expand export capacity beyond the domestic market. These moves position India as a supply base for tractors and adjacent implements, while expanding the addressable market for local supplier ecosystems (powertrains, hydraulics, precision-ready attachments, and after-sales parts).
The shift from hardware-only sales toward intelligent, low-carbon, and service-enabled mechanization is opening up opportunities in precision and shared-service models for smallholders and fragmented landholdings. South Korea’s Ministry of Agriculture, Food and Rural Affairs released a Next-Generation Agriculture and Bio R&D Strategic Roadmap in March 2026 centered on AI and robotics, and APEC published a July 2026 policy recommendation for AI-enabled, IoT-based pest management built around public-private partnerships and shared-service business models, both of which support demand for sensorized implements, UAVs, and interoperable farm platforms. On the supply side, XCMG and ZF agreed in June 2026 to form a joint venture in Jiangsu for advanced powershift transmissions, supporting regional availability of higher-end drivetrain technology that can feed into tractors and harvesters designed for demanding duty cycles and tighter emissions pathways.
Recent Industry Developments
- June 2026: Mahindra & Mahindra outlined a strategic pivot to broaden its focus from tractors toward full-farm mechanization equipment, including categories such as harvesters, balers, and seed drills. The change aligns product strategy with low mechanization penetration beyond tractors in key South Asian markets and increases competitive pressure in mid-priced implements and harvesting segments.
- July 2025: AGCO and TAFE reached agreements that ended their commercial partnerships and resolved ownership-related disputes affecting the Massey Ferguson brand across India, Nepal, and Bhutan. The settlement clarifies route-to-market and brand control in a large tractor geography, influencing dealer alignment, sourcing decisions, and future product rollout cadence.
- February 2025: AGCO and SDF entered a supply agreement under which SDF would produce tractors up to 85 horsepower for the Massey Ferguson brand. The arrangement adds an outsourced manufacturing pathway for the low-to-mid horsepower segment that dominates many Asia-Pacific smallholder and mixed-farming applications, affecting pricing, availability, and model refresh cycles.


Research Methodology Framework and Report Scope
Market Definition and Coverage
For this study, the market covers revenue earned from the sale of agricultural machinery used across core farm activities in Asia-Pacific, from land preparation and planting through irrigation and harvesting, including related implements when sold as part of the equipment.
Scope exclusions: It excludes purely manual farm hand tools and non-farm construction equipment, even if occasionally used on agricultural land.
Segmentation Overview
- By Product Type
- Tractors
- Horsepower
- Below 20 HP
- 21 - 30 HP
- 31 - 50 HP
- Above 50 HP
- Type
- Utility Tractor
- Row-Crop Tractor
- Compact Utility Tractor
- Other Types
- Horsepower
- Plowing and Cultivating Machinery
- Ploughs
- Harrows
- Cultivators and Tillers
- Other Ploughing and Cultivating Machinery
- Planting Machinery
- Seed Drills
- Planters
- Spreaders
- Other Planting Machinery
- Harvesting Machinery
- Combine Harvesters
- Forage Harvesters
- Other Harvesting Machinery
- Haying and Forage Machinery
- Mowers
- Balers
- Other Haying and Forage Machinery
- Irrigation Machinery
- Sprinkler Irrigation
- Drip Irrigation
- Other Irrigation Machinery
- Other Types
- Tractors
- By Geography
- China
- India
- Japan
- Australia
- Rest of Asia-Pacific
Data Sources, Market Sizing, and Validation
Desk Research
Desk work started with building a clean fact base on mechanization, crop area, and equipment demand direction across China, India, Japan, Australia, and the rest of the region. Public sources were used to anchor these fundamentals, such as FAOSTAT for crop and farm indicators, World Bank and IMF macro series, UN Comtrade for machinery trade flows, OECD-FAO outlooks for agriculture demand signals, and national agriculture ministries and statistics offices for subsidy programs and equipment support schemes.
We then layered in company annual reports, investor presentations, and credible press to understand product mix shifts and pricing pressure. To reduce gaps around smaller manufacturers and importers, our desk review was supported by paid subscriptions for company financials and news plus a shipment-level trade database, which helped check whether volume trends matched the narrative. The sources named above are illustrative only, and many other public references were also used during data collection, validation, and research clarification.
Primary Interviews and Surveys
Primary work focused on validating demand drivers and pricing patterns with people close to the purchasing and distribution cycle, such as machinery dealers, large farm operators, custom hiring service providers, and parts and service teams. Inputs were gathered across the key APAC markets so assumptions on replacement cycles, financing availability, and the split between tractors, harvesting, and irrigation equipment could be stress-tested. Where desk data was thin, these conversations were used to confirm realistic utilization rates, discounting behavior, and the timing of subsidy-led buying seasons.
Distribution of primary research fieldwork respondents
| Company type | Respondent position |
|---|---|
| Top tier: 39% | CXOs: 12% |
| Mid tier: 47% | Functional/Unit leaders: 28% |
| Smaller Players: 14% | Managers: 60% |
Market-Sizing & Forecasting
Sizing was built using a top-down demand pool approach where country-level crop activity and farm structure were translated into machinery adoption and annual replacement needs, and then converted into value using typical price bands. To keep it grounded, selective bottom-up checks were run, including sampled dealer sell-out patterns, importer and manufacturer revenue direction, and price-times-volume approximations for high-impact categories like tractors and harvesters.
The inputs that mattered most were tractor and harvester penetration by farm size, average replacement cycles, seasonal sales timing linked to planting and harvest windows, subsidy intensity and eligibility rules, and the split between domestic production and imports visible in trade codes. For forecasting, scenario analysis was used, because policy support and financing conditions can shift quickly, and each scenario was tied back to expert expectations on mechanization growth and price inflation. When bottom-up signals were missing for a smaller country, proxy ratios from similar markets were applied and then corrected through interview feedback before final totals were locked.
Data Validation & Update Cycle
Outputs were checked in several passes so the final numbers do not rely on a single data stream. We compared model results against independent signals like import growth, reported equipment sales momentum, and changes in subsidy budgets, and then flagged outliers for rework. Any large variance by country or product group triggered a second round of assumption checks and, when needed, quick re-contacts with respondents.
Before sign-off, the full workbook was reviewed by another analyst to confirm that unit logic, currency handling, and year alignment were consistent across countries. The report is refreshed annually, and interim updates are made when major policy changes, sharp price movements, or trade disruptions meaningfully alter the outlook. Right before delivery, a final sweep is done so clients receive the most current view available.
Mordor Intelligence's Asia Pacific Agricultural Machinery Market Size Versus Other Published Estimates
Published market values for APAC agricultural machinery often differ because firms do not always count the same equipment set, and they also apply different pricing and currency timing assumptions. The base year, the way subsidies are treated in demand, and how imports are netted out of domestic sales can all move the final number.
Some estimates expand scope by folding in a wider definition of farm equipment, which can include hand tools and other adjacent categories. For Mordor Intelligence, only tractors, planting and cultivation equipment, harvesting and haying machinery, and irrigation machinery sold into Asia-Pacific are counted, and totals are then checked against trade flows to reduce double counting between imports and local sales.
Benchmark comparison
| Source | Market Size | Gaps in Research Methodology |
|---|---|---|
| Mordor Intelligence | USD 61.67 B (2025) | |
| Regional Consultancy A | USD 129.80 B (2025) | Uses a broader equipment umbrella that can include adjacent tool and implement definitions and a wider activity mapping across cultivation, harvesting, and other applications, which typically lifts the total value for the same region. |
| Trade Journal B | USD 90.42 B (2025) | Blends multiple indicator views such as production, consumption, and trade under one headline, which can mix revenue-based market sizing with volume-led indicators, and that commonly changes the market value even in the same year. |
The spread in the table mainly comes from how widely each publisher defines the equipment set and how consistently sales are reconciled with trade flows and pricing timing. By keeping the calculation traceable to country demand drivers and then cross-checking with import and pricing signals, the final estimate remains easier to reproduce and explain in client discussions.


Key Questions Answered in the Report
What is the current value of the Asia-Pacific agricultural machinery market?
In 2026 the market size is valued at USD 65.14 billion and is projected to rise to USD 85.64 billion by 2031.
Which product category dominates regional machinery sales?
Tractors account for about 57.15% of industry revenue, reflecting their central role in field operations.
Which country shows the fastest growth in equipment demand?
India is expanding at a 8.4% CAGR, supported by subsidy programs and growing farm incomes.
What factor most limits farmer adoption of new machinery?
High up-front capital costs remain the chief barrier, particularly for smallholders.
How are manufacturers easing purchase hurdles?
OEMs increasingly offer subscription-based Power-as-a-Service packages that convert capital expenses into pay-per-use charges.
Page last updated on:





