
Technology, Media and Telecom
5th MayPricing Strategy for Semiconductor Components
3 Min Read
The Vehicle Analytics Market is Segmented by Deployment (Cloud and On-Premises), Component (Software Platform and Services), Application (Predictive Maintenance, Safety and Security Management, and More), End-User (OEMs, Fleet Owners and Managers, and More), Vehicle Type (Passenger Cras, Light Commercial Vehicles (LCV), and More), and Geography. The Market Forecasts are Provided in Terms of Value (USD).
Market Overview
| Study Period | 2020 - 2031 |
|---|---|
| Market Size (2026) | USD 10.07 Billion |
| Market Size (2031) | USD 45.41 Billion |
| Growth Rate (2026 - 2031) | 35.16 % CAGR |
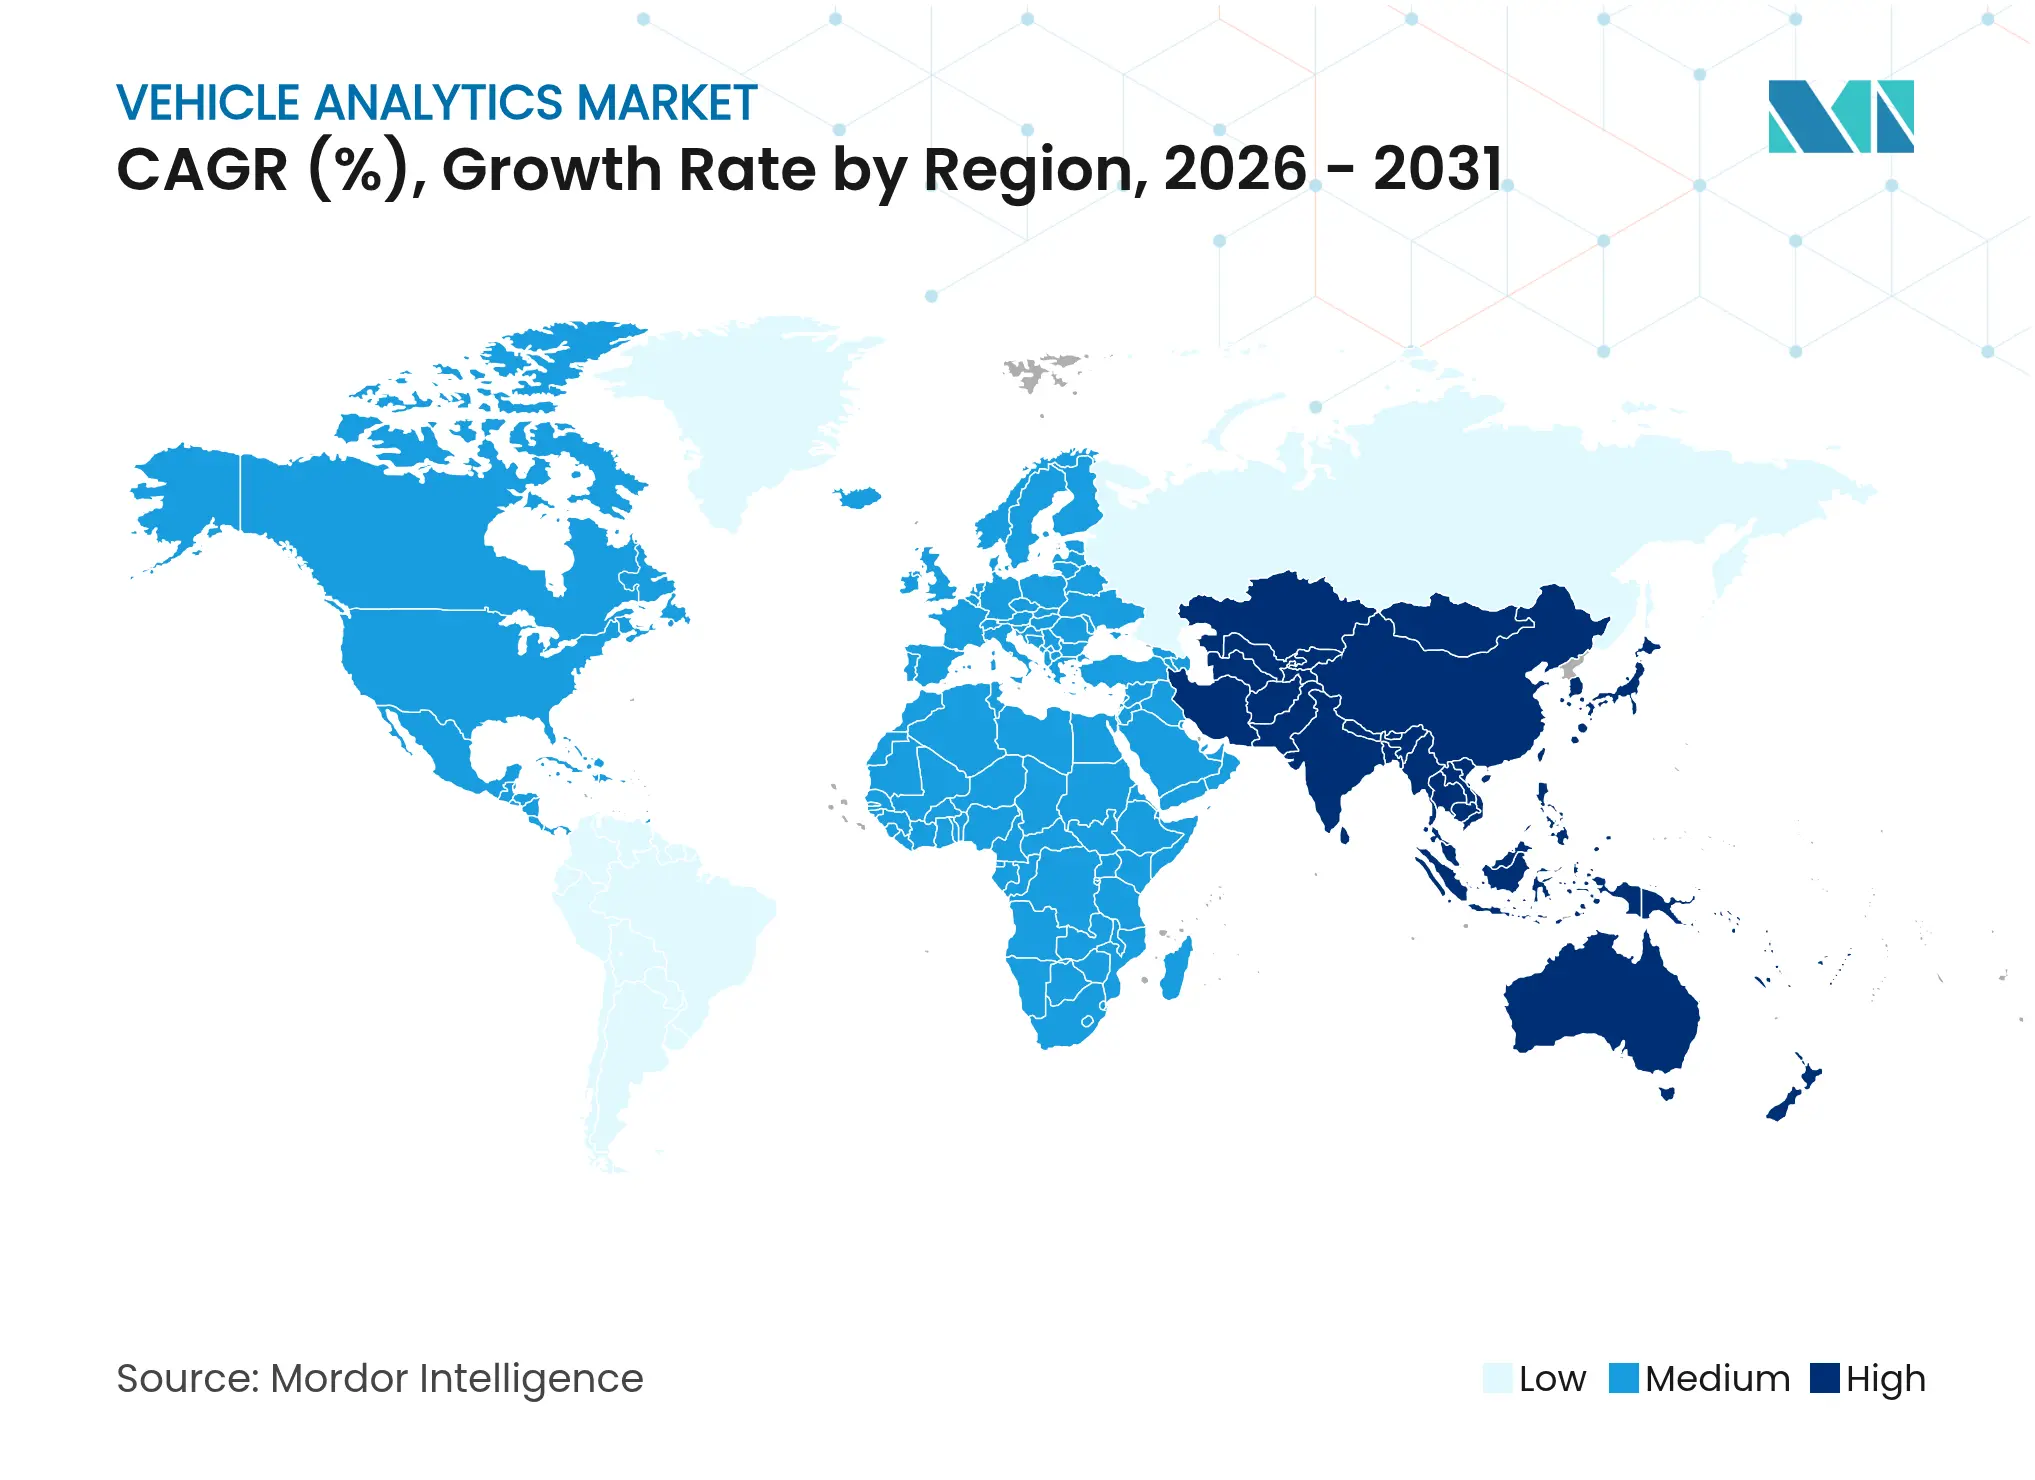
| Fastest Growing Market | Asia Pacific |
| Largest Market | North America |
| Market Concentration | Medium |
Major Players*Disclaimer: Major Players sorted in no particular order. Image © Mordor Intelligence. Reuse requires attribution under CC BY 4.0. |
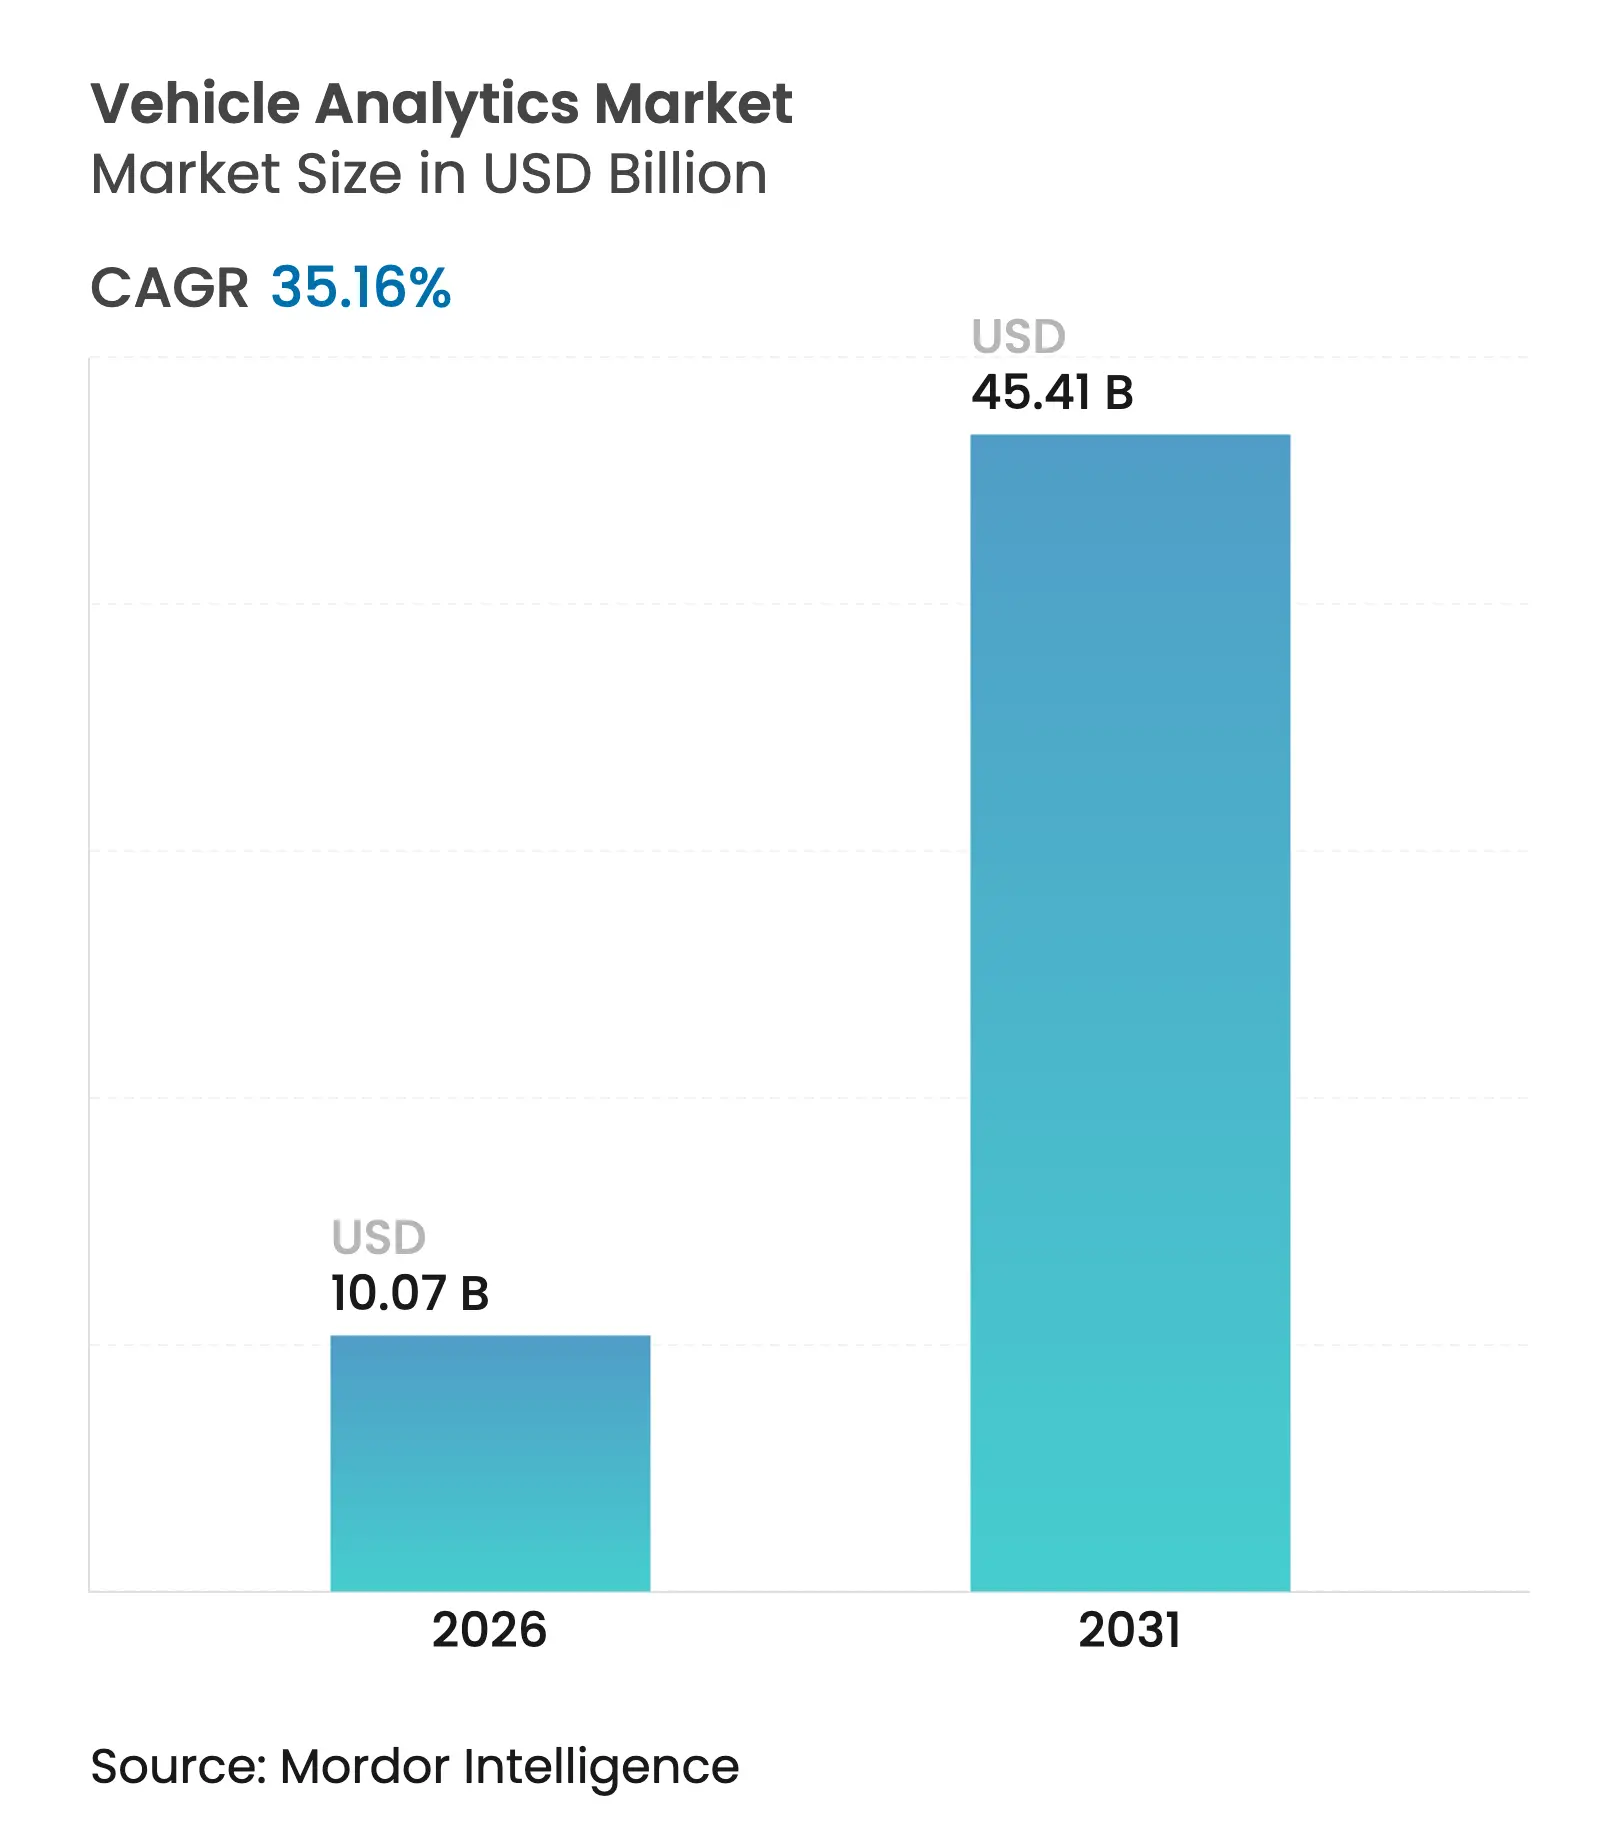
Rapid growth reflects the automotive sector’s pivot toward data-driven operations that monetize connected-car intelligence, cut downtime, and bolster safety. Wider 5G coverage, stricter emissions rules, and the rise of software-defined vehicles are expanding real-time analytics use cases, while successful data-monetization programs such as GM’s OnStar, which already generate more than USD 2 billion annually, illustrate clear revenue potential. Cloud hosting retains scale advantages, yet edge analytics is scaling quickly as collision-avoidance and over-the-air (OTA) updates demand millisecond response. Investors are crowding in; several AI-maintenance start-ups raised eight-figure rounds in 2024–2025, confirming confidence in profitable growth. Heightened privacy scrutiny, illustrated by a Texas lawsuit over unauthorized data sales, reminds market participants that transparent consent frameworks are now a commercial necessity.
Key Report Takeaways
Note: Market size and forecast figures in this report are generated using Mordor Intelligence's proprietary estimation framework, updated with the latest available data and insights as of 2026.
Drivers Impact Analysis
| Driver | (~) % Impact on CAGR Forecast | Geographic Relevance | Impact Timeline | |||
|---|---|---|---|---|---|---|
Connected-vehicle telematics proliferation Connected-vehicle telematics proliferation | +8.2% | Global; strongest in North America and Europe | Medium term (2–4 years) | (~) % Impact on CAGR Forecast :+8.2% | Geographic Relevance :Global; strongest in North America and Europe | Impact Timeline :Medium term (2–4 years) |
AI-driven predictive maintenance AI-driven predictive maintenance | +7.5% | Global; industrial fleet hubs | Short term (≤ 2 years) | |||
Regulatory safety and emissions mandates Regulatory safety and emissions mandates | +6.8% | North America, Europe, APAC spillover | Long term (≥ 4 years) | |||
Data-monetization marketplaces Data-monetization marketplaces | +5.9% | North America, Europe, emerging APAC | Medium term (2–4 years) | |||
Usage-based-insurance (UBI) adoption surge Usage-based-insurance (UBI) adoption surge | +4.7% | North America, Europe, selective APAC | Short term (≤ 2 years) | |||
Software-defined-vehicle (SDV) OTA analytics Software-defined-vehicle (SDV) OTA analytics | +3.6% | Global; led by premium OEMs | Long term (≥ 4 years) | |||
| Source: Mordor Intelligence | ||||||
Connected-Vehicle Telematics Proliferation
Nearly every new light vehicle sold worldwide will embed cellular connectivity by 2030, forming a data backbone for health monitoring, driver-behavior insights, and over-the-air feature activation. Stellantis now processes roughly 50 billion data points each month through its Mobilisights program, delivering actionable dashboards to fleets and consumers.[1]Stellantis Communications, “Mobilisights Processes 50 Billion Monthly Data Points,” stellantis.com As 5G subscriptions pass 5.6 billion by 2029, low-latency V2X communication will underpin collision-avoidance analytics, dynamic insurance pricing, and location-based commerce.[2]Ericsson Mobility Report, “5G Subscriptions to Hit 5.6 Billion by 2029,” ericsson.comTelco–platform tie-ups, such as KPN IoT’s marketplace for OEM data, show how partners unlock recurring revenue while automakers retain ownership of raw files. Yet competitive advantage pivots on transforming raw feeds into insights that reduce risk or open new services, not on connectivity itself. Mindful of privacy law, vendors increasingly embed automated consent tools that let drivers opt in and track benefits, tempering public pushback.
AI-Driven Predictive Maintenance Breakthroughs
Machine-learning models now forecast component failures weeks ahead, slashing roadside events and warranty claims. Mack Trucks cut unplanned downtime 27% after deploying AI diagnostics across its North American fleet. Start-ups such as COMPREDICT, fresh from a USD 15 million Series B led by Woven Capital, offer virtual sensors that derive stress metrics from existing signals, avoiding costly retrofits. For commercial operators, each avoided breakdown can protect thousands of dollars in delivery penalties and emergency repairs. Early adopters also report lower insurance premiums, as predictive models feed real-time risk scoring. The upside spans safety, sustainability, and customer satisfaction, reinforcing AI maintenance as a clear budget priority through 2027.
Regulatory Safety and Emissions Mandates
Governments are embedding analytics requirements inside new environmental and safety rules. The United States Environmental Protection Agency’s Multi-Pollutant Standards, effective 2027–2032, insist on continuous emissions reporting, pushing OEMs to pre-install high-resolution sensors and cloud dashboards.[3]Environmental Protection Agency, “Multi-Pollutant Standards 2027–2032,” epa.gov Europe’s General Safety Regulation II obliges every 2026 model to incorporate ADAS features whose data must be archived for compliance audits. Manufacturers that optimize powertrain settings through real-time analytics can stay under Euro 7 thresholds while retaining performance margins. Regulation, therefore, shifts analytics from optional to non-negotiable, creating baseline demand even during macroeconomic slowdowns.
Data-Monetization Marketplaces for OEMs and Fleets
Automakers now treat in-vehicle data as a balance-sheet asset. GM’s OnStar alone delivers more than USD 2 billion in connected-services revenue, illustrating a viable blueprint for peers. New market entrants focus on curated insights, road-hazard alerts, EV battery health certificates, dynamic leasing packages, rather than raw file sales, aligning with stricter consent rules after the US FTC flagged opaque data brokering. Fleets that participate in revenue-sharing schemes offset telematics subscription costs, driving adoption in cost-sensitive segments. As models mature, analytics vendors that enable micropayments, transparent sharing controls, and secure tokens will capture disproportionate growth.
Restraints Impact Analysis
| Restraint | (~) % Impact on CAGR Forecast | Geographic Relevance | Impact Timeline | |||
|---|---|---|---|---|---|---|
High total cost of ownership for full-stack solutions High total cost of ownership for full-stack solutions | -4.2% | Global; acute for SME fleets | Short term (≤ 2 years) | (~) % Impact on CAGR Forecast :-4.2% | Geographic Relevance :Global; acute for SME fleets | Impact Timeline :Short term (≤ 2 years) |
Data-privacy and cybersecurity compliance burdens Data-privacy and cybersecurity compliance burdens | -3.8% | Europe (GDPR), North America, global expansion | Medium term (2–4 years) | |||
Legacy-vehicle data acquisition limitations Legacy-vehicle data acquisition limitations | -2.9% | Mature automotive markets worldwide | Long term (≥ 4 years) | |||
Algorithmic bias in driver-scoring models Algorithmic bias in driver-scoring models | -1.7% | North America, Europe | Medium term (2–4 years) | |||
| Source: Mordor Intelligence | ||||||
High Total Cost of Ownership for Full-Stack Solutions
Comprehensive analytics rollouts can exceed USD 500 per vehicle each year once hardware, cloud fees, and specialist labor are included, straining budgets at small and midsize fleet operators.[4]FleetUp Blog, “Total Cost Analysis for Telematics Rollouts,” fleetup.comRetrofits of legacy trucks often run USD 1,000–3,000, pushing buyers toward selective sensor installations that limit value capture. Quartix’s 2024 interim report confirms that medium fleet prospects remain strong yet capital constrained, delaying full-scale deployments. Vendors responding with subscription bundles and pay-as-you-save models can alleviate entry pain, but high TCO still curbs penetration in price-sensitive regions through 2026.
Data-Privacy and Cyber-Security Compliance Burdens
GDPR, California CPRA, and UNECE WP.29 mandate granular consent logs, end-to-end encryption, and 72-hour breach reporting, driving compliance costs that consume 15–20% of analytics budgets. Microsoft and VicOne’s joint threat-intelligence service illustrates the expertise required to stay ahead of evolving attack vectors. Cross-border fleets juggling conflicting legal frameworks face additional overhead, while reputational risk from non-compliance deters risk-averse adopters. Until harmonized standards arrive, privacy complexity will subtract several points from the market’s otherwise aggressive growth trajectory.
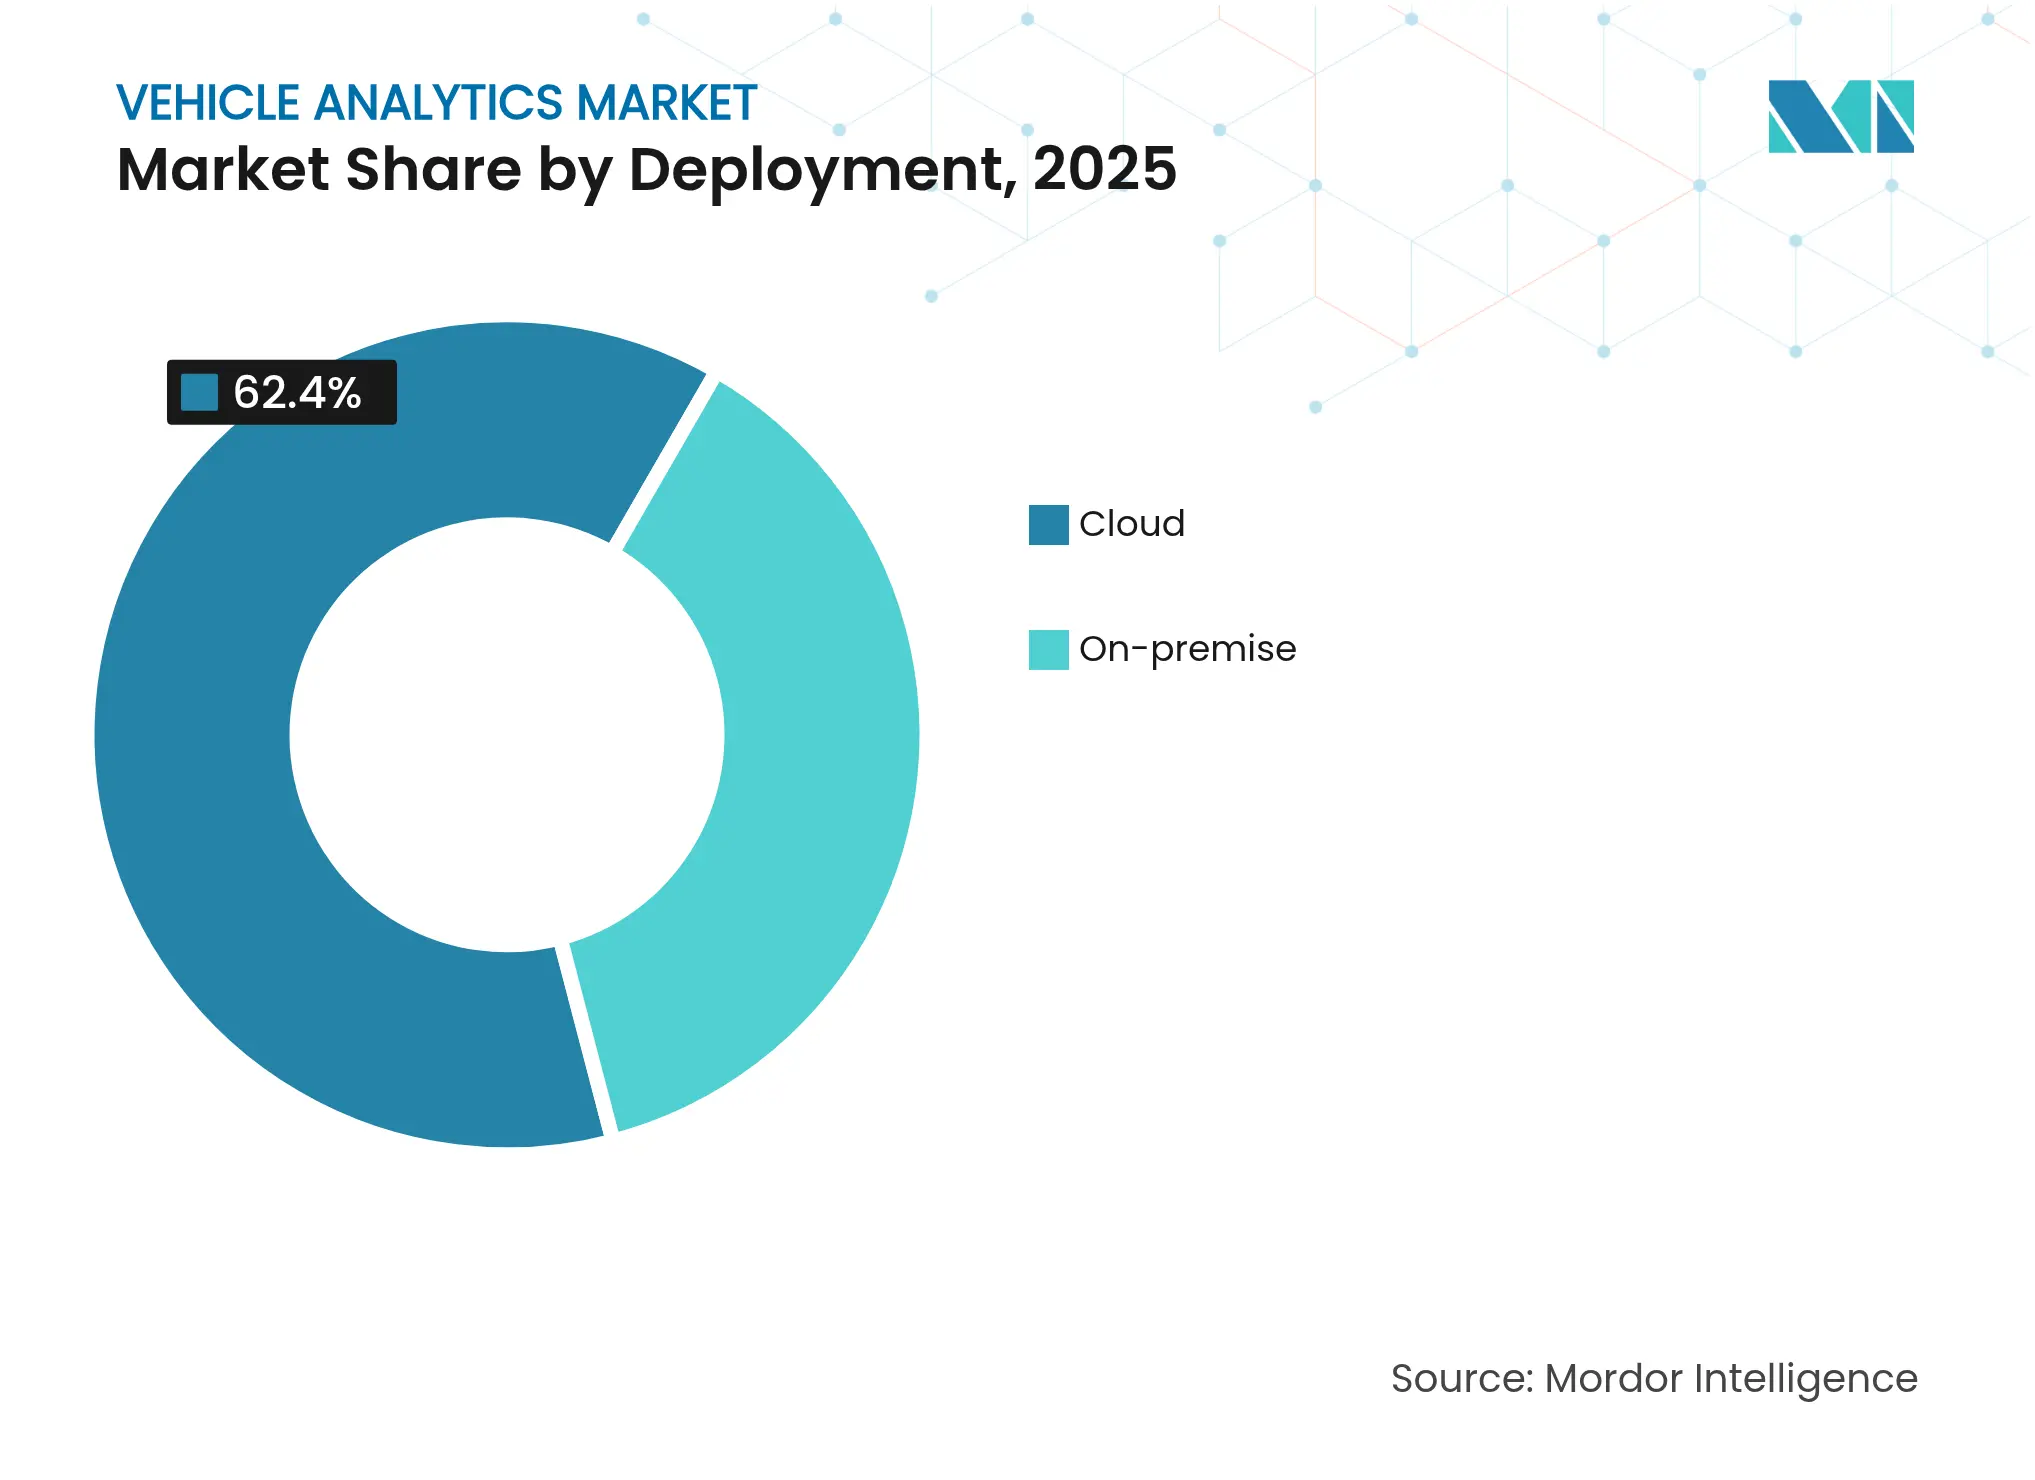
By Deployment: Cloud Dominance with Edge Acceleration
The vehicle analytics market size allocated to cloud platforms reached USD 4.65 billion in 2025, translating to a 62.40% revenue share. Centralized processing lowers capital outlay and offers elastic compute for long-horizon modeling, keeping cloud atop current adoption tables. Yet latency-critical use cases now drive a 19.12% CAGR in hybrid edge setups as fleets embed micro-servers to preprocess camera and LiDAR feeds locally. Geotab forecasts that AI-enabled fuel-efficiency gains will compel most enterprises to run inference at the roadside while synchronizing summary insights to the cloud. On-premise clusters survive mainly in defense and regulated finance fleets where data sovereignty trumps capex constraints.
Edge growth underscores a gradual architectural shift. Operators limit bandwidth bills by filtering raw video on-board, streaming only incident snippets for central audit. Meanwhile, OTA update orchestration benefits from bidirectional pipelines that stage binaries at the edge before cockpit installation, shrinking dwell time. As cybersecurity stacks mature, many buyers adopt managed edge gateways bundled with zero-trust frameworks, accelerating overall confidence in distributed intelligence.
Note: Segment shares of all individual segments available upon report purchase
By Component: Software Platforms Lead Services Surge
Software engines generated 57.30% of 2025 sector turnover, confirming that robust algorithms, visualization layers, and API ecosystems remain the motor driving adoption. Analytics leaders expose modular micro-services, allowing customers to swap scoring or mapping widgets without rewriting entire stacks. However, the fastest revenue line belongs to professional and managed services, expanding at 16.82% CAGR as fleets outsource model tuning and compliance chores. Service revenues rose alongside platform wins; each new license unlocks demand for configuration, KPI design, and user-training engagements that often exceed annual software fees.
The trend illustrates the maturation of the vehicle analytics industry, where buyers now prioritize outcome guarantees over DIY experimentation. Outsourcing partners blend domain expertise, maintenance engineering, actuarial statistics, behavioral coaching, to turn sensor streams into board-level metrics. Integrated offerings also address staff shortages; many transport firms struggle to hire data scientists, making managed analytics subscriptions the only viable path to real savings.
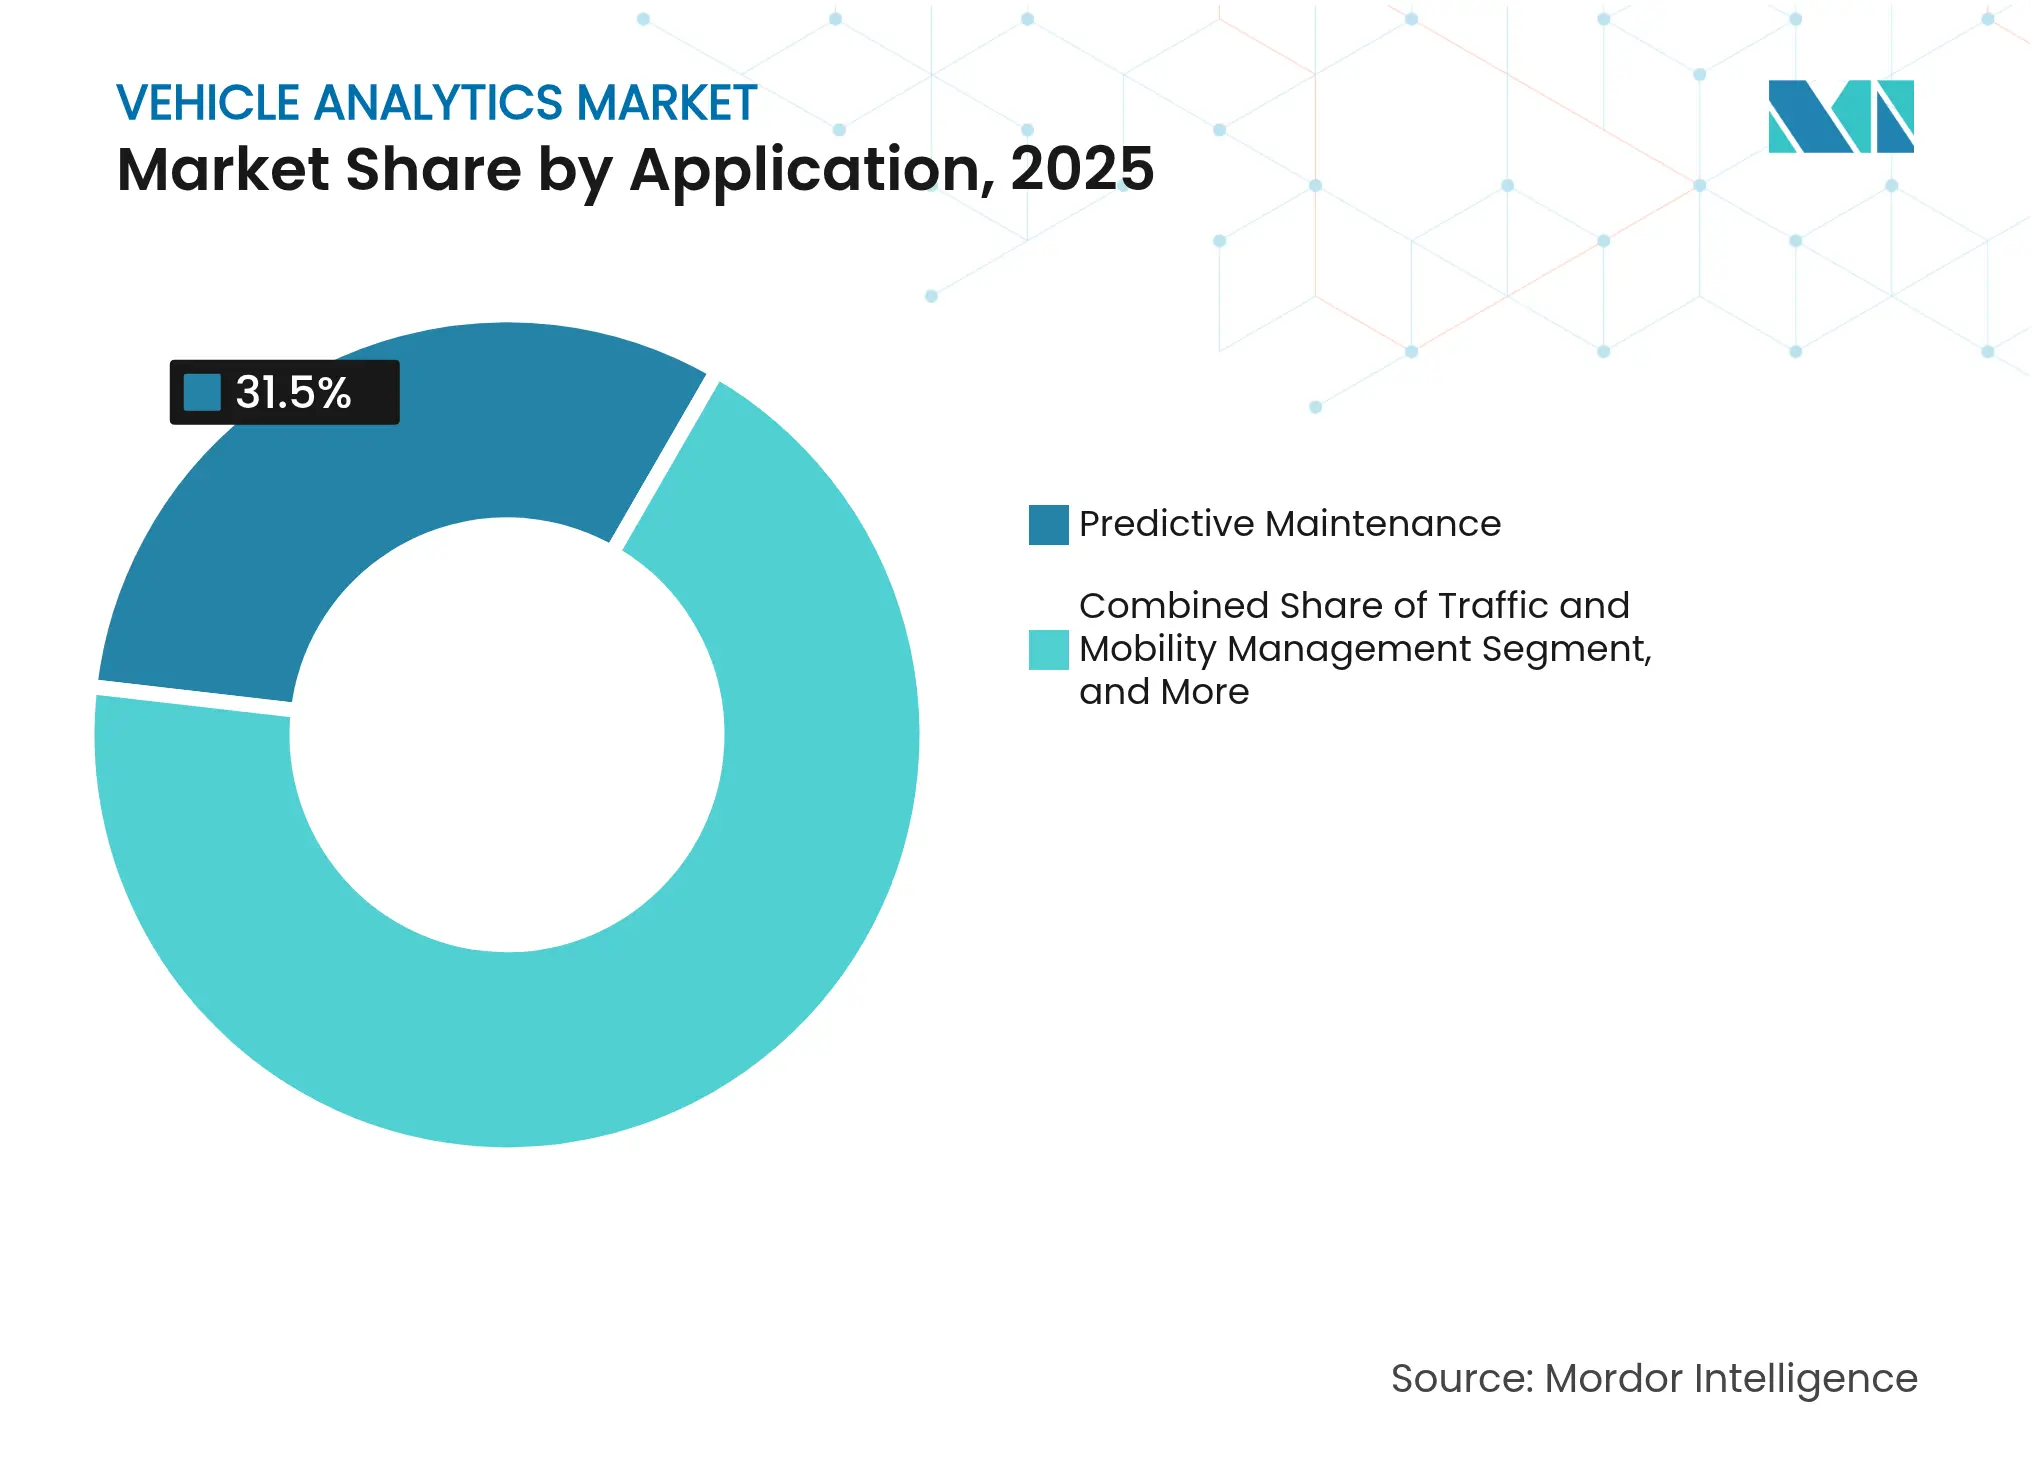
By Application: Predictive Maintenance Leads UBI Acceleration
Predictive maintenance controlled 31.50% revenue in 2025, equivalent to USD 2.35 billion of the vehicle analytics market size. Clear ROI, downtime reduction and warranty avoidance, keeps it first in budget line items. Algorithms now detect vibration patterns that precede bearing failure, or thermal drift indicating battery degradation, enabling just-in-time part swaps. Usage-based insurance represents the growth engine, climbing 23.24% annually as actuaries embed real-time driver scoring. Progressive, State Farm, and others share telematics rebates that attract switchers, forcing laggards to follow.
Additional segments progress at niche tempos. Safety-and-security dashboards win city contracts for Vision Zero targets. Dealer-network analytics refine inventory and service-bay staffing. Infotainment personalization grows as consumers expect smartphone-grade experience in-car. Each slice reinforces data-pipeline investments, since common ingestion and identity layers feed multiple downstream apps, raising platform stickiness.
Note: Segment shares of all individual segments available upon report purchase
By End-User: OEMs Dominate While Insurers Accelerate
Vehicle makers accounted for 40.60% of 2025 billings, underscoring how direct ECU access and design-phase integration grant OEMs a head start. Rivian’s data-driven production scheduling proved cost-competitive, supporting its first consecutive quarterly profits in 2025. Meanwhile insurers post the highest CAGR at 21.05% as underwriting shifts from static demographic proxies to live behavioral indexes. Large fleets remain pivotal, pooling huge mile datasets that enrich supplier algorithms.
After-market garages adopt analytics to pre-order parts and schedule technicians, smoothing lift-bay utilization. Mobility-as-a-Service providers integrate ride demand predictions with battery-state analytics to minimize dead-heading. Cross-sector convergence encourages platform vendors to embrace multi-tenant architectures configurable for each vertical, broadening total addressable demand.
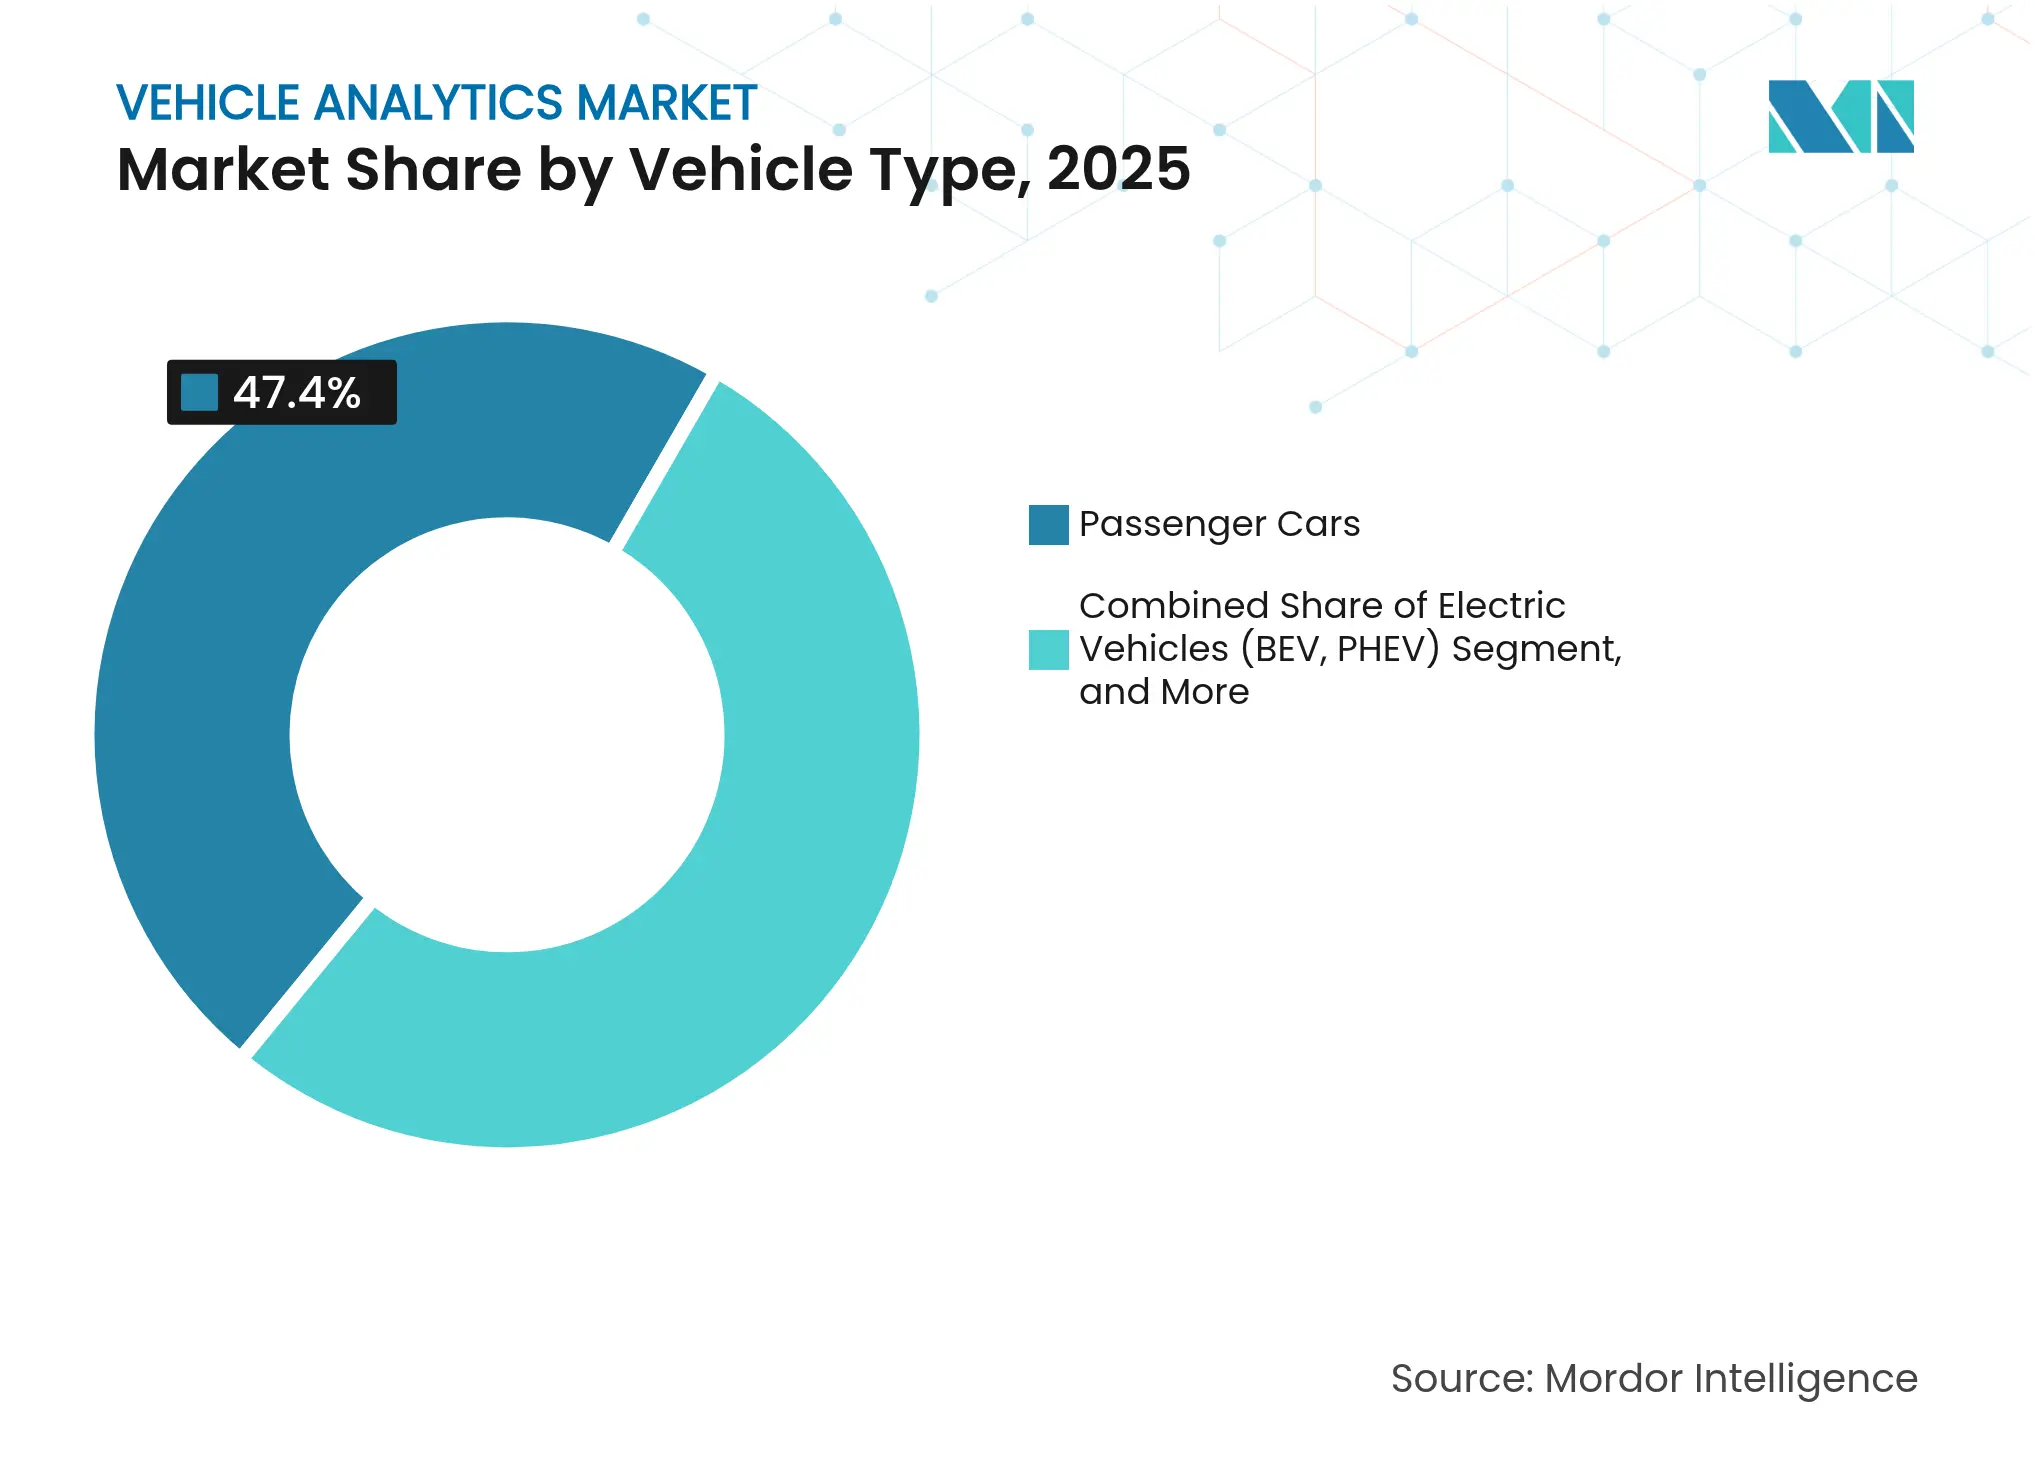
By Vehicle Type: Passenger Cars Lead EV Transformation
Passenger cars kept a 47.40% revenue share in 2025, reflective of global ownership volume and mature infotainment expectations. Still, battery-electric and plug-in hybrids log the steepest incline at 21.83% CAGR as regulators incentivize zero-emission fleets. EVs rely on granular battery-state analytics, charging-queue forecasting, and bidirectional-energy trading modules, all absent in legacy ICE telematics. NIO delivered 221,970 vehicles in 2024, a 38.7% jump that stretched its cloud-analytics cluster to millions of daily charge-cycle records.
Commercial vans and heavy trucks require torque and payload-aware models. Long-haul operators overlay tachograph feeds with weather APIs to flag rest-stop adjustments, while last-mile couriers optimize braking patterns for regen-energy recovery. Diversity of duty cycles underscores why modular inference stacks are gaining favor: each vehicle family subscribes only to relevant micro-models, minimizing computation overhead.
Note: Segment shares of all individual segments available upon report purchase
North America retained 35.70% of vehicle analytics market revenue in 2025, backed by dense telematics penetration, insurer telematics programs, and federal infrastructure funding that mandates connected-vehicle interfaces. US fleets leverage decades of ELD and emissions mandates, converting existing data pipes into AI insights with minimal hardware upgrades. Canada exports fleet-management expertise via Geotab, while Mexico’s manufacturing clusters demand plant-floor analytics and logistics visibility, broadening regional spend. Two policy fronts, California’s Advanced Clean Fleets rule and the National Highway Traffic Safety Administration’s ADAS proposals, are expected to widen future addressable budgets.
Asia-Pacific posts the fastest CAGR at 18.76%. China’s EV boom funnels billions into battery health dashboards and smart-charging orchestration; government subsidies hinge on transparent data reporting, effectively mandating analytics back-ends. Southeast Asia’s ride-hailing leaders deploy driver-behavior scoring to trim accident claims, while major logistics groups fit cross-border trucks with SIM-agnostic gateways to bypass patchy coverage. Japan and South Korea incubate V2X chipsets and OTA security stacks, harmonizing with domestic 5G rollouts to export solutions across ASEAN.
Europe blends maturity with regulatory rigor. GDPR shapes consent flows, and Euro 7 tail-pipe plus non-exhaust emissions caps lock analytics into every powertrain program. Germany’s OEMs test hydrogen-truck telemetry under Industry 4.0 frameworks, France channels stimulus into smart-charging corridors, and the United Kingdom pilots insurer-driven pay-per-mile taxes. While economic softness restrains fleet renewals, mandatory ADAS data-logging from 2026 under GSR II secures base revenue streams. Vendors that certify early for UN R155/R156 cybersecurity rules will win procurement contests as buyers prioritize compliance credentials.
Market Concentration
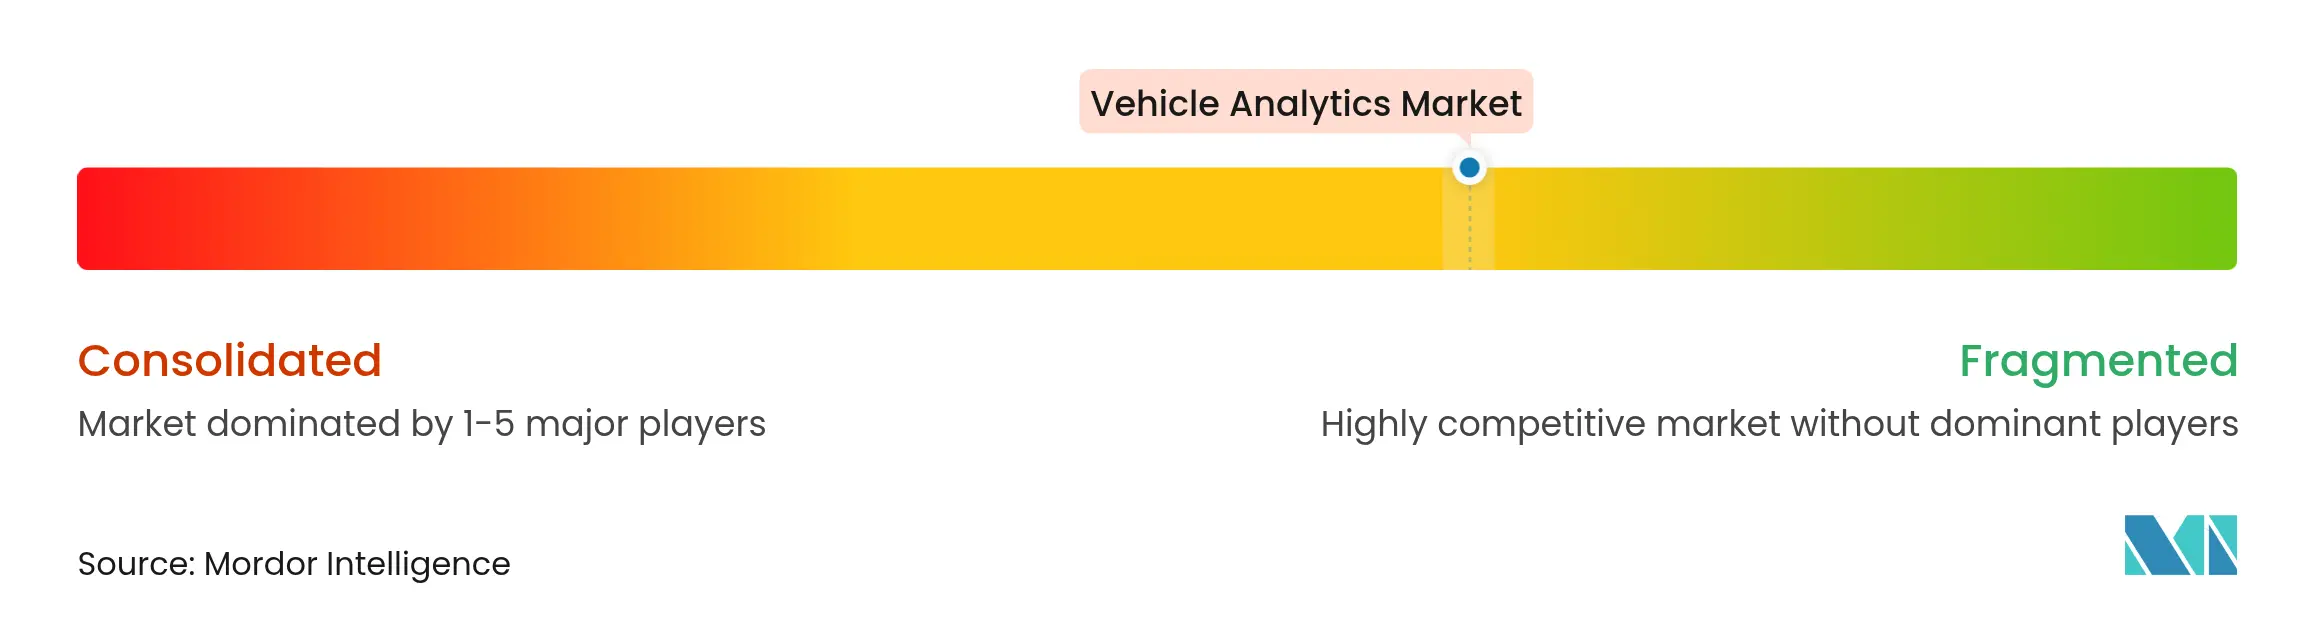
The vehicle analytics market remains fragmented; the five largest vendors, IBM, Microsoft, Continental, Geotab, and Trimble, collectively held under 30% revenue in 2024. Cloud hyperscalers exploit AI tooling breadth, but domain specialists such as Otonomo differentiate through purpose-built mobility data exchanges that fast-track privacy compliance. Hardware incumbents integrate sensor firmware to capture edge-compute real estate, pairing it with subscription dashboards to smooth earnings volatility.
Strategic moves underscore convergence. IBM tied its Maximo Application Suite with Red Hat OpenShift to enable containerized analytics at dealership service centers. Microsoft expanded Azure Automotive Data to bundle consent management APIs, easing GDPR audits for European OEMs. Continental launched a modular edge-gateway that slashes latency by processing ADAS frames locally before safe transmission, tapping demand from Level-2+ autonomy rollouts.
Partnerships multiply as time-to-market pressure grows. Applied Intuition and Porsche co-developed simulation-fed software pipelines to reduce external reliance and cut release cycles by 30%. T-Systems and Aurora Labs implemented differential update binaries that trim data volume 97%, tightening OTA economics. These deals illustrate buyer appetite for turnkey stacks that blend silicon, connectivity, AI, and regulatory wrappers under one invoice.

*Disclaimer: Major Players sorted in no particular order
1. INTRODUCTION
2. RESEARCH METHODOLOGY
3. EXECUTIVE SUMMARY
4. MARKET LANDSCAPE
5. MARKET SIZE AND GROWTH FORECASTS (VALUE)
6. COMPETITIVE LANDSCAPE
7. MARKET OPPORTUNITIES AND FUTURE OUTLOOK
Vehicle Analytics is a technology that allows the user or the manufacturer to gain insights from real-time information about the vehicle's current state, the driver's driving methods, etc. It also performs various tasks such as vehicle counting, tracking, brand detection, speed detection, road condition inspection, and incorrect direction detection.
The scope of the study focuses on the market analysis of vehicle analytics solutions sold across the globe. Market sizing encompasses the revenue generated through Vehicle Analytics solutions sold by various market players. The study also tracks the key market parameters, underlying growth influencers, and major vendors operating in the industry, which supports the market estimations and growth rates over the forecast period. The study further analyzes the overall impact of COVID-19 on the ecosystem.
The vehicle analytics market is Segmented by deployment (cloud, on-premise), by application (predictive maintenance, safety & security management, driver performance analysis), by end-user industry (fleet owners, insurers, OEMs, and service providers), by geography (North America, Europe, Asia Pacific, Latin America, Middle East & Africa). The report offers market forecasts and size in value (USD) for all the above segments.
Pricing Strategy for Semiconductor Components
3 Min Read
Accelerating Additive Manufacturing Adoption in India
3 Min Read
Wealth Management Intelligence for the Middle East
4 Min Read
When decisions matter, industry leaders turn to our analysts. Let’s talk.