Machine Learning As A Service (MLaaS) Market Size and Share
Market Overview
| Study Period | 2020 - 2031 |
|---|---|
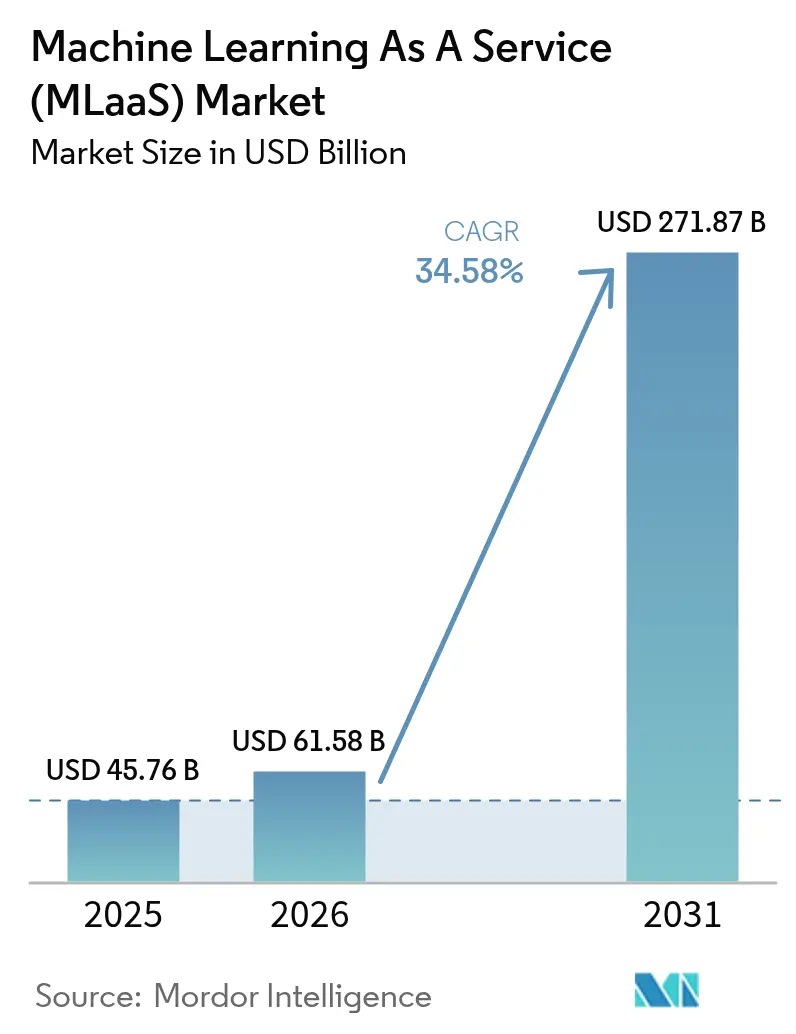
| Market Size (2026) | USD 61.58 Billion |
| Market Size (2031) | USD 271.87 Billion |
| Growth Rate (2026 - 2031) | 34.58% CAGR |
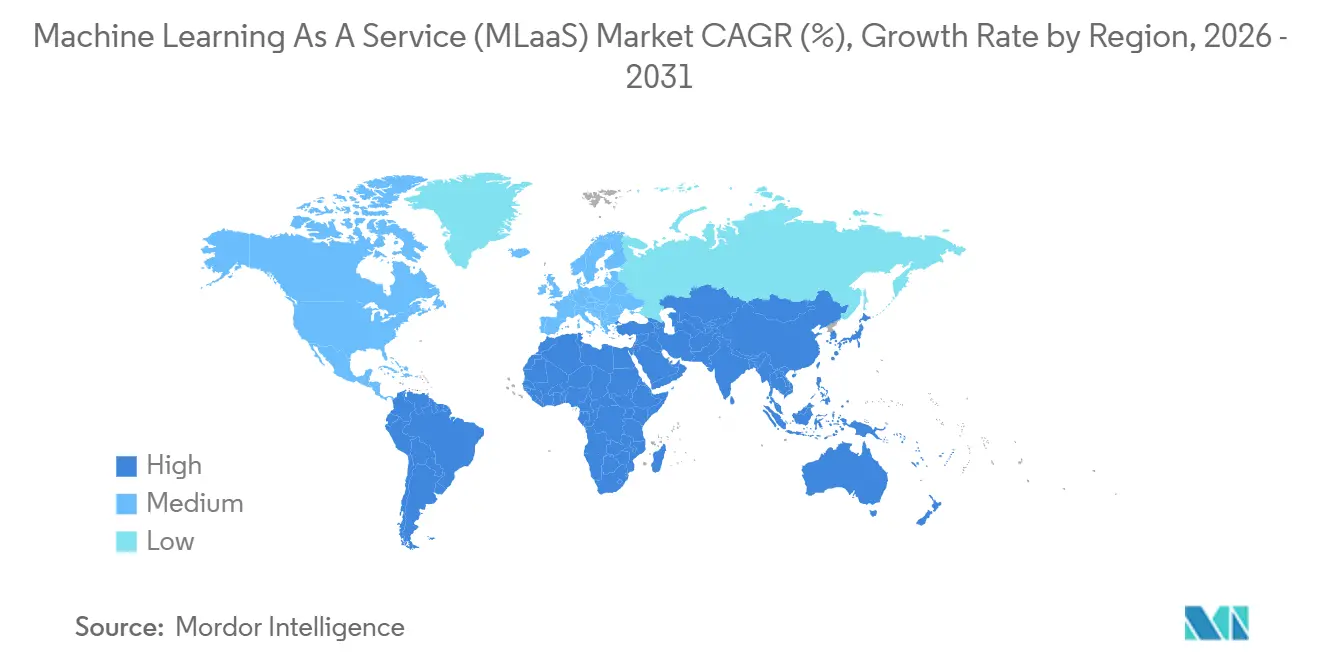
| Fastest Growing Market | Asia Pacific |
| Largest Market | North America |
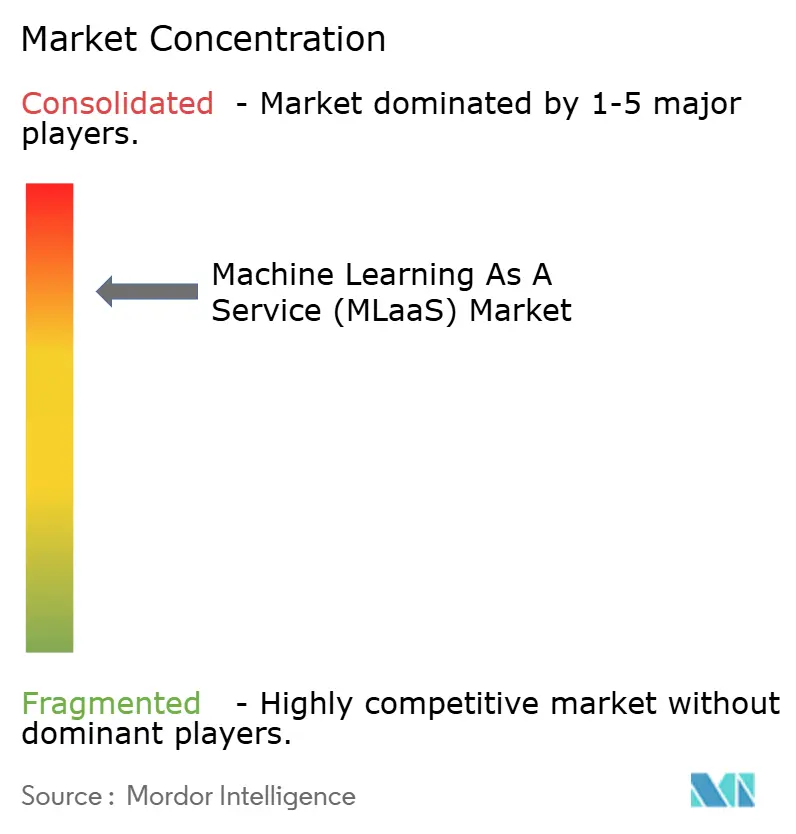
| Market Concentration | High |
Major Players *Disclaimer: Major Players sorted in no particular order Image © Mordor Intelligence. Reuse requires attribution under CC BY 4.0. | |
Machine Learning As A Service (MLaaS) Market Analysis by Mordor Intelligence
The Machine Learning as a Service (MLaaS) market size is expected to increase from USD 45.76 billion in 2025 to USD 61.58 billion in 2026 and reach USD 271.87 billion by 2031, growing at a CAGR of 34.58% over 2026-2031. Spending is shifting from pilots to production as enterprises plug generative AI toolkits into customer support, software development, and document workflows. Pay-per-use GPU pricing lets teams train and infer without capital outlays, while vertical model marketplaces shorten deployment cycles for highly regulated sectors. Sovereign-cloud mandates in Europe and Asia force providers to add in-country regions, yet they also open the door for regional specialists. Competition is intensifying, but the addressable pool of workloads is expanding faster, keeping headline growth intact despite price compression.
Key Report Takeaways
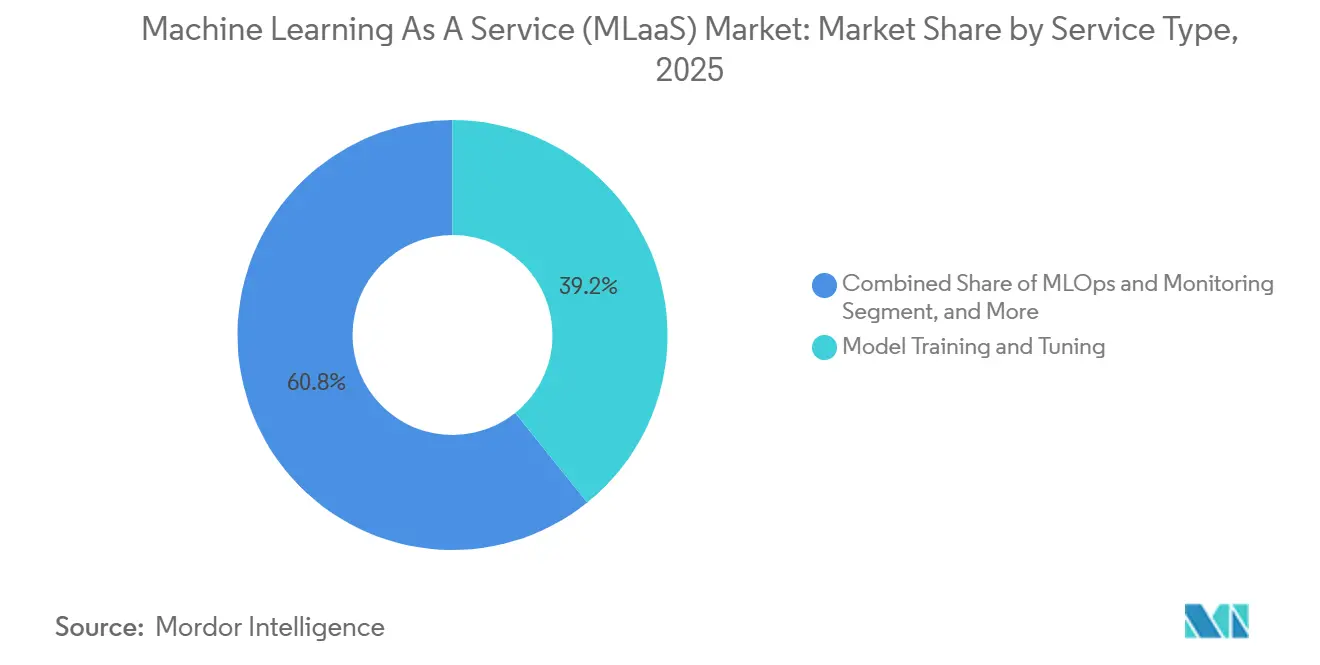
- By service type, Model Training and Tuning led the Machine Learning as a Service (MLaaS) market with 39.22% market share in 2025, while MLOps and Monitoring are projected to expand at a 35.57% CAGR through 2031.
- By application, Fraud Detection and Risk Analytics captured 23.47% of the Machine Learning as a Service (MLaaS) market in 2025, and Computer Vision is set to grow at a 35.61% CAGR through 2031.
- By organization size, Large Enterprises accounted for 62.36% of the Machine Learning as a Service market share in 2025, whereas Small and Medium-Sized Enterprises are forecast to register a 34.91% CAGR to 2031.
- By deployment mode, Public Cloud dominated the Machine Learning as a Service (MLaaS) market with a 68.24% share in 2025, and Hybrid and Multi-Cloud are anticipated to post a 35.17% CAGR to 2031.
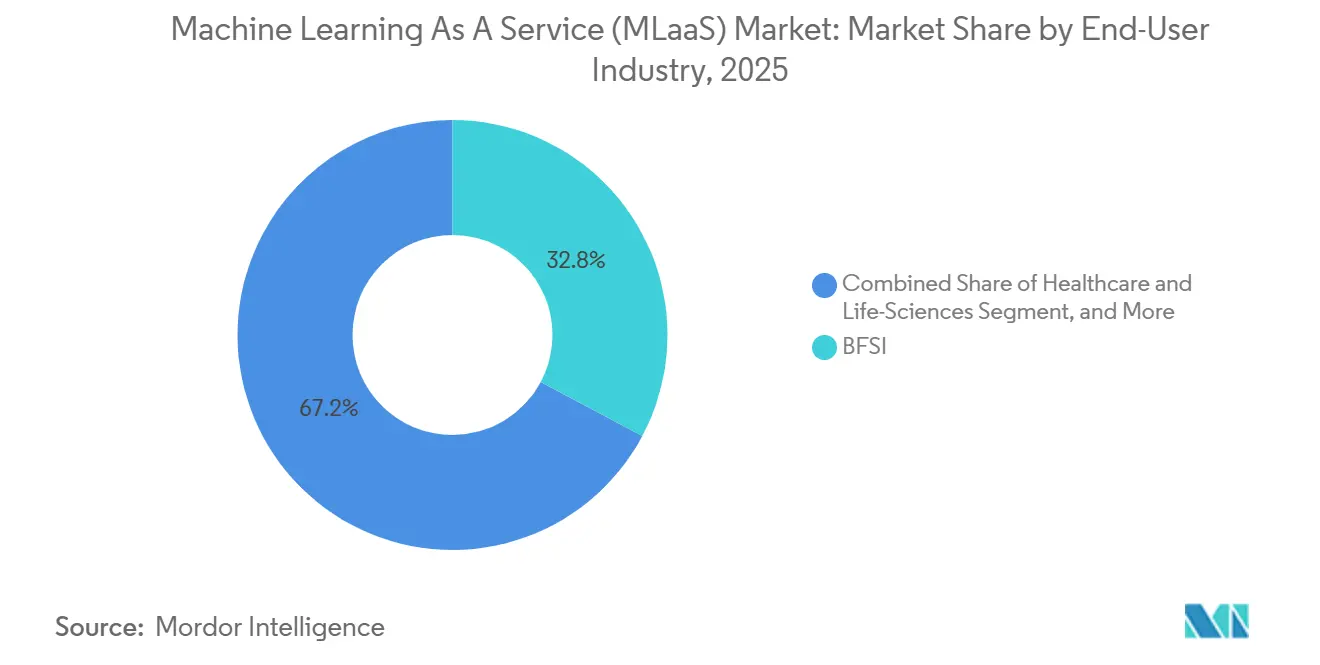
- By end-user industry, the BFSI segment held 32.78% of the Machine Learning as a Service market share in 2025, while Healthcare and Life Sciences are poised for the fastest 35.94% CAGR to 2031.
- By geography, North America commanded 46.89% of the Machine Learning as a Service market share in 2025, and Asia-Pacific is projected to climb at the highest 35.53% CAGR to 2031.
Note: Market size and forecast figures in this report are generated using Mordor Intelligence’s proprietary estimation framework, updated with the latest available data and insights as of 2026.
Global Machine Learning As A Service (MLaaS) Market Trends and Insights
Drivers Impact Analysis*
| Driver | (~) % Impact on CAGR Forecast | Geographic Relevance | Impact Timeline |
|---|---|---|---|
| Surge in Gen-AI Toolkits Offered "As-A-Service" | +6.2% | Global, led by North America and Europe | Medium term (2-4 years) |
| Rapid SME Cloud-Migration in Emerging Asia | +5.8% | Asia-Pacific core, spill-over to Middle East | Short term (≤ 2 years) |
| Cyber-Insurance Rebates for AI-Enabled Threat-Detection | +3.1% | North America and Europe | Short term (≤ 2 years) |
| Pay-Per-Use GPU Pricing by Hyperscalers | +4.7% | Global | Short term (≤ 2 years) |
| Vertical-Specific ML Model Marketplaces | +4.3% | Global, with early gains in North America | Medium term (2-4 years) |
| National AI-Cloud Programs (e.g., EU's Gaia-X) | +2.9% | Europe core, emerging in Middle East and Africa | Long term (≥ 4 years) |
| Source: Mordor Intelligence | |||
Surge in Gen-AI Toolkits Offered “As-A-Service”
Microsoft disclosed that revenue from Azure OpenAI Service more than doubled in fiscal 2025 as enterprises embedded large language models into chatbots, document review systems, and software development workflows.[1]Azure Machine Learning documentation, Microsoft, microsoft.com Amazon unveiled Bedrock in 2025, aggregating models from Anthropic, Cohere, and Stability AI under a single API, and announced thousands of enterprise onboarding within its first year. Google expanded the Vertex AI Model Garden to 150 pre-trained models, pairing usage-based pricing with built-in safety filters that comply with upcoming European Union transparency rules. These services convert model development from a capital project to an operating expense, enabling business units to spin up proofs of concept in days. Because vendors monetize tokens processed rather than instance hours, inference workloads carry higher gross margins, making this driver a powerful top-line catalyst.
Rapid SME Cloud-Migration in Emerging Asia
India’s Digital India program allocated USD 1.2 billion in 2025 to subsidize GPU credits for startups and small firms, boosting deployments of machine-learning workloads by 40% year over year.[2]“Digital India Programme,” Ministry of Electronics and Information Technology, digitalindia.gov.in Singapore’s SME Go Digital scheme co-funds cloud adoption and supplies vetted ML solutions for inventory and marketing use cases. A 2025 Deloitte survey found that 68% of Asia-Pacific SMEs plan to increase cloud spending by more than 20% in 2026, citing machine learning as the primary driver of their workloads. Alibaba Cloud responded with localized credit-scoring and recommendation models in Bahasa Indonesia and Vietnamese, removing language and compliance hurdles for first-time adopters. The convergence of subsidies, regulatory nudges, and turnkey models is activating an underserved segment of the volume market, pushing regional growth above the global average.
Cyber-Insurance Rebates for AI-Enabled Threat-Detection
Google Cloud’s Risk Protection Program, launched in 2025, offers clients up to USD 1 million in cyber-insurance coverage when they deploy Chronicle Security Operations, effectively lowering the net cost of ML-driven security analytics.[3]“Vertex AI Model Garden,” Google Cloud, cloud.google.com The National Association of Insurance Commissioners recommended that carriers integrate AI controls into underwriting, prompting a wave of premium discounts tied to anomaly-detection capabilities. Connecticut’s Insurance Department issued guidance allowing claim denials if insureds lack “reasonable” AI-based monitoring, turning optional tooling into a de facto compliance obligation. Leaders Edge reported in 2025 that 42% of U.S. enterprises list insurance savings among the top three reasons for adopting AI security platforms. As insurers act as demand aggregators, security-focused MLaaS vendors gain a new, non-traditional distribution channel.
Pay-Per-Use GPU Pricing by Hyperscalers
Amazon began per-second billing for NVIDIA H100 instances in 2025, while spot pricing can cut costs by up to 70% for fault-tolerant training jobs. Microsoft and Google extended low-priority or preemptible options to advanced GPUs, letting startups train 70-billion-parameter models for under USD 10,000, a threshold unreachable in 2023. Decentralized brokers such as Vast.ai aggregate unused GPUs from data centers and gaming rigs, publishing hourly rates far below hyperscaler on-demand tariffs. Variable pricing shifts experimentation from capital budgets to operational spend, broadening participation among universities, mid-market firms, and emerging-market developers. Although margin pressure rises on infrastructure providers, the substantially larger workload pool keeps absolute revenue on a growth trajectory.
Restraints Impact Analysis*
| Restraint | (~) % Impact on CAGR Forecast | Geographic Relevance | Impact Timeline |
|---|---|---|---|
| AI-Model IP-Ownership Disputes | -2.8% | Global, concentrated in North America and Europe | Medium term (2-4 years) |
| Rising Sovereign-Cloud Mandates | -3.4% | Europe, China, India, Middle East | Long term (≥ 4 years) |
| Hidden Carbon-Cost Disclosures | -1.6% | Europe and North America | Medium term (2-4 years) |
| Run-Time Data-Bias Liabilities | -2.1% | North America and Europe | Short term (≤ 2 years) |
| Source: Mordor Intelligence | |||
AI-Model IP-Ownership Disputes
Getty Images sued Stability AI in 2023 for training on 12 million copyrighted photos without permission, and the case advanced toward trial in 2025 with potential damages topping USD 1 billion. The New York Times filed suit against OpenAI and Microsoft in late 2023 over alleged infringement in large language model training, elevating corporate counsel concerns about derivative-work liabilities. The European Union AI Act obliges vendors to disclose their training data sources and to provide opt-out mechanisms, increasing compliance overhead. Until jurisprudence clarifies ownership boundaries, regulated industries are delaying generative AI rollouts or demanding indemnity clauses that raise vendor costs. As legal uncertainty endures, the adoption curve for Machine Learning as a Service experiences periodic pauses.
Rising Sovereign-Cloud Mandates
Gaia-X in Europe requires sensitive workloads to run on infrastructure governed by EU data-sovereignty rules, compelling hyperscalers to build partner-led national clouds at higher capital intensity. China’s Data Security Law enforces on-shore data handling and subjects foreign providers to security vetting, constraining cross-border ML inference. India’s pending Digital Personal Data Protection Act proposes local processing for “critical personal data,” forcing providers to replicate model training stacks in-country. Saudi Arabia’s regulations bar government data from leaving the kingdom, further fragmenting global infrastructure footprints. These divergent mandates dilute economies of scale, elevate latency for federated workloads, and slow multi-region rollouts, trimming forecast growth despite strong underlying demand.
*Our forecasts treat driver/restraint impacts as directional, not additive. The impact forecasts reflect baseline growth, mix effects, and variable interactions.
Segment Analysis
By Service Type: Monitoring Gains Momentum After Training Peak
Model Training and Tuning commanded 39.22% of the Machine Learning as a Service (MLaaS) market share in 2025, reflecting the heavy compute needs of fine-tuning large language and vision models. Adoption has matured, and vendors now bundle efficient optimizers and pre-trained weights that cut training costs by double digits. In contrast, MLOps and Monitoring are projected to post the fastest 35.57% CAGR through 2031 as enterprises pivot toward drift detection, lineage tracking, and automated rollback. This shift means revenue is tilting from episodic training to recurring governance subscriptions, a pattern investors reward with premium valuations.
The monitoring upswing also changes vendor power dynamics. Hyperscalers extend native dashboards, but third-party specialists win deals where clients seek cross-cloud visibility and policy controls. Edge deployments for vision and anomaly workloads further increase monitoring demand, as local models require frequent performance audits. Service integrators now pitch “operate first, optimize later” engagements that allocate more hours to quality assurance than to algorithm selection. Ultimately, operational tooling is becoming the stickiest line item in the service stack.


By Application: Vision Races Ahead While Fraud Retains Breadth
Fraud Detection and Risk Analytics captured 23.47% of the Machine Learning as a Service (MLaaS) market in 2025, as banks raced to comply with real-time transaction mandates. Most tier-one institutions already refresh models daily, so incremental spend now centers on explainability layers that satisfy auditors. Computer Vision is projected to expand at a blistering 35.61% CAGR during 2026-2031, fueled by shelf analytics in retail and defect detection on automotive assembly lines. Cheaper edge cameras and 40-TOPS modules shrink payback periods, unlocking budgets far beyond early adopters.
Growth is also jumping from pure detection into multimodal generative tasks such as product rendering and design assistance. Retail media networks integrate vision models with customer journey analytics, boosting upsell rates. Industrial firms embed cameras into predictive-maintenance meshes, widening the addressable scope from a few pilot lines to entire plants. As vision platforms mature, they displace bespoke point tools, consolidating spend onto full-stack MLaaS contracts. Fraud solutions will keep scale, but vision delivers the next S-curve.
By Organization Size: SMEs Narrow the Capability Gap
Large Enterprises held 62.36% of the Machine Learning as a Service (MLaaS) market share in 2025, leveraging deep data estates and in-house science teams to build custom models. Yet cloud providers now roll out no-code canvases and vertical templates that let business analysts train predictors from spreadsheets, eroding the historical skills moat. Small and Medium-Sized Enterprises are forecast to climb at a 34.91% CAGR, only a fraction below the overall pace, as subsidy programs and usage-based billing eliminate up-front hurdles. Hyperscalers sweeten the pitch with free credits tied to accelerator programs, nudging startups into long-term lock-in.
The SME wave is reshaping sales motions. Instead of year-long enterprise license negotiations, providers push swipe-and-go storefronts with transparent pricing and rapid onboarding. Volume rather than ticket size drives revenue, so partners focus on digital channels and marketplace listings. Consultants develop fixed-fee playbooks such as inventory forecasting, churn prediction, and image tagging that slot into generic enterprise resource planning suites, shortening deployment time to days. Over time, SMEs will not only grow faster but also influence product roadmaps toward simplicity over configurability.
By End-User Industry: Healthcare Surges Past Compliance-Led BFSI
BFSI delivered 32.78% revenue in 2025, anchored by mature anti-fraud and credit-risk models that refresh thousands of times per day. Spend now pivots to explainability dashboards and synthetic data generators that guard customer privacy. Healthcare and Life-Sciences, however, are projected to register the swiftest 35.94% CAGR on the back of clearer U.S. FDA pathways and new reimbursement codes for AI-assisted diagnostics. Hospitals replace on-premise clusters with cloud inference endpoints that process imaging scans in near real time, reducing report turnaround by hours and freeing radiologist capacity.
Pharmaceutical firms expand use of generative models for molecule design and trial matching, consuming large bursts of GPU hours. Meanwhile, payers fund predictive models that flag high-risk patients for early intervention, tightening the feedback loop between providers and insurers. Other verticals, retail, telecom, and automotive, sustain healthy double-digit gains, yet healthcare’s regulatory green light unlocks pent-up demand and larger deal sizes. Vendors that ship HIPAA-ready pipelines and out-of-the-box audit logs stand to capture an outsized share.
By Deployment Mode: Hybrid Architecture Balances Scale and Sovereignty
Public Cloud commanded a 68.24% share of the Machine Learning as a Service market in 2025, reflecting the allure of elastic capacity and rich managed services. Yet Hybrid and Multi-Cloud deployments are on track for a 35.17% CAGR as data-sovereignty laws compel banks, hospitals, and government agencies to keep sensitive workloads in-country. Enterprises adopt policy engines that route data to on-premise clusters for training while pushing inference to cloud regions for scale. Cross-cloud replication tools erase egress fees, making workload portability both technically and economically viable.
Vendors now sell compliance-ready blueprints that combine private subnets, key-management isolation, and regional sovereign tiers. Edge nodes are introduced into the topology for latency-critical inference, such as fraud scoring and industrial vision. Private Cloud lingers in defense and nuclear sectors but often operates as a quarantined partition within broader hybrid fabrics. Over time, the winning pattern is not Cloud versus on-premises but an orchestrated placement driven by risk, cost, and performance policies, cementing hybrid control planes as the strategic glue for enterprise AI.
Geography Analysis
North America held 46.89% of the Machine Learning as a Service (MLaaS) market share in 2025, supported by dense hyperscaler data-center footprints and early enterprise cloud adoption. U.S. banks, insurers, and hospitals each spend tens of millions of dollars per year on managed ML pipelines, while Canada channels federal grants into AI research hubs that feed commercial demand. Mexico benefits from near-shoring trends that are pushing manufacturers to deploy predictive-quality models, though average deal sizes remain smaller than in the United States. Asia-Pacific is projected to grow at a 35.53% CAGR as SMEs in India, Indonesia, and Vietnam bypass on-premise legacies and embrace cloud-native stacks. India’s subsidy programs and language-localized templates shorten ramp-up times, and China’s intelligent-computing centers add sovereign capacity that attracts domestic automotive and retail clients.
Europe ranks second among regional buyers, but growth is slower than in Asia-Pacific because compliance costs tied to the AI Act and GDPR lengthen procurement cycles. Germany and France anchor spending on autonomous-vehicle perception and pharmaceutical discovery, yet national cloud initiatives require providers to duplicate infrastructure, limiting the economies of scale enjoyed in North America. The United Kingdom relies on open-data policies and strong fintech activity to offset Brexit-driven funding gaps. In the Middle East and Africa, Gulf Cooperation Council countries invest oil revenues in sovereign AI clouds designed to support smart-city and industrial IoT workloads. South Africa and Egypt act as continental beachheads, though limited broadband capacity slows wider penetration.
South America contributes a smaller share of the Machine Learning as a Service market, with Brazil leading adoption across agriculture, financial services, and e-commerce. Currency volatility in Argentina restricts enterprise IT budgets, delaying multi-region cloud migrations. Chile and Colombia focus on mining and logistics optimization, leveraging ML to lift export competitiveness. Across emerging regions, mobile-first strategies allow telcos to package AI APIs with data plans, seeding grassroots experimentation even where fixed-line connectivity lags. Taken together, geography dictates deployment models: mature markets optimize cost and governance, while developing economies prioritize first-time automation and subsidized on-ramps.

Competitive Landscape
Amazon Web Services, Microsoft Azure, and Google Cloud jointly accounted for roughly 60% of the Machine Learning as a Service market share in 2025, placing the sector in a moderate-concentration zone. Each bundle offers proprietary accelerators, managed models, and token-based billing to deepen customer lock-in, yet no single provider holds a majority position. The remaining 40% fragments across specialists that monetize workflow orchestration, data engineering, and governance layers, ignored by hyperscalers.
Databricks, Snowflake, and DataRobot extend core offerings with feature stores, vector search, and automated monitoring, winning heavily regulated accounts that demand cross-cloud consistency. H2O.ai and C3.ai pursue vertical depth, shipping HIPAA-ready healthcare modules and FedRAMP-cleared defense suites that shorten sales cycles in markets where compliance dominates buying criteria. Oracle and SAP convert legacy enterprise resource planning customers by embedding ML services into existing transaction systems, reducing switching friction and tapping captive data estates.
Emerging disruptors reshape price-performance curves. Decentralized GPU marketplaces supply cut-rate training cycles to startups, pressuring hyperscaler spot prices. Open-source communities standardize model wrappers and MLOps tooling, lowering exit barriers for dissatisfied tenants. Hardware challengers such as Groq and SambaNova tout order-of-magnitude gains in inference latency, but ecosystem lock-in tempers rapid adoption. Strategic activity clusters around three levers: vertical integration, sovereign-cloud expansion, and built-in guardrails that convert regulatory pain points into product features. With no provider able to dominate every layer, competitive dynamics reward platforms that blend scale economics and trust architecture while preserving workload portability.
Machine Learning As A Service (MLaaS) Industry Leaders
Amazon Web Services, Inc.
Microsoft Corporation
Alphabet Inc.
IBM Corporation
SAP SE
- *Disclaimer: Major Players sorted in no particular order

Recent Industry Developments
- February 2026: Microsoft confirmed a USD 3 billion build-out of Azure AI regions in Indonesia and Thailand, including sovereign capacity rings.
- January 2026: AWS unveiled SageMaker HyperPod, a managed cluster that cuts foundation-model training time by up to 40%.
- December 2025: Databricks acquired Einblick Analytics for USD 250 million to add visual data exploration to Lakehouse.
- November 2025: Google Cloud expanded Vertex AI Model Garden with 50 open-source and partner models and integrated drift monitoring.


Global Machine Learning As A Service (MLaaS) Market Report Scope
The Machine Learning As A Service (MLaaS) Market Report is Segmented by Service Type (Model Development Platforms, Data Preparation and Annotation, Model Training and Tuning, Inference and Deployment, MLOps and Monitoring), Application (Marketing and Advertising, Predictive Maintenance, Fraud Detection and Risk Analytics, Automated Network Management, Computer Vision), Organization Size (Small and Medium-Sized Enterprises, and Large Enterprises), End-User Industry (IT and Telecom, BFSI, Healthcare and Life-Sciences, Automotive and Mobility, Retail and E-Commerce, Government and Defense, Other End-User Industries), Deployment Mode (Public Cloud, Private Cloud, Hybrid/Multi-Cloud), and Geography (North America, South America, Europe, Asia-Pacific, Middle East and Africa). The Market Forecasts are Provided in Terms of Value (USD).
| Model Development Platforms |
| Data Preparation and Annotation |
| Model Training and Tuning |
| Inference and Deployment |
| MLOps and Monitoring |
| Marketing and Advertising |
| Predictive Maintenance |
| Fraud Detection and Risk Analytics |
| Automated Network Management |
| Computer Vision |
| Small and Medium-Sized Enterprises |
| Large Enterprises |
| IT and Telecom |
| BFSI |
| Healthcare and Life-Sciences |
| Automotive and Mobility |
| Retail and E-Commerce |
| Government and Defense |
| Other End-User Industries |
| Public Cloud |
| Private Cloud |
| Hybrid / Multi-Cloud |
| North America | United States | |
| Canada | ||
| Mexico | ||
| South America | Brazil | |
| Argentina | ||
| Rest of South America | ||
| Europe | United Kingdom | |
| Germany | ||
| France | ||
| Italy | ||
| Rest of Europe | ||
| Asia Pacific | China | |
| Japan | ||
| India | ||
| South Korea | ||
| Rest of Asia Pacific | ||
| Middle East and Africa | Middle East | United Arab Emirates |
| Saudi Arabia | ||
| Rest of Middle East | ||
| Africa | South Africa | |
| Egypt | ||
| Rest of Africa | ||
| By Service Type | Model Development Platforms | ||
| Data Preparation and Annotation | |||
| Model Training and Tuning | |||
| Inference and Deployment | |||
| MLOps and Monitoring | |||
| By Application | Marketing and Advertising | ||
| Predictive Maintenance | |||
| Fraud Detection and Risk Analytics | |||
| Automated Network Management | |||
| Computer Vision | |||
| By Organization Size | Small and Medium-Sized Enterprises | ||
| Large Enterprises | |||
| By End-User Industry | IT and Telecom | ||
| BFSI | |||
| Healthcare and Life-Sciences | |||
| Automotive and Mobility | |||
| Retail and E-Commerce | |||
| Government and Defense | |||
| Other End-User Industries | |||
| By Deployment Mode | Public Cloud | ||
| Private Cloud | |||
| Hybrid / Multi-Cloud | |||
| By Geography | North America | United States | |
| Canada | |||
| Mexico | |||
| South America | Brazil | ||
| Argentina | |||
| Rest of South America | |||
| Europe | United Kingdom | ||
| Germany | |||
| France | |||
| Italy | |||
| Rest of Europe | |||
| Asia Pacific | China | ||
| Japan | |||
| India | |||
| South Korea | |||
| Rest of Asia Pacific | |||
| Middle East and Africa | Middle East | United Arab Emirates | |
| Saudi Arabia | |||
| Rest of Middle East | |||
| Africa | South Africa | ||
| Egypt | |||
| Rest of Africa | |||


Key Questions Answered in the Report
How fast is spending on cloud-delivered ML services growing?
Aggregate spending rises at a 34.58% CAGR from 2026 to 2031, expanding the Machine Learning as a Service market size from USD 61.58 billion to USD 271.87 billion.
Which service type will outpace overall growth?
MLOps and Monitoring posts the fastest trajectory at a 35.57% CAGR as enterprises prioritize governance and drift control once models hit production.
Why is Asia-Pacific the fastest growing region?
Subsidies, language-localized toolkits, and SME cloud migrations propel a 35.53% CAGR, narrowing the adoption gap with North America.
What is the biggest barrier to wider adoption?
Rising sovereign-cloud mandates and unresolved IP ownership disputes introduce legal and cost friction that can shave more than 3% off forecast CAGR.
Which vertical offers the strongest upside beyond BFSI?
Healthcare and Life-Sciences, fueled by FDA guidance and new reimbursement codes, is projected to grow at 35.94% through 2031.
How concentrated is supplier power?
The top three hyperscalers capture roughly 60% revenue, so buyers retain meaningful leverage, especially when multi-cloud strategies are in place.
Page last updated on:


