Asia-Pacific Agricultural Biologicals Market Size and Share
Market Overview
| Study Period | 2018 - 2031 |
|---|---|
| Forecast Data Period | 2026 - 2031 |
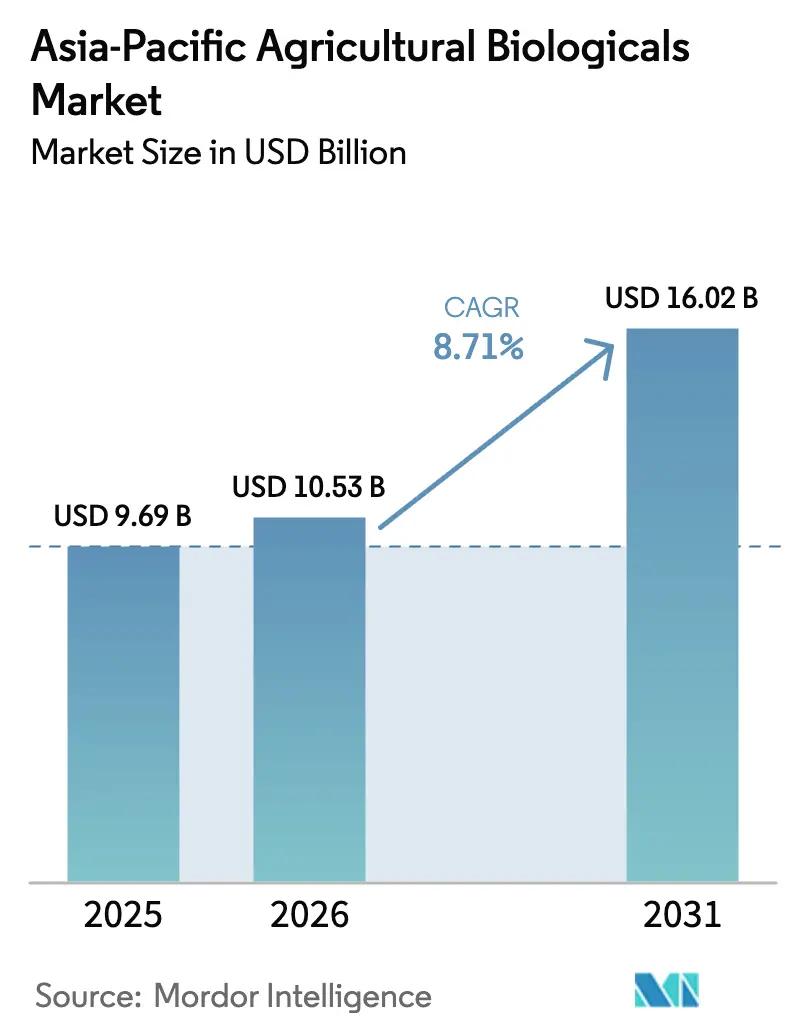
| Base Year Market Size (2025) | USD 9.69 Billion |
| Market Size (2026) | USD 10.53 Billion |
| Market Size (2031) | USD 16.02 Billion |
| Growth Rate (2026 - 2031) | 8.71% CAGR |
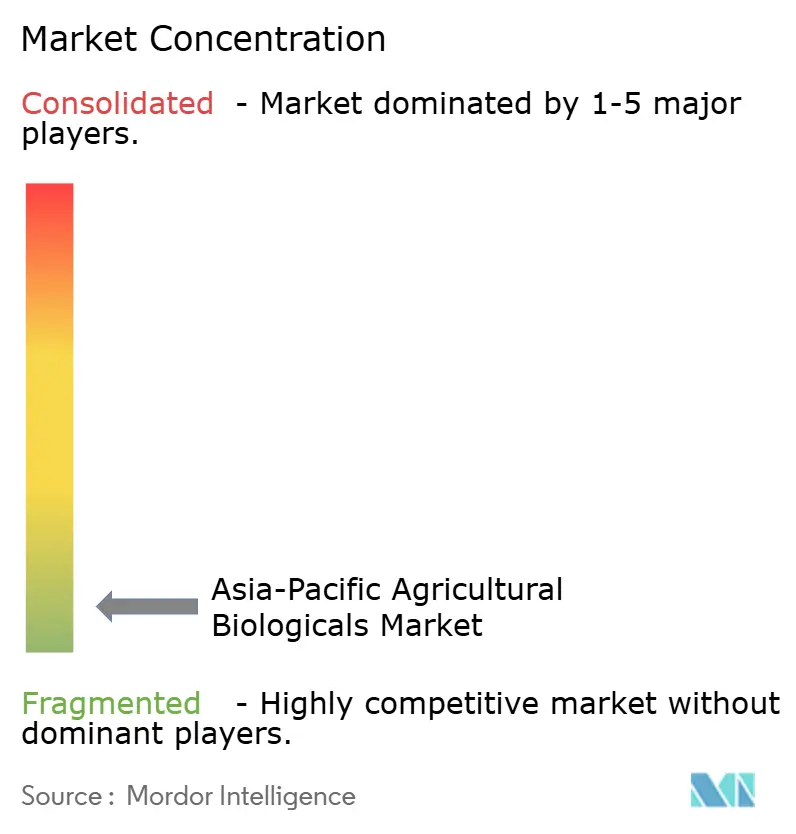
| Market Concentration | Low |
Major Players *Disclaimer: Major Players sorted in no particular order Image © Mordor Intelligence. Reuse requires attribution under CC BY 4.0. | |
Asia-Pacific Agricultural Biologicals Market Analysis by Mordor Intelligence
The Asia-Pacific agricultural biologicals market size in 2026 is estimated at USD 10.53 billion, growing from 2025 value of USD 9.69 billion with 2031 projections showing USD 16.02 billion, growing at 8.71% CAGR over 2026-2031. This expansion reflects tighter regional rules on chemical residues, rising subsidy support for carbon-balanced farming, and the decision by large input suppliers to mainstream biological products in their core portfolios. Growing venture funding for microbial consortia, paired with innovation clusters in Japan and South Korea that refine ocean-derived biostimulants, further widens adoption channels. Consolidation among incumbents remains moderate, allowing new entrants to capture technology gaps such as salt-tolerant strains for coastal soils and shelf-stable inoculants for humid supply chains. Region-wide, farmer demand keeps climbing as export markets tighten maximum residue limits, enabling biological inputs to command premium pricing in fruit, vegetable, cotton, and sugar value chains. [1]Source: Ministry of Agriculture and Rural Affairs, “National Action Plan for Zero Growth in Fertilizer Use,” MOA.GOV.CN
Key Report Takeaways
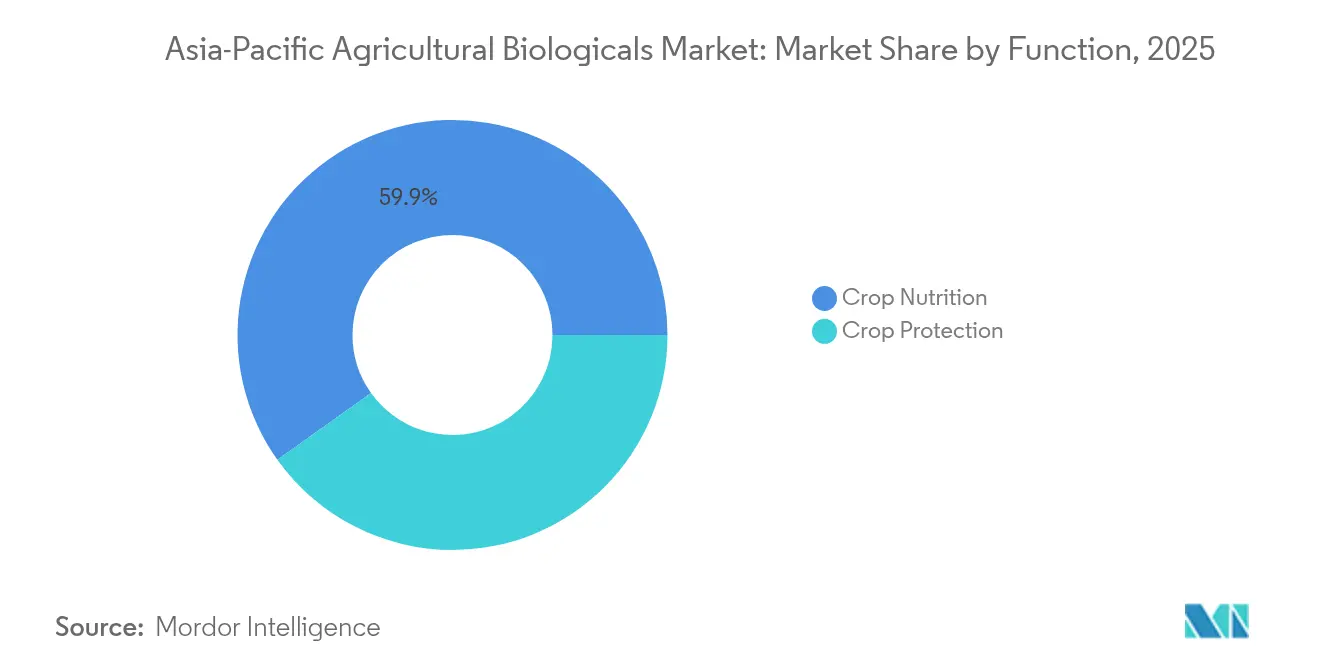
- By function, crop nutrition led with 59.85% of the Asia-Pacific agricultural biologicals market share in 2025, and registered the fastest growing segment with a CAGR of 9.54% to 2031.
- By crop type, row crops accounted for 80.05% share of the Asia-Pacific agricultural biologicals market size in 2025, and horticultural crops are advancing at a 8.98% CAGR through 2031.
- By geography, China captured 50.92% of Asia-Pacific agricultural biologicals market share in 2025, while Australia is forecast to expand at 10.11% CAGR between 2026-2031.
Note: Market size and forecast figures in this report are generated using Mordor Intelligence’s proprietary estimation framework, updated with the latest available data and insights as of 2026.
Asia-Pacific Agricultural Biologicals Market Trends and Insights
Drivers Impact Analysis*
| Driver | (~) % Impact on CAGR Forecast | Geographic Relevance | Impact Timeline |
|---|---|---|---|
| Stricter residue limits and pesticide withdrawals | +2.1% | Australia, Japan, South Korea | Medium term (2-4 years) |
| Conversion of idle rice paddies to organic systems | +1.8% | Thailand, Vietnam, Philippines | Long term (≥ 4 years) |
| Mainstream adoption of bio-solutions by multinational input suppliers | +1.5% | China, India, Australia | Short term (≤ 2 years) |
| Government subsidy realignment toward carbon-balanced farming | +1.3% | Core Asia-Pacific economies | Medium term (2-4 years) |
| Venture funding for salt-tolerant microbial consortia | +0.9% | Coastal India, China, Indonesia | Long term (≥ 4 years) |
| Ocean-derived biostimulant innovation in Japan and South Korea | +0.6% | Japan and South Korea | Medium term (2-4 years) |
| Source: Mordor Intelligence | |||
Stricter Residue Limits And Pesticide Withdrawals
Japan enforced zero-tolerance for 165 pesticide molecules in imported foods starting January 2024, forcing exporters to shift toward residue-free protocols. Australia canceled registrations for 23 persistent pesticide formulations in 2024, echoing similar curbs in China that tightened pre-harvest intervals for 47 chemistries. South Korea’s Clean Agriculture 2030 program targets a 40% cut in chemical pesticide use by subsidizing biological alternatives. Together, these steps push growers toward biocontrol agents, biofungicides, and seaweed-based stimulants to retain export access and domestic consumer trust. [2]Source: Rural Development Administration, “Clean Agriculture 2030,” RDA.GO.KR
Conversion Of Idle Rice Paddies To Organic Systems
Thailand allocated THB 2.4 billion (USD 67 million) in 2024 to bring 180,000 hectares of set-aside rice land under certified organic cultivation. Vietnam is replicating cluster models across the Mekong Delta, while the Philippines’ Organic Rice Flagship Program targets 50,000 hectares by 2026. Indonesia’s Go Organic 2030 offers tax breaks and preferential loans, enabling scale for biological inputs such as nitrogen-fixing inoculants tailor-made for rice systems. These initiatives hard-wire long-run demand across fertilizer, biostimulant, and biopesticide categories.
Mainstream Adoption Of Bio-solutions By Multinational Input Suppliers
Bayer earmarked USD 2.8 billion for biological R&D hubs in Asia-Pacific after 2024, whereas BASF opened its Biological Solutions Hub in Singapore, focusing on tropical crops. Syngenta is set to invest USD 230 million in a new R&D center in Nanjing, emphasizing biologicals, digitalization, and big data. UPL acquired three niche bio firms in India and Indonesia, accelerating market penetration. These moves integrate biological lines into legacy distribution, boosting farmer confidence and accelerating product lifecycles.
Government Subsidy Realignment Toward Carbon-Balanced Farming
India allotted INR 6,400 crore (USD 768 million) to promote bio inputs under the National Mission for Sustainable Agriculture. Australia’s Carbon Farming Initiative channels AUD 300 million (USD 195 million) toward soil-carbon projects that prove sequestration via biological amendments. Tax rebates in China and a JPY 50 billion (USD 335 million) support plan in Japan further lower adoption costs, anchoring demand across row-crop landscapes.
Restraints Impact Analysis*
| Restraint | (~) % Impact on CAGR Forecast | Geographic Relevance | Impact Timeline |
|---|---|---|---|
| Fragmented regional standards delaying mutual recognition | -1.4% | Asia Pacific core | Medium term (2-4 years) |
| Limited shelf life of live bio-inputs in humid supply chains | -1.1% | Coastal Southeast Asia, India | Short term (≤ 2 years) |
| Traceability gaps for bulk manure exports | -0.8% | Australia and New Zealand | Long term (≥ 4 years) |
| Shortage of fermentation-grade molasses after ethanol blending mandates | -0.6% | India, Thailand, Philippines | Medium term (2-4 years) |
| Source: Mordor Intelligence | |||
Fragmented Regional Standards Delaying Mutual Recognition
Regulatory harmonization challenges persist across Asia-Pacific markets, with those countries maintaining distinct registration requirements that delay product launches and increase compliance costs for biological manufacturers. Thailand's Department of Agriculture requires separate efficacy trials for each biological strain, while Malaysia's Pesticide Board demands country-specific toxicology studies even for internationally approved microbial products. Indonesia's Ministry of Agriculture introduced new labeling requirements for biological inputs in 2024, creating additional regulatory hurdles for companies seeking regional market access. The Philippines Bureau of Plant Industry maintains a separate approval pathway for biological pesticides that can extend registration timelines by 18-24 months compared to OECD countries. These fragmented standards force companies to navigate multiple regulatory frameworks simultaneously, increasing market entry costs and delaying innovative product availability to farmers who could benefit from advanced biological solutions.
Limited Shelf Life Of Live Bio-inputs In Humid Supply Chains
Tropical climate conditions across Southeast Asia pose significant challenges for biological product viability, with high humidity and temperature fluctuations reducing microbial inoculant effectiveness by 30-40% during distribution and storage. Cold chain infrastructure limitations in rural areas of Indonesia, Philippines, and Vietnam compromise product quality, particularly for temperature-sensitive bacterial and fungal formulations that require consistent refrigeration. Packaging innovations have emerged as critical solutions, with companies developing moisture-resistant containers and desiccant systems to extend product shelf-life in humid environments. Research institutions across the region are collaborating on stabilization technologies, including encapsulation methods and carrier materials that protect live microorganisms during transport and storage, while maintaining biological activity under challenging tropical conditions.
*Our forecasts treat driver/restraint impacts as directional, not additive. The impact forecasts reflect baseline growth, mix effects, and variable interactions.
Segment Analysis
By Function: Crop Nutrition Drive Soil and Crop Resilience
The Crop Nutrition segment dominates the Asia-Pacific agricultural biologicals market, accounting for approximately 59.85% of the total market value in 2025 and also registered the fastest CAGR of 9.54% through 2031. This segment's dominance is primarily driven by the widespread adoption of organic fertilizers. The segment's strong position is supported by major agricultural countries in the region, such as China and India, which have adopted organic farming strategies and launched various initiatives to encourage organic farming and sustainable agricultural inputs.
Crop protection biologicals round out the portfolio, where microbial biocontrol agents such as Bacillus subtilis and Trichoderma harzianum scale through Koppert and local contract manufacturers. Suppliers harness precision fermentation to reach commercial titers, lowering cost per colony forming unit and enabling competitive price parity with synthetic actives in specific crops.


By Crop Type: High-Value Applications Accelerate Adoption
Row crops dominate the Asia-Pacific agricultural biologicals market, accounting for approximately 80.05% of the total market value in 2025, while horticulture leads future momentum with a 8.98% CAGR to 2031. The segment's dominance can be attributed to its extensive organic cultivation area, which accounts for approximately 68% of all organic cropland in the region. The major row crops produced include rice, wheat, corn, and barley.
Horticulture grows as urban consumers in China, Japan, and South Korea demand food safety assurances. The Asia-Pacific agricultural biologicals market size associated with horticultural inputs is on track, anchored by greenhouse tomatoes, berries, and leafy greens. The segment's growth is further supported by the premium pricing of organic fruits and vegetables, which fetch 10-15% higher prices in both domestic and international markets.
Cash crops play a pivotal role. This segment includes staples such as cotton, tea, coffee, sugarcane, tobacco, cocoa, and rubber. The rising global appetite for organic cash crops, especially organic tea, bolsters this segment. Notably, China and India stand out as the foremost producers of organic green and black tea, respectively.

Geography Analysis
China dominates the Asia-Pacific agricultural biologicals landscape, driven by its extensive organic farming practices and supportive government policies. The country holds approximately 50.92% market share in 2025, reflecting its position as the region's powerhouse in biological agriculture solutions. The government's Green Food System Strategy has been instrumental in promoting the adoption of biological alternatives, particularly in reducing chemical pesticide usage in various crops. The country's focus on sustainable agriculture has led to increased investment in research and development of biological solutions, including biopesticides, biofertilizers, and biostimulants.
India ranks second, buoyed by USD 768 million in subsidy allocations that cut bio input purchase prices, widening accessibility for smallholders. Pilot projects under the Indian Council of Agricultural Research showcase 7-11% yield gains in rice and wheat when 25% of urea is replaced by Azotobacter and phosphate solubilizing bacteria. Rural cooperatives bundle biologicals with micro-credit services, gradually integrating them into seasonal input packages.
Australia posts the fastest 10.11% CAGR through 2031 under strict residue rules that align with European Union benchmarks. Carbon credit protocols allow broadacre cereal and livestock farmers to monetize soil organic carbon increases achieved through compost and microbial inoculants, creating a financial stack that offsets adoption costs. Japan and South Korea focus on premium greenhouse and open-field horticulture. Southeast Asia features Thailand, Vietnam, and Indonesia accelerating amid organic rice conversion programs. The Philippines supplements demand through investment incentives that lower setup costs for biofertilizer plants.
Competitive Landscape
Market concentration stays low, with the top five suppliers holding 2.35% of Asia-Pacific agricultural biologicals market share. Regional fertilizer giants Gujarat State Fertilizers and Chemicals Limited and Coromandel International Limited leverage farmer trust and retail footprints to introduce branded bio lines. Koppert Biological Systems specializes in high-value biocontrol agents and operates new tropical crop facilities after acquiring Thai firm Green Earth Agro in 2024.
Multinationals forge research partnerships with public institutes to tailor microbial strains to local soils and climate patterns. Bayer’s Biological Innovation Center in Singapore and BASF’s incubation lab collaborate with universities on formulation stability, supporting rapid field validation. Venture capital flows primarily to startups that harness artificial intelligence for strain discovery, encapsulation, and rapid assay platforms.
Patent activity climbed 40% from 2024 to 2025, underscoring a race for proprietary fermentation processes, micro-encapsulation, and ocean-algae extraction. Suppliers differentiate by offering bundled advisory apps that quantify nutrient savings and carbon sequestration, building digital moats around physical products. The Asia-Pacific agricultural biologicals industry thus rewards firms with multi-pronged capabilities spanning formulation science, regulatory navigation, and precision agronomy services.[3]Source: Gujarat State Fertilizers and Chemicals Limited, “Annual Report 2024,” GSFCLIMITED.COM
Asia-Pacific Agricultural Biologicals Industry Leaders
Biolchim SpA
Coromandel International Ltd
Gujarat State Fertilizers & Chemicals Ltd
Indian Farmers Fertiliser Cooperative Limited
Koppert Biological Systems Inc.
- *Disclaimer: Major Players sorted in no particular order

Recent Industry Developments
- May 2025: Syngenta opened a major biologicals production facility in Orangeburg, South Carolina. This facility joins Syngenta's global network, which includes sites in Brazil, Italy, India, and Norway. It is set to produce 16,000 tons of biostimulants each year, bolstering Syngenta's capacity and addressing the rising demand for sustainable agricultural solutions.
- September 2023: Koppert and PI Industries Ltd. (PI) forged a strategic alliance, setting their sights on revolutionizing agricultural biologicals in India. This partnership seeks to harness the strengths of both firms, rolling out advanced solutions to protect crops, enrich soil, and offer sustainable choices to Indian farmers.
- August 2023: FMC India has unveiled ENTAZIA, a biofungicide harnessing the power of Bacillus subtilis, a beneficial bacterium, to combat bacterial leaf blight in rice. This eco-friendly solution bolsters the plant's innate defenses and nurtures a robust microbiome, shielding it from pathogens and enhancing its resilience.


Asia-Pacific Agricultural Biologicals Market Report Scope
| Crop Nutrition | Biofertilizer | Azospirillum |
| Azotobacter | ||
| Mycorrhiza | ||
| Phosphate Solubilizing Bacteria | ||
| Rhizobium | ||
| Other Biofertilizers | ||
| Biostimulants | Amino Acids | |
| Fulvic Acid | ||
| Humic Acid | ||
| Protein Hydrolysates | ||
| Seaweed Extracts | ||
| Other Biostimulants | ||
| Organic Fertilizer | Manure | |
| Meal Based Fertilizers | ||
| Oilcakes | ||
| Other Organic Fertilizers | ||
| Crop Protection | Biocontrol Agents | Macrobials |
| Microbials | ||
| Biopesticides | Biofungicides | |
| Bioherbicides | ||
| Bioinsecticides | ||
| Other Biopesticides | ||
| Cash Crops |
| Horticultural Crops |
| Row Crops |
| China |
| India |
| Japan |
| Australia |
| Vietnam |
| Thailand |
| Indonesia |
| Philippines |
| Rest of Asia-Pacific |
| Function | Crop Nutrition | Biofertilizer | Azospirillum |
| Azotobacter | |||
| Mycorrhiza | |||
| Phosphate Solubilizing Bacteria | |||
| Rhizobium | |||
| Other Biofertilizers | |||
| Biostimulants | Amino Acids | ||
| Fulvic Acid | |||
| Humic Acid | |||
| Protein Hydrolysates | |||
| Seaweed Extracts | |||
| Other Biostimulants | |||
| Organic Fertilizer | Manure | ||
| Meal Based Fertilizers | |||
| Oilcakes | |||
| Other Organic Fertilizers | |||
| Crop Protection | Biocontrol Agents | Macrobials | |
| Microbials | |||
| Biopesticides | Biofungicides | ||
| Bioherbicides | |||
| Bioinsecticides | |||
| Other Biopesticides | |||
| Crop Type | Cash Crops | ||
| Horticultural Crops | |||
| Row Crops | |||
| Country | China | ||
| India | |||
| Japan | |||
| Australia | |||
| Vietnam | |||
| Thailand | |||
| Indonesia | |||
| Philippines | |||
| Rest of Asia-Pacific | |||


Market Definition
- AVERAGE DOSAGE RATE - The average application rate is the average volume of agricultural biologicals applied per hectare of farmland in the respective region/country.
- CROP TYPE - Crop type includes Row crops (Cereals, Pulses, Oilseeds), Horticultural Crops (Fruits and vegetables) and Cash Crops (Plantation Crops, Fibre Crops and Other Industrial Crops)
- FUNCTION - Agricultural biological products provide crops with essential nutrients, prevent or control abiotic & biotic stresses, and enhance soil quality.
- TYPE - The Crop Nutrition function of agricultural biologicals includes organic fertilizer and Biofertilizer, whereas the Crop Protection function includes Biostimulants, Biopesticides and Biocontrol Agents.
| Keyword | Definition |
|---|---|
| Cash Crops | Cash crops are non-consumable crops sold as a whole or part of the crop to manufacture end-products to make a profit. |
| Integrated Pest Management (IPM) | IPM is an environment-friendly and sustainable approach to control pests in various crops. It involves a combination of methods, including biological controls, cultural practices, and selective use of pesticides. |
| Bacterial biocontrol agents | Bacteria used to control pests and diseases in crops. They work by producing toxins harmful to the target pests or competing with them for nutrients and space in the growing environment. Some examples of commonly used bacterial biocontrol agents include Bacillus thuringiensis (Bt), Pseudomonas fluorescens, and Streptomyces spp. |
| Plant Protection Product (PPP) | A plant protection product is a formulation applied to crops to protect from pests, such as weeds, diseases, or insects. They contain one or more active substances with other co-formulants such as solvents, carriers, inert material, wetting agents or adjuvants formulated to give optimum product efficacy. |
| Pathogen | A pathogen is an organism causing disease to its host, with the severity of the disease symptoms. |
| Parasitoids | Parasitoids are insects that lay their eggs on or within the host insect, with their larvae feeding on the host insect. In agriculture, parasitoids can be used as a form of biological pest control, as they help to control pest damage to crops and decrease the need for chemical pesticides. |
| Entomopathogenic Nematodes (EPN) | Entomopathogenic nematodes are parasitic roundworms that infect and kill pests by releasing bacteria from their gut. Entomopathogenic nematodes are a form of biocontrol agents used in agriculture. |
| Vesicular-arbuscular mycorrhiza (VAM) | VAM fungi are mycorrhizal species of fungus. They live in the roots of different higher-order plants. They develop a symbiotic relationship with the plants in the roots of these plants. |
| Fungal biocontrol agents | Fungal biocontrol agents are the beneficial fungi that control plant pests and diseases. They are an alternative to chemical pesticides. They infect and kill the pests or compete with pathogenic fungi for nutrients and space. |
| Biofertilizers | Biofertilizers contain beneficial microorganisms that enhance soil fertility and promote plant growth. |
| Biopesticides | Biopesticides are natural/bio-based compounds used to manage agricultural pests using specific biological effects. |
| Predators | Predators in agriculture are the organisms that feed on pests and help control pest damage to the crops. Some common predator species used in agriculture include ladybugs, lacewings, and predatory mites. |
| Biocontrol agents | Biocontrol agents are living organisms used to control pests and diseases in agriculture. They are alternatives to chemical pesticides and are known for their lesser impact on the environment and human health. |
| Organic Fertilizers | Organic fertilizer is composed of animal or vegetable matter used alone or in combination with one or more non-synthetically derived elements or compounds used for soil fertility and plant growth. |
| Protein hydrolysates (PHs) | Protein hydrolysate-based biostimulants contain free amino acids, oligopeptides, and polypeptides produced by enzymatic or chemical hydrolysis of proteins, primarily from vegetal or animal sources. |
| Biostimulants/Plant Growth Regulators (PGR) | Biostimulants/Plant Growth Regulators (PGR) are substances derived from natural resources to enhance plant growth and health by stimulating plant processes (metabolism). |
| Soil Amendments | Soil Amendments are substances applied to soil that improve soil health, such as soil fertility and soil structure. |
| Seaweed Extract | Seaweed extracts are rich in micro and macronutrients, proteins, polysaccharides, polyphenols, phytohormones, and osmolytes. These substances boost seed germination and crop establishment, total plant growth and productivity. |
| Compounds related to biocontrol and/or promoting growth (CRBPG) | Compounds related to biocontrol or promoting growth (CRBPG) are the ability of a bacteria to produce compounds for phytopathogen biocontrol and plant growth promotion. |
| Symbiotic Nitrogen-Fixing Bacteria | Symbiotic nitrogen-fixing bacteria such as Rhizobium obtain food and shelter from the host, and in return, they help by providing fixed nitrogen to the plants. |
| Nitrogen Fixation | Nitrogen fixation is a chemical process in soil which converts molecular nitrogen into ammonia or related nitrogenous compounds. |
| ARS (Agricultural Research Service) | ARS is the U.S. Department of Agriculture's chief scientific in-house research agency. It aims to find solutions to agricultural problems faced by the farmers in the country. |
| Phytosanitary Regulations | Phytosanitary regulations imposed by the respective government bodies check or prohibit the importation and marketing of certain insects, plant species, or products of these plants to prevent the introduction or spread of new plant pests or pathogens. |
| Ectomycorrhizae (ECM) | Ectomycorrhiza (ECM) is a symbiotic interaction of fungi with the feeder roots of higher plants in which both the plant and the fungi benefit through the association for survival. |


Research Methodology
Mordor Intelligence follows a four-step methodology in all our reports.
- Step-1: Identify Key Variables: In order to build a robust forecasting methodology, the variables and factors identified in Step-1 are tested against available historical market numbers. Through an iterative process, the variables required for market forecast are set and the model is built on the basis of these variables.
- Step-2: Build a Market Model: Market-size estimations for the forecast years are in nominal terms. Inflation is not a part of the pricing, and the average selling price (ASP) is kept constant throughout the forecast period.
- Step-3: Validate and Finalize: In this important step, all market numbers, variables and analyst calls are validated through an extensive network of primary research experts from the market studied. The respondents are selected across levels and functions to generate a holistic picture of the market studied.
- Step-4: Research Outputs: Syndicated Reports, Custom Consulting Assignments, Databases & Subscription Platforms.


