
Market Overview
| Study Period | 2020 - 2031 |
|---|---|
| Forecast Data Period | 2026 - 2031 |
| Base Year Market Size (2025) | USD 0.35 Billion |
| Market Size (2026) | USD 0.39 Billion |
| Market Size (2031) | USD 0.65 Billion |
| Growth Rate (2026 - 2031) | 10.82 % |
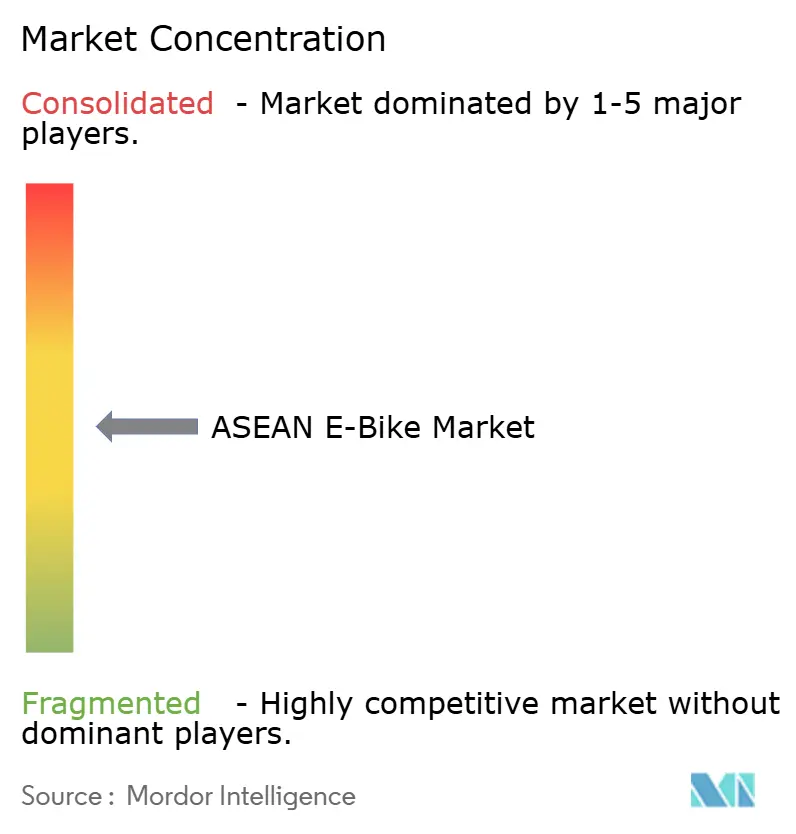
| Market Concentration | Medium |
Major Players *Disclaimer: Major Players sorted in no particular order Image © Mordor Intelligence. Reuse requires attribution under CC BY 4.0. | |
ASEAN E-Bike Market Analysis by Mordor Intelligence
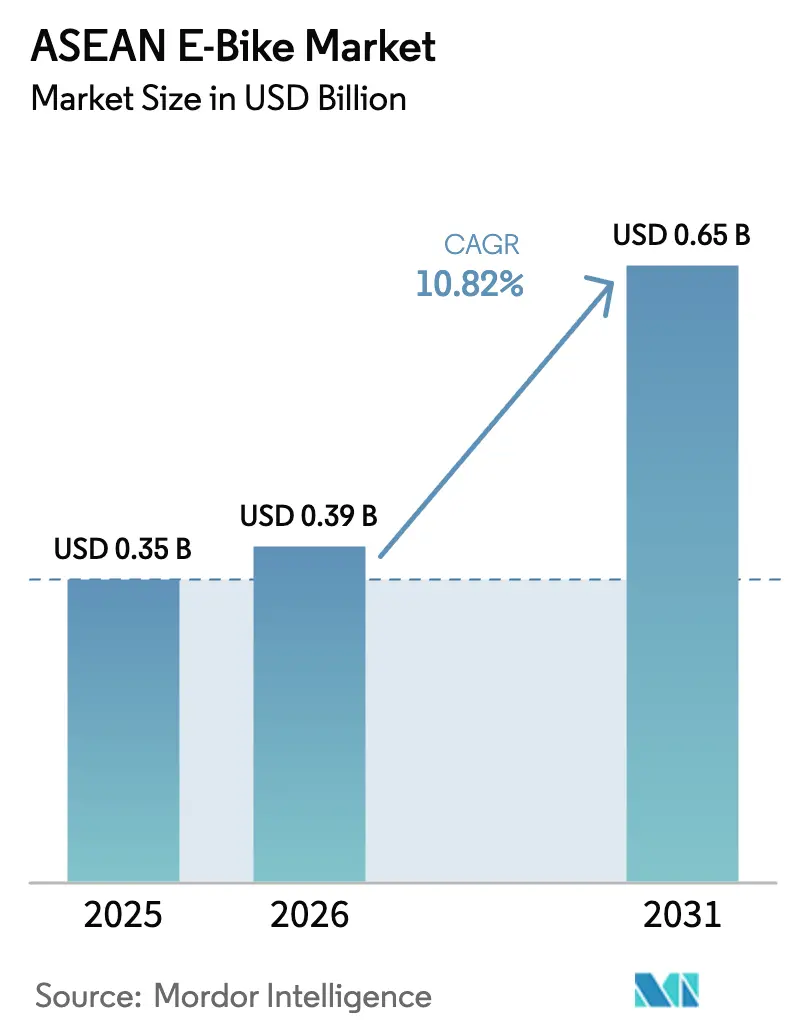
Asean e-bike market size in 2026 is estimated at USD 0.39 billion, growing from 2025 value of USD 0.35 billion with 2031 projections showing USD 0.65 billion, growing at 10.82% CAGR over 2026-2031. Rapid switching from internal-combustion two-wheelers to battery power is accelerating as urban policies tighten emissions, consumer awareness of operating costs improves, and local supply chains scale up. Subsidy programs in Vietnam, Indonesia, and Thailand are anchoring early adoption, while corporate fleet electrification and higher battery energy density further reinforce demand. Competition remains dispersed because legacy bicycle brands, pure-play electric start-ups, and motorcycle OEMs all vie for share, yet the growing availability of under-USD 1,000 models keeps volumes rising in price-sensitive cities. Infrastructure gaps still temper progress, but pilot solar-powered swap stations and informal charging points are reducing range anxiety and widening the Asean e-bike market’s addressable base.
Key Report Takeaways
- By propulsion type, pedal-assisted models held 62.60% of the ASEAN e-bike market share in 2025, whereas dual-mode hybrids are forecast to post a 12.20% CAGR through 2031.
- By motor type, hub drives commanded an 81.90% of the ASEAN e-bike market share in 2025, while mid-drive systems are set to climb at a 12.60% CAGR to 2031.
- By battery chemistry, lithium-ion captured 90.10% of the ASEAN e-bike market share in 2025, and is projected to grow fastest at an 11.20% CAGR during 2026-2031.
- By application, city commuting captured 54.80% of the ASEAN e-bike market share in 2025, and fleet delivery is projected to grow at a 12.90% CAGR during 2026-2031.
- By price band, models below USD 1,000 accounted for 65.70% of the ASEAN e-bike market share in 2025, and the USD 1,000-2,000 tier should rise at 11.40% CAGR to 2031.
- By country, Vietnam controlled 28.70% of the ASEAN e-bike market share in 2025, whereas the Philippines is anticipated to expand at a 11.80% CAGR through 2031.
Note: Market size and forecast figures in this report are generated using Mordor Intelligence’s proprietary estimation framework, updated with the latest available data and insights as of 2026.
Market Trends and Insights
Drivers Impact Analysis of ASEAN E-Bike Market*
| Driver | (~) % Impact on CAGR Forecast | Geographic Relevance | Impact Timeline |
|---|---|---|---|
| Government E-Mobility Incentives | +2.8% | Vietnam, Indonesia, Thailand core; expanding to Malaysia and the Philippines | Short term (≤ 2 years) |
| Corporate E-Bike Fleet Expansion | +2.1% | Urban centers in Vietnam, Indonesia, Thailand, Singapore | Medium term (2-4 years) |
| Urban Congestion and Vehicle Restrictions | +1.9% | Jakarta, Bangkok, Manila, Hanoi, Ho Chi Minh City | Medium term (2-4 years) |
| Rising Battery Energy Density | +1.7% | Strongest in Vietnam, Thailand | Long term (≥ 4 years) |
| Tourism Micro-Mobility Schemes | +1.2% | Bali, Phuket, Langkawi, Boracay | Short term (≤ 2 years) |
| Solar-Powered Swap Station Pilots | +0.8% | Secondary urban centers, pilots in Vietnam and Thailand | Long term (≥ 4 years) |
| Source: Mordor Intelligence | |||
Government E-Mobility Incentives and Purchase Subsidies
Fiscal support is accelerating shifts from gasoline motorcycles to electric options. Vietnam’s 0% registration tax and public-charger rollout underpinned notable sales in H1 2025, ranking the country third worldwide [1]. Indonesia moved from a significant cash grant to a VAT discount in 2025, yet still lifted subsidized volumes in 2024. Thailand’s BEV 3.5 plan combines duty relief and local-content bonuses, and Malaysia plus the Philippines are drafting parallel packages. These converging measures send reliable demand signals that justify tooling investments and raise the Asean e-bike market’s medium-term visibility.
Expansion of Corporate E-Bike Fleets for Last-Mile Logistics
B2B buyers are electrifying two-wheeler fleets to cut fuel costs and comply with low-emission-zone rules. Vietnam’s ride-hailing decree obliges 400,000 motorcycles to switch by 2029. Indonesian couriers in Jakarta and Surabaya report significant operating cost savings after adopting e-bikes, prompting multi-year procurement contracts. Fleet operators value battery-swap compatibility, heavy-duty frames, and extended warranties, creating design niches that favor commercial-grade platforms and lock in repeat orders for the Asean e-bike market.
Urban Congestion Pricing and ICE-Vehicle Restrictions
City authorities are converting policy intent into enforceable bans. Hanoi will exclude gasoline motorcycles inside Ring Road 1 from July 2026 and expand coverage to Rings 2 and 3 by 2030. Ho Chi Minh City blocks new gasoline motorcycles for ride-hailing from 2026, instantly diverting demand toward compliant e-bikes [2]. Jakarta’s odd-even plate limits and Bangkok’s congestion-pricing draft underline a Southeast-Asian shift in which electric propulsion becomes a prerequisite for inner-city access, reinforcing the uptake curve of the Asean e-bike market.
Rising Battery Energy Density Lowering Total Cost of Ownership
Higher-density lithium-ion packs extend range yet trim weight, boosting user acceptance in stop-and-go traffic. Vertically integrated Chinese majors supply lower-cost modules while unveiling sodium-ion prototypes that resist tropical heat and charge faster. Declining battery prices tilt five-year total-cost-of-ownership models in favor of electric, especially where gasoline tops USD 1.10 per liter, sustaining long-run gains for the Asean e-bike market.
Restraints Impact Analysis of ASEAN E-Bike Market*
| Restraint | (~) % Impact on CAGR Forecast | Geographic Relevance | Impact Timeline |
|---|---|---|---|
| Limited Charging and Swapping Infrastructure | −1.8% | Rural and secondary urban areas across ASEAN | Medium term (2-4 years) |
| Popularity of Low-Priced ICE Scooters | −1.4% | Indonesia, Philippines, Vietnam rural areas | Short term (≤ 2 years) |
| Fragmented Homologation Standards in ASEAN | −0.9% | All member states | Long term (≥ 4 years) |
| Lithium-Ion Cell Import Tariffs | −0.7% | Thailand, Malaysia, Singapore, Philippines | Medium term (2-4 years) |
| Source: Mordor Intelligence | |||
Limited Public Charging/Swapping Infrastructure
Indonesia fielded only 3,772 public charging points as of March 2025, a notable share of its 2030 target [3]. Rural riders lack home garages, so range anxiety dampens uptake. Private investors hesitate until traffic justifies payback, prolonging the chicken-and-egg cycle that restricts rural penetration of the Asean e-bike market.
Popularity of Low-Priced ICE Scooters
Honda’s gasoline scooters still outsell electrics because extensive dealer networks reassure buyers. In Thailand, a Honda automatic costs more than a Yadea RS20 yet commands loyalty through perceived reliability. Until subsidies bridge purchase-price gaps, many first-time owners in Indonesia and the Philippines stay with fuel models, diluting total addressable volumes for the Asean e-bike market.
*Our forecasts treat driver/restraint impacts as directional, not additive. The impact forecasts reflect baseline growth, mix effects, and variable interactions.
ASEAN E-Bike Market Segment Analysis
By Propulsion Type:
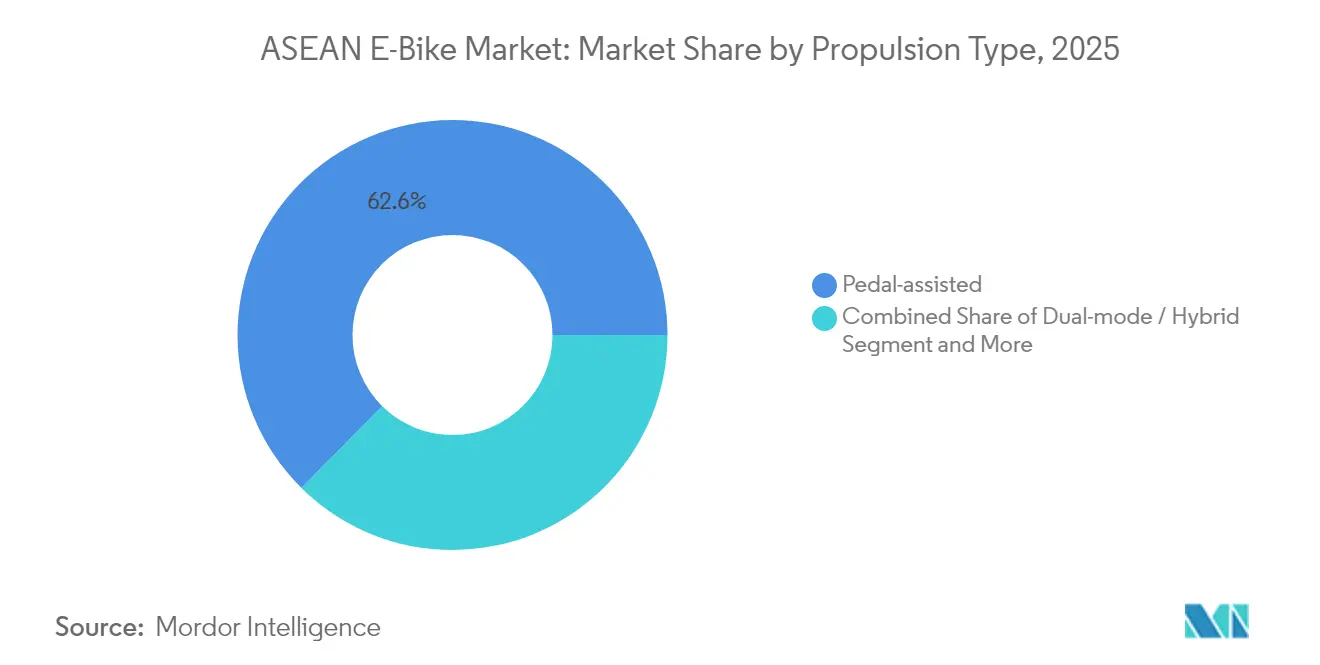
Pedal-Assisted Models Drive Mainstream AdoptionThe pedal-assist category represented 62.60% of the ASEAN e-bike market share in 2025 as consumers valued hybrid exercise and electric thrust. Dual-mode hybrids should log the top-line 12.20% CAGR through 2031, widening the ASEAN e-bike market by attracting riders who want throttle freedom on hills yet license-free status on cycle lanes. Regulatory flexibility, especially where pedal-assists qualify as bicycles, supports broad commuter acceptance.
Continuation of the same sub-heading adds that throttle-only variants hold niches in delivery services requiring constant stop-start bursts, while regulators in Vietnam may demand mirrors and turn signals for higher-speed classes. As model choice diversifies, manufacturers integrate smart controllers that toggle between human-power bias and full motor drive, increasing perceived value in the ASEAN e-bike market.

By Motor Type:
Hub Dominance Confronted by Rising Mid-Drive AppealHub motors owned 81.90% of the ASEAN e-bike market share in 2025 because they are cheap to produce, sealed against tropical rain, and simple to service. Yet the mid-drive slice is expanding at 12.60% CAGR as sport commuters and cargo couriers appreciate balanced weight and torque multiplication. Brands now market removable mid-drive powertrains that simplify fleet maintenance, hinting at a gradual technological pivot within the ASEAN e-bike market.
At the same time, friction-drive kits survive in retrofit circles where riders wish to electrify existing bicycles for under USD 300. Although marginal in volume, such kits introduce new users who could migrate to factory e-bikes, feeding future replacement cycles in the ASEAN e-bike market.
By Battery Chemistry:
Lithium-Ion Retains Overwhelming LeadLithium-ion packs covered 90.10% of the ASEAN e-bike market share in 2025 and are tracking an 11.20% CAGR. Higher watt-hour density extends per-charge range to 120 km on 1 kWh packs, sufficient for daily city trips. Sodium-ion prototypes may appear in 2027 models, promising better heat resilience and materially hedging lithium price swings, which could unlock fresh cost tiers for the ASEAN e-bike market.
Lead-acid options persist in cost-constrained rural districts but lose share as second-hand lithium units enter the resale channel. Improved recycling networks further tip buyer sentiment toward modern chemistries, cementing lithium-ion’s supremacy in the ASEAN e-bike market.
By Application:
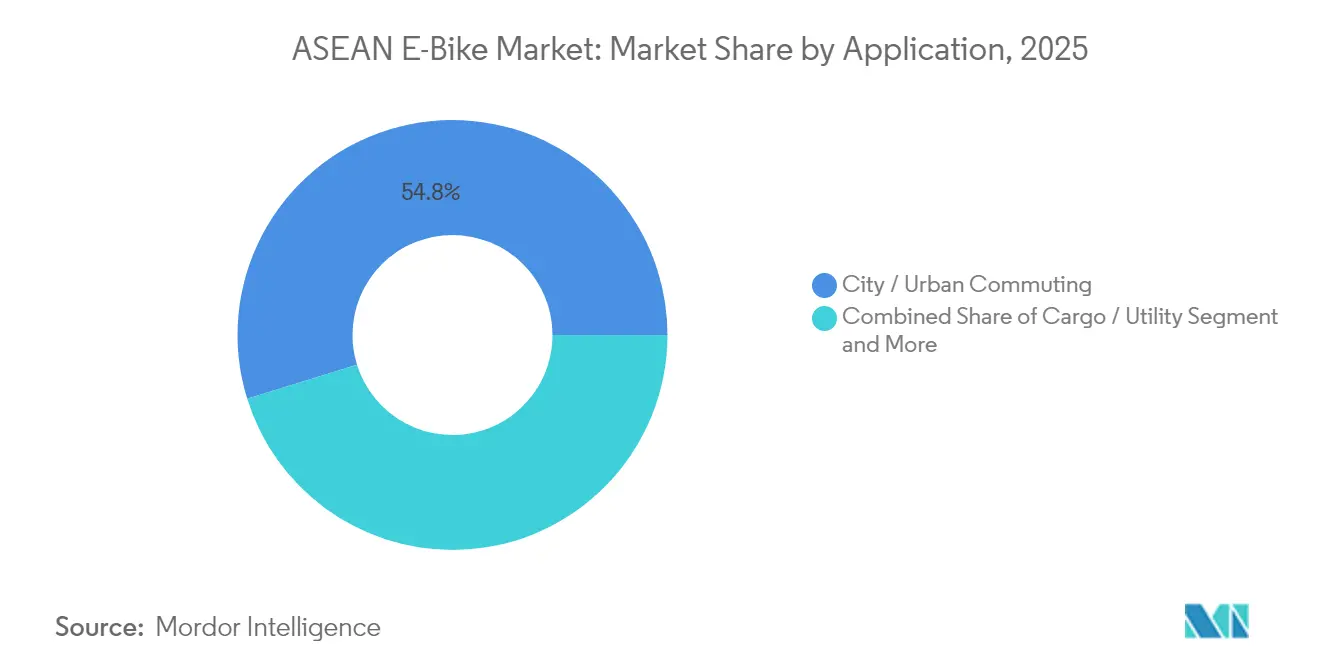
Commuting Dominates While Fleet Delivery SurgesUrban commuting soaked up 54.80% of the ASEAN e-bike market share in 2025 after cities launched low-emission corridors and secure parking hubs. Delivery and fleets, however, drive the fastest-growing tranche at 12.90% CAGR because riders cover 100-150 km daily and redeem cost savings within 18 months. Fleet feedback loops push suppliers to enlarge battery-swap compatibility, hastening iteration cycles in the ASEAN e-bike market.
Outdoor trekking and e-mountain segments revolve around Thailand’s Chiang Mai trail tourism and Vietnam’s Sơn La circuits, where mid-drives rule. Compact folding e-bikes facilitate first-mile transit to metro stations in Singapore, proving the modal versatility that broadens the user base and stabilizes unit demand for the ASEAN e-bike market.
By Price Band:
Sub-USD 1,000 Tier Anchors Volume, Mid-Tier ClimbsModels under USD 1,000 formed 65.70% of the ASEAN e-bike market share in 2025 as household incomes in Indonesia, Vietnam, and the Philippines guided budgets. Dealers bundle free helmets and first-year maintenance to attract first-time buyers, sustaining checkout momentum in the ASEAN e-bike market.
Mid-tier offerings between USD 1,000-2,000 are recording an 11.40% CAGR on the back of larger batteries, smartphone connectivity, and disc brakes. Premium units above USD 2,000 stay niche but spotlight innovation that eventually trickles down, reinforcing aspirational marketing within the ASEAN e-bike market.
Geography Analysis
Vietnam E-Bike Market
Vietnam’s 28.70% of the ASEAN e-bike market share in 2025 rested on coordinated incentives and burgeoning domestic output. Progressive exclusion of gasoline motorcycles inside Hanoi’s Ring Road 1 from 2026 and ride-hailing electrification in Ho Chi Minh City ensure sustained demand within the Asean e-bike market.
Indonesia E-Bike Market
Indonesia sits on the region’s deepest two-wheeler base. Subsidized electric purchases grew after the VAT-discount schema replaced cash grants. Jakarta’s aim 4.5 million by 2035 charts a towering runway, although charger deployment must accelerate to unlock the full promise for the Asean e-bike market.
ASEAN E-Bike Market
The Philippines advances fastest at 11.80% CAGR due to Urban Green Mobility guidelines that earmark e-bike lanes across Metro Manila. Thailand’s Samut Prakan plant started shipping in May 2025, targeting significant cumulative units within three years under BEV 3.5 support, while Malaysia and Singapore focus on high-spec categories with smart telematics, offering margin-rich niches that round out regional demand in the Asean e-bike market.
Regulatory Landscape
ASEAN does not yet have a uniform regulatory framework for electric two-wheelers, which leads to different licensing, type-approval, and operating rules across member states. The 2023 ASEAN Leaders Declaration on Developing a Regional EV Ecosystem and the 2024 ASEAN Guidelines for Light Electric Vehicles offer a harmonization reference for safety, charging interoperability, and end-of-life considerations, but implementation is still handled at the national level.
Thailand uses TISI certification for electric bicycles (for example, TIS 2495-2557), while Indonesia is moving toward higher domestic-content requirements for EVs (40% by 2027). Vietnam regulates electric two-wheelers through the Ministry of Transport, with early 2026 updates to safety classifications aimed at reducing ambiguity for manufacturers and fleets. At the country level, these differences shape compliance pathways and go-to-market decisions, with Vietnam and Indonesia setting clear regional divergence for suppliers and fleet operators.
Value Chain Analysis
The ASEAN e-bike value chain covers core inputs such as lithium-ion cells, cathode/anode materials, and electronics; component manufacturing for frames, hubs/mid-drives, controllers, and battery packs; assembly and testing; distribution through dealers and fleet procurement; and aftersales support, battery service, and end-of-life handling. Import dependence is highest in cells and some electronics, while localization increases where policy pushes domestic content and where major brands concentrate production.
Regional hub strategies are also changing supply flows. Yadea is regionalizing its manufacturing footprint to serve domestic demand and intra-ASEAN distribution, including a Karawang site that integrates R&D and production. On the downstream side, battery swapping and charging partnerships are becoming part of the commercial value chain, aligning with ASEAN priorities on interoperability and disposal frameworks.
Competitive Landscape
Moderate fragmentation prevails as no single brand exceeds a major region-wide volume. VinFast enjoys local dominance in Vietnam, but Chinese powerhouses Yadea and Tailg leverage a significant global scale to price aggressively in Indonesia and Thailand. Japanese motorcycle majors explore hybrid e-scooter launches, signaling next-wave rivalry inside the Asean e-bike market.
Localization strategies intensify: Yadea's commitment to a Vietnam plant and another line in Thailand to skirt tariffs and meet local-content rules. Dat Bike raises domestic supplier ratios for its Weaver++ model, trimming lead times and fortifying supply resilience. Battery-swap network specialists Mercu and Oyika form cross-country joint ventures that could morph into platform gatekeepers, shaping aftermarket economics across the Asean e-bike market.
Competitive advantages coalesce around vertically integrated battery packs, cybersecurity compliance, and telematics ecosystems that feed predictive maintenance. With UN R155 and R156 cybersecurity rules looming, manufacturers able to certify over-the-air update security may seize institutional fleet tenders, inching market concentration upward in the Asean e-bike market.
ASEAN E-Bike Industry Leaders
-
Yadea Technology Group Co. Ltd
-
Giant Manufacturing Co. Ltd
-
Yamaha Motor Co. Ltd
-
Trek Bicycle Corporation
-
Merida Industry Co. Ltd
- *Disclaimer: Major Players sorted in no particular order
ASEAN E-Bike Market Companies Covered in this Report
- Giant Manufacturing Co. Ltd
- Merida Industry Co. Ltd
- Trek Bicycle Corporation
- Yadea Technology Group Co. Ltd
- Yamaha Motor Co. Ltd
- Brompton Bicycle Ltd
- Gogoro Inc.
- VinFast Trading & Manufacturing JSC
- Aima Technology Group Co., Ltd
- Niu Technologies
- Phoenix Cycle Co. Ltd
- Qualisports Technology Co. Ltd
- Fuji-ta Bicycle Co. Ltd
- Tailing Electric Vehicle Co. Ltd
- Asama Vietnam Co. Ltd
Market Opportunities and Future Outlook
A practical opportunity is emerging at the overlap of urban access policy and fleet electrification. Hanoi plans to restrict gasoline motorcycles inside Ring Road 1 from July 2026, which should create near-term demand for electric two-wheelers suited to dense-city duty cycles, particularly models that can support swappable batteries, rugged frames, and longer warranty terms. This shift is also consistent with delivery and ride-hailing operators looking for commercial-grade e-bikes and service-led procurement.
Supply and manufacturing changes across ASEAN further widen the addressable opportunity. Thailand maintains CKD/SKD incentives for electric two-wheelers with zero import tariffs, and Yadea is expanding regional capacity with a Bac Ninh, Vietnam facility designed for 1 million units annually and a Karawang, Indonesia facility planned for operation in 2026 with a 3 million unit capacity. Vietnam also issued new classification guidelines for electric two-wheelers in early 2026 to resolve industry ambiguity and align with national standards.
Recent Industry Developments in ASEAN E-Bike Market
- May 2026: Yadea’s strong sales surge worldwide is pushing the shift toward green mobility. The rise in demand highlights how the ASEAN market remains exposed to global price and supply dynamics. It adds to competitive pressure and points to potential price-tone shifts across the ASEAN e-bike sector.
- March 2026: Yadea inaugurated a US$100 million manufacturing base in Vietnam to expand regional supply capabilities. Vietnam-based manufacturing supports ASEAN supply resilience. It also improves Yadea’s regional production footprint, which may help reduce ASEAN supply risks and tariff exposure.
- March 2026: Yadea highlighted its existing facility in Thailand's Samut Prakan Free Trade Zone and THB 4.5 billion R&D investment in 2025. This strengthens Thailand’s role as a regional hub for R&D and assembly. It reinforces Yadea’s localized content strategy and regional capability for the ASEAN market.
ASEAN E-Bike Market Report Scope and Research Methodology
Market Definition and Coverage
For this study, the ASEAN e-bike market is defined as revenue generated from sales of electric bicycles across ASEAN countries, counted at the point of sale and expressed in USD, for the stated time period.
Scope exclusions: This sizing excludes electric scooters and electric motorcycles that are registered and sold as motor vehicles, along with aftermarket parts sold separately from complete e-bikes.
Segments Covered in This Report
- By Propulsion Type
- Pedal-assisted
- Throttle-assisted (Power-on-demand)
- Dual-mode / Hybrid
- By Motor Type
- Hub-motor
- Mid-drive
- Other motors (e.g., friction)
- By Battery Chemistry
- Lithium-ion
- Lead-acid
- By Application
- City / Urban Commuting
- Trekking / E-MTB
- Cargo / Utility
- Delivery and Fleet (Last-mile)
- Folding / Compact
- By Price Band
- Below USD 1,000
- USD 1,000 -2,000
- Above USD 2,000
- By Country
- Vietnam
- Indonesia
- Malaysia
- Thailand
- Singapore
- Philippines
- Rest of ASEAN
Data Sources, Market Sizing, and Validation
Desk Research
Desk research was used to set the base market structure and to anchor country level context before we moved into interviews. We relied on public, repeatable data points such as transport and road-safety statistics (where two-wheeler usage is reported), customs and trade data for bicycle and parts flows, and policy announcements on e-mobility rules and incentive direction.
We also referenced sources such as ASEAN and country transport agencies, national statistics offices, UN Comtrade, World Bank indicators, and IEA energy transition materials, alongside peer reviewed papers on micromobility adoption. To complement this, we reviewed company annual reports, investor presentations, reputable press, and selective paid subscriptions for company financials and news intelligence, plus shipment-level import and export tracking where it helped confirm direction. These examples are not exhaustive, and we checked many other public sources to collect data, validate assumptions, and clarify gaps.
Primary Interviews and Surveys
Primary work focused on validating what desk research cannot show cleanly, especially mix, pricing, and how demand is split between commute, delivery, and leisure use. We spoke with a balanced set of stakeholders such as assemblers and brand owners, battery and motor ecosystem participants, distributors and retailers, and fleet and institutional buyers across key ASEAN markets.
Inputs from these discussions were used to confirm average selling price bands, channel margins, import dependence versus local assembly, and the pace of regulatory enforcement, which then helped us tighten the final market model.
Distribution of primary research fieldwork respondents
| Company type | Respondent position |
|---|---|
| Top tier: 38% | CXOs: 15% |
| Mid tier: 45% | Functional/Unit leaders: 41% |
| Smaller Players: 17% | Managers: 44% |
Market-Sizing & Forecasting
Sizing started with a top-down demand pool build-up where country level bicycle usage signals, import and assembly direction, and adoption lift from e-mobility policies were translated into e-bike unit demand, which was then converted to value using realistic price bands. To keep the model grounded, we checked the totals with selective bottom-up approximations, such as distributor and retailer channel checks and sampled units times ASP for key markets, and then adjusted where the two views did not align.
A few practical inputs shaped the model, including the share of urban trips that are short distance, the availability of bike lanes and local restrictions on high speed e-bikes, the split between lead-acid and lithium-ion models (which changes pricing), typical wattage and range expectations for commuter use, and the proportion of sales happening through offline stores versus online. When we faced data gaps by country, we used proxy ratios from similar ASEAN markets and narrowed the range through interview feedback.
For forecasting, scenario analysis was used so the outlook could reflect different paths for incentives, enforcement, and battery cost movement, with the central case selected based on what experts described as most likely. The final forecast also accounted for replacement cycles and gradual premiumization in city markets, since those factors move value growth differently than unit growth alone.
Data Validation & Update Cycle
Totals were validated through cross-checks against independent signals, including trade flow direction, country policy timelines, and observed price bands from channel discussions. We flagged outliers when a country's implied units or implied ASP moved too far from what stakeholders described, and those points were revisited before sign-off.
Each estimate goes through multi-step internal review where assumptions, calculations, and sensitivity ranges are checked, followed by re-contact triggers when major gaps remain on pricing, mix, or policy enforcement. The report is refreshed annually, and interim updates are made when material events occur, such as policy shifts or abrupt pricing changes. Before delivery, a final analyst pass is completed so clients receive the most current view.
Mordor Intelligence's Asean E Bike Market Sizing Compared With Other Published Estimates
Published market values for ASEAN e-bikes can look far apart because studies may not be counting the same vehicle types, they may apply different price logic, or they may convert currencies using different timing. Some estimates also mix regional totals with selected country snapshots, which makes comparisons look straightforward even when the scope is not aligned.
The table shows a wide spread, and in Mordor Intelligence's model the value is limited to electric bicycles sold in ASEAN and it excludes electric scooters or motorcycles that are treated as registered motor vehicles, which prevents adjacent two-wheeler revenue from inflating the total. Differences also come from how price progression is handled, since some publishers hold a single ASP and others model a shift from lead-acid to lithium-ion, and from refresh cadence when new rules or import patterns change quickly.
Benchmark comparison
| Source | Market Size | Gaps in Research Methodology |
|---|---|---|
| Mordor Intelligence | USD 0.35 B (2025) | |
| Trade Journal A | USD 1.08 B (2024) | Uses an electric two-wheeler bucket for ASEAN and likely includes e-scooters and low-speed e-mopeds, so the addressable revenue base is wider than e-bikes only. The year and currency timing also differ, which can shift the converted USD value in a volatile pricing period. |
| Regional Consultancy B | USD 1.80 B (2026) | Appears to apply an aggressive adoption curve and premium ASP uplift across the region, with limited evidence of channel-level price bands by country. It also likely counts a broader product set beyond pedal-assist bicycles, which pushes the total above an e-bike-only definition. |
Seen together, these figures mainly separate based on what is counted as an e-bike versus a broader electric two-wheeler, and on how quickly prices are assumed to move upward. Our approach keeps the estimate traceable to clear demand indicators, realistic country pricing bands, and repeatable checks, which helps decision-makers compare markets and plan capacity with fewer hidden assumptions.
Key Questions Answered in the Report
How large will the Asean E-Bike sector be by 2031?
The Asean E-Bike market size is projected to reach USD 0.65 billion by 2031, rising from USD 0.35 billion in 2025 at an 10.82% CAGR.
Which propulsion format leads sales today?
Pedal-assisted e-bikes held 62.60% of 2025 shipments, well ahead of throttle-only and hybrid variants.
Which country currently buys the most electric bicycles in Southeast Asia?
Vietnam commanded 28.70% share in 2025, supported by zero-tax incentives and domestic production.
Where is demand growing fastest in the region?
The Philippines shows the quickest expansion, forecast at a 11.80% CAGR through 2031 as Metro Manila pursues green-mobility lanes.