Armenia Telecom MNO Market Size and Share
Market Overview
| Study Period | 2019 - 2030 |
|---|---|
| Forecast Data Period | 2025 - 2030 |
| Historical Data Period | 2019 - 2023 |
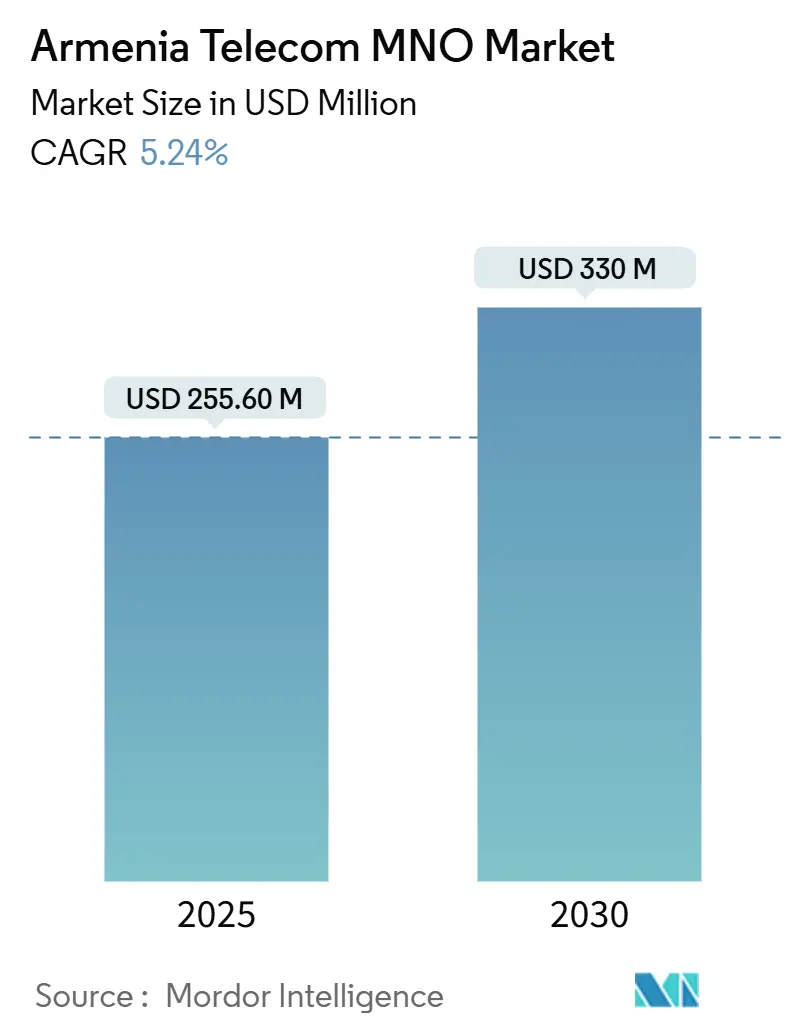
| Market Size (2025) | USD 255.60 Million |
| Market Size (2030) | USD 330 Million |
| Growth Rate (2025 - 2030) | 5.24% CAGR |
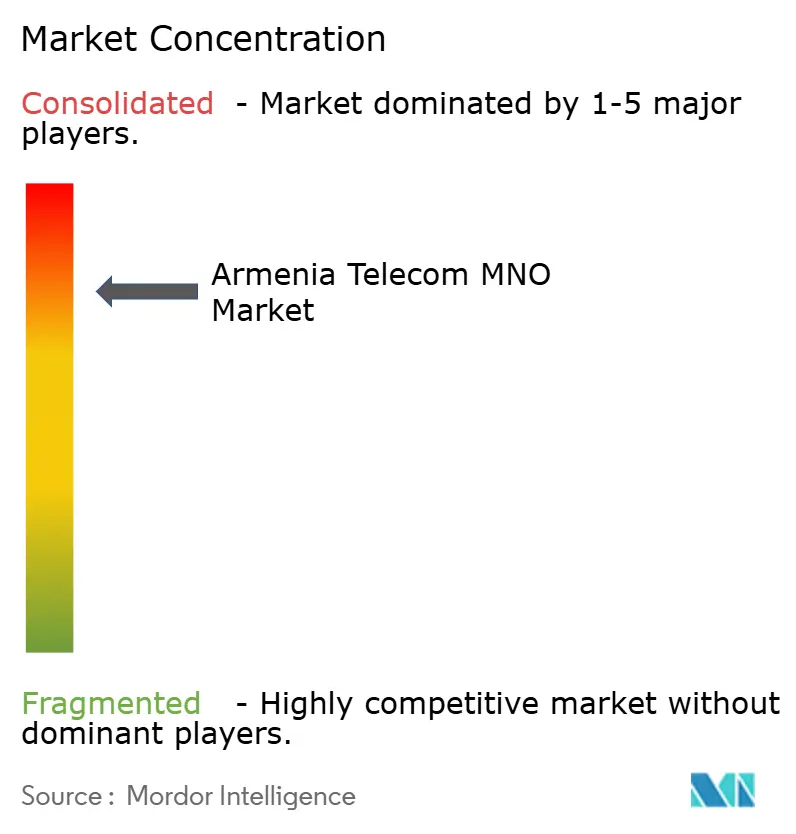
| Market Concentration | High |
Major Players *Disclaimer: Major Players sorted in no particular order Image © Mordor Intelligence. Reuse requires attribution under CC BY 4.0. | |
Armenia Telecom MNO Market Analysis by Mordor Intelligence
The Armenia Telecom MNO Market size is estimated at USD 255.60 million in 2025, and is expected to reach USD 330 million by 2030, at a CAGR of 5.24% during the forecast period (2025-2030).
Robust 5G spectrum allocations, widespread fiber upgrades, and cloud-first mandates position Armenia as a regional connectivity hub, while high smartphone penetration lifts mobile data revenues. Operators channel capital into 25 G PON rollouts and rural LTE densification to monetize premium speeds and widen coverage. Government digitalization programs sustain network investment incentives and stimulate enterprise demand for low-latency links. Competitive intensity revolves around network quality, with incumbents leveraging scale or technology leadership to secure high-value customers amid voice revenue substitution pressures.
Key Report Takeaways
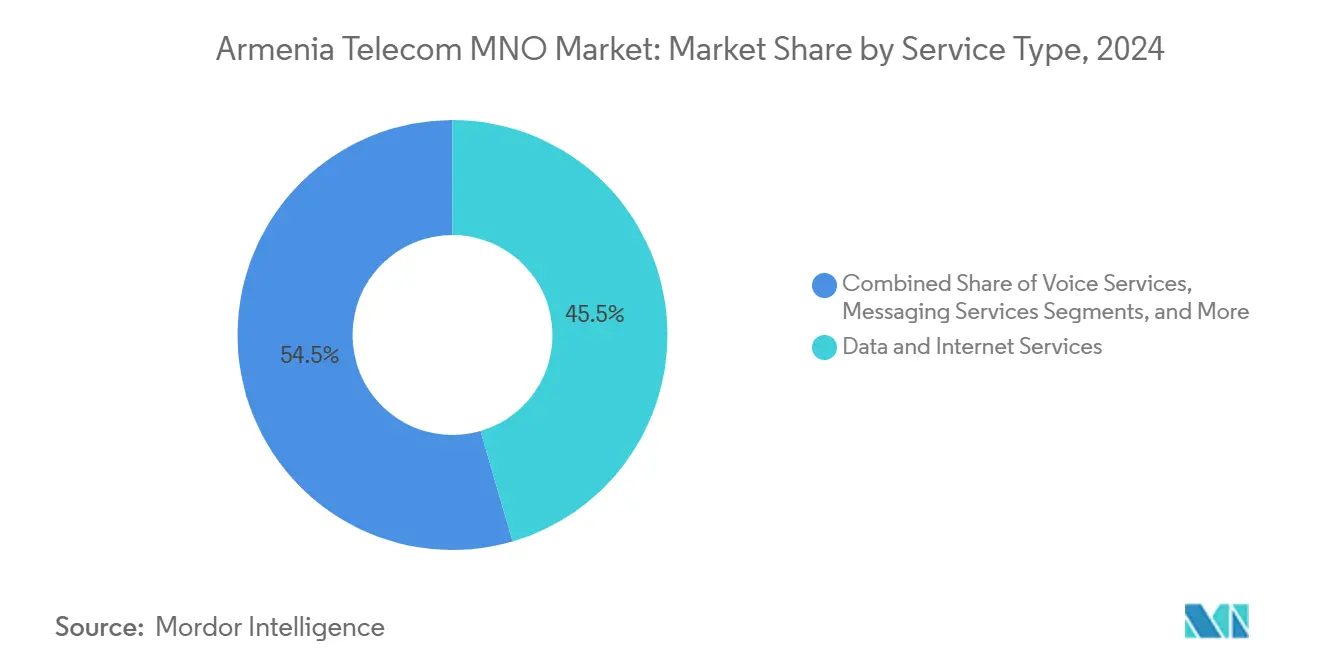
- By service type, data and internet services led with 45.48% revenue share in 2024, while IoT & M2M is forecast to expand at a 5.33% CAGR through 2030.
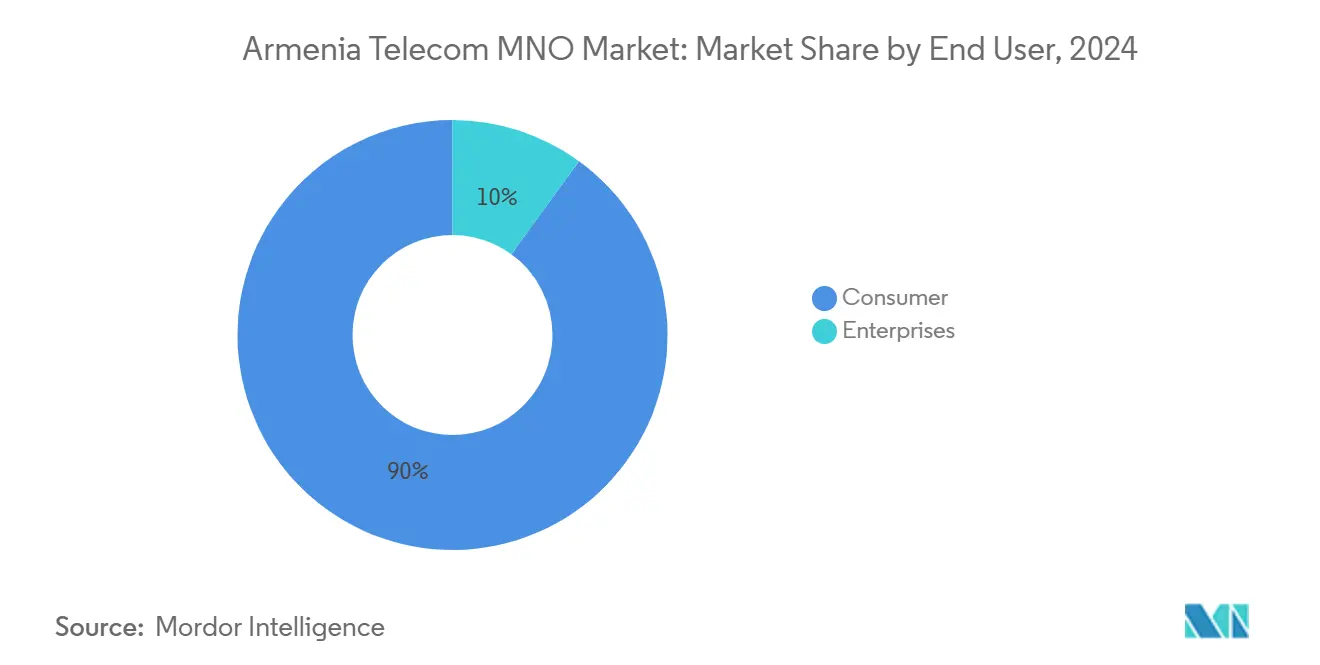
- By end-user, consumer services controlled 89.99% of the Armenia telecom MNO market share in 2024, whereas the enterprise segment records the fastest growth at 6.25% CAGR to 2030.
Armenia Telecom MNO Market Trends and Insights
Drivers Impact Analysis*
| Driver | (~) % Impact on CAGR Forecast | Geographic Relevance | Impact Timeline |
|---|---|---|---|
| 5G-ready spectrum awards accelerating rollout | +1.2% | National, early advances in Yerevan, Gyumri, Vanadzor | Medium term (2-4 years) |
| Rising mobile data traffic from 80%+ smartphone penetration | +0.8% | National | Short term (≤ 2 years) |
| Nationwide 25 G PON and fiber upgrades boosting fixed ARPU | +0.9% | National, urban focus | Medium term (2-4 years) |
| Enterprise cloud and digitalization demand for high-capacity links | +0.7% | National, Yerevan tech corridor | Long term (≥ 4 years) |
| Fresh IPO and IFC capital unlocking rural coverage investments | +0.6% | National, underserved areas | Medium term (2-4 years) |
| Prospective Starlink gateway creating wholesale backhaul demand | +0.4% | Mountainous regions | Long term (≥ 4 years) |
| Source: Mordor Intelligence | |||
5G-ready spectrum awards accelerating rollout
Ucom launched the country’s largest 5G network in mid-2025, reaching 65% of the population across 35 cities and integrating Nokia's non-stand-alone architecture to maximize reuse of 4G assets. [1]168.am Staff, “Ucom Launches 5G Network in Yerevan,” 168.am Parallel investments by Team Telecom Armenia using Ericsson radios intensify nationwide deployment momentum. The pro-business spectrum policy contrasts with neighboring states and accelerates Armenia's telecom MNO market adoption curves. Low-latency coverage enables industrial IoT pilots in mining and manufacturing clusters, reinforcing enterprise willingness to migrate critical workloads to mobile edge clouds. Operators channel incremental capex into millimeter-wave trials that promise gigabit speeds for dense urban zones.
Rising mobile data traffic from 80%+ smartphone penetration
Smartphone ownership above 80% drives sustained data demand. COVID-19 lockdowns highlighted this trend when internet revenues increased 12.1% yet voice income fell 20.9% in H1 2020, signaling structural reliance on data connectivity. [2]Hetq Investigative Journalists, “Internet Demand Grew, Mobile Voice Fell During Pandemic,” hetq.am Operators bundled zero-rated video and social platforms to protect ARPU and upsell premium tiers. Mobile broadband penetration surpassed 103% in 2023, indicating multi-SIM usage and heavy streaming behavior. Continued traffic growth obliges densification of 4G cells and swift migration toward 5G standalone cores to relieve spectrum congestion and unlock network slicing revenues.
Nationwide 25 G PON and fiber upgrades boosting fixed ARPU
Nokia’s 25 G PON rollout delivers symmetrical 20 Gbps links to households and businesses, catapulting Armenia into the world’s advanced fiber league. Team Telecom Armenia’s NGN buildout extends gigabit access to 40,000 additional rural homes, narrowing the urban-rural divide. Ultra-high speeds support data-center colocation, live-stream gaming, and AR/VR applications, allowing operators to upsell premium plans and lift fixed broadband ARPU. Fiber backhaul underpins 5G rollout economics by lowering long-term capacity costs, strengthening the Armenia telecom MNO market growth outlook.
Enterprise cloud and digitalization demand for high-capacity links
Armenia’s IT sector generated 837 billion AMD in 2023, up 43% from the prior year, while AWS began infrastructure discussions with the Ministry of High-Tech Industry in 2025. Enterprises deploy analytics and AI workloads that depend on reliable low-latency connections, prompting demand for SLA-backed fiber and 5 G private networks. Government e-services and Yerevan’s ArcGIS smart-city platform further anchor cloud dependency. [3]Esri StoryMaps, “Yerevan Municipality Enhances Urban Management,” esri.com The enterprise opportunity lifts service diversification and supports the 6.25% CAGR expected in the business segment through 2030.
Restraints Impact Analysis*
| Restraint | (~) % Impact on CAGR Forecast | Geographic Relevance | Impact Timeline |
|---|---|---|---|
| Voice/SMS ARPU erosion from OTT substitution | -1.1% | National | Short term (≤ 2 years) |
| Inflation-driven pressure on consumer telecom spend | -0.7% | Rural intensity | Medium term (2-4 years) |
| Geopolitical cyber-attacks increasing network security costs | -0.5% | Critical infrastructure | Long term (≥ 4 years) |
| Mountainous terrain inflating fiber backhaul capex | -0.3% | Remote highlands | Long term (≥ 4 years) |
| Source: Mordor Intelligence | |||
Voice/SMS ARPU erosion from OTT substitution
Messaging apps such as WhatsApp and Telegram displace legacy SMS volumes while Armenia-developed Zangi expands abroad, intensifying price pressure on voice bundles. [4]PanARMENIAN.Net Reporter, “Zangi Now 4th Most Popular Messaging App in South America,” panarmenian.net Operator response focuses on monetizing data-heavy plans that include unlimited OTT use, yet margin compression persists as users bypass paid voice services. The trend accelerates in the short term, shaving 1.1 percentage points from forecast CAGR.
Inflation-driven pressure on consumer telecom spend
Rapid post-revolution GDP growth lifted living standards but also fueled price sensitivity in lower-income brackets. Budget mobile plans such as Team’s AMD 1,500 tariff cater to cost-conscious users, while premium unlimited packages face slower uptake. Operators juggle affordability with capex recovery, especially as 5G builds inflate cash requirements. Medium-term inflation constraints reduce discretionary spending on add-on digital services, tempering revenue expansion.
*Our forecasts treat driver/restraint impacts as directional, not additive. The impact forecasts reflect baseline growth, mix effects, and variable interactions.
Segment Analysis
By Service Type: Data-Centric Revenue Shift Reshapes Portfolios
Data and internet services accounted for 45.48% of 2024 revenue, cementing their role as the core engine of the Armenia telecom MNO market. The segment benefits from smartphone penetration above 80% and pandemic-induced behavior shifts that lifted broadband usage while reducing voice minutes. OTT video and cloud gaming uptake accelerates traffic growth, incentivizing operators to bundle larger data quotas with content partnerships. IoT and M2M services contribute only single-digit revenue but register a 5.33% CAGR and underpin smart-city deployments in Yerevan bus networks and municipal lighting. Voice and messaging continue to contract due to OTT cannibalization, compelling carriers to phase out time-based tariffs and introduce flat-rate VoLTE offerings. OTT and PayTV services emerge as diversification levers that exploit existing fiber backbones and CDN caches. Other services, such as roaming and enterprise VPNs, recover gradually as international travel normalizes and global supply chains digitize.
Operators tie premium fiber and 5G bundles to streaming or gaming passes, using zero rating to enhance perceived value. The Armenia telecom MNO market size for data services is projected to surpass USD 180 million by 2030 as ARPU expands in tandem with multi-SIM ownership. IoT connectivity for utilities and manufacturing scales steadily as device prices fall and local integrators mature, fostering incremental recurring revenue. Fixed-mobile convergence propositions encourage households to consolidate spending with a single provider, moderating churn. Generative AI workloads drive upstream traffic, validating investment in 25 G-capable optical access networks. The ensuing bandwidth surge strengthens the case for edge nodes and peering upgrades that keep latency below 10 ms for mission-critical enterprise use cases.


By End-User: Enterprise Upswing Complements Saturated Consumer Base
Consumers generated 89.99% of 2024 revenue, supported by 96% broadband penetration and near-ubiquitous 4G coverage. Market saturation tempers subscriber growth yet sustains stable cash flows for reinvestment in 5G and fiber. Content-bundled tariffs and loyalty programs aim to curb churn in urban segments where three nationwide operators compete head-to-head. Price-sensitive rural households benefit from government-subsidized rollouts that extend fiber to 80% of settlements by 2026.
Enterprises, however, deliver the fastest expansion at a 6.25% CAGR to 2030 as cloud migration, AI adoption, and smart manufacturing proliferate. The Armenia telecom MNO market size for enterprise services is expected to exceed USD 40 million by 2030, driven by SLA-grade connectivity and private 5G networks for logistics hubs and data centers. Public-sector digital initiatives, such as e-justice portals and tax e-filing, stimulate demand for secure links. International players like AWS and NVIDIA validate Armenia’s digital ambitions through planned hyperscale and supercomputing facilities that require multi-terabit uplinks. Operators monetize enterprise demand with tiered Ethernet, SD-WAN, and edge-hosting portfolios that capture higher margins than consumer plans.
Geography Analysis
The Armenia telecom MNO market operates across 29,743 sq km, serving 2.9 million inhabitants concentrated in Yerevan, Gyumri, and Vanadzor. Yerevan alone holds 1.1 million residents and absorbs the majority of new 5G cells, fiber cross-connects, and data-centre builds. The capital’s technology corridor houses most IT exporters and attracts FDI, translating into dense enterprise traffic. Secondary cities benefit from operator commitments to balanced coverage; Ucom’s 5G footprint already spans 35 cities, while Team’s NGN passes 40,000 additional homes in Vayots Dzor and Armavir provinces.
Mountainous terrain covers 76% of the country and complicates fiber trenching, raising backhaul capex by up to 20% compared with flatlands. To address remoteness, operators deploy microwave relays and rely on the newly licensed Starlink service for backup connectivity in highlands. Armenia’s role as a Caucasus transit route hinges on dual fiber corridors via Georgia and Iran; however, cable cuts in Georgian territory triggered network outages in 2023, exposing dependency risks.
National broadband coverage reached 96% by 2024, yet only 66% of settlements had high-capacity links, prompting state targets to lift this ratio to 80% by 2026. Government subsidies and multi-lateral financing, including an Asian Development Bank subscription to Armenia’s first sustainability-linked telecom bond, lower the cost of rural expansion. The geography strategy balances profitability in densely populated areas with universal service obligations, ensuring that the Armenia telecom MNO market remains inclusive and resilient.
Competitive Landscape
Armenia hosts three nationwide mobile network operators that shape a moderately concentrated market. Viva-MTS leverages long-standing spectrum holdings and Russian MTS support to keep 4G coverage above 99% of populated areas, maintaining cost leadership in nationwide rollouts. Team Telecom Armenia, with a 25.6% share and 1 million subscribers, differentiates through governance transparency and IFC-backed financing that accelerates NGN and 5G builds. Ucom, though smaller, anchors technological leapfrogging, securing Nokia and Ericsson partnerships to debut 25 G PON and cover 35 cities with 5G.
Rivalry focuses on network performance and bundle innovation rather than aggressive discounting, preserving sector profitability needed for ongoing capex. Operators offer converged fixed-mobile subscriptions and OTT video add-ons as loyalty hooks. Enterprise pursuit intensifies; Ucom targets AI and HPC customers created by the USD 500 million NVIDIA-Firebird supercomputer campus that requires bespoke connectivity. Team invests in cloud gateways and SD-WAN to serve SMEs aligned with OECD digital transformation guidance. Viva-MTS pilots millimeter-wave in Yerevan business districts to support VR collaboration suites for engineering firms.
Regulatory oversight by the Public Services Regulatory Commission aims to boost market liquidity and investor confidence, requesting operators to list shares on the local exchange. Policy consistency under the Digitalization Strategy of Armenia 2021-2025 sustains infrastructure incentives while safeguarding consumer protections. Collective network sharing discussions for rural coverage reflect rising capex discipline and the need to meet universal service milestones without duplication.
Armenia Telecom MNO Industry Leaders
Viva-MTS (Viva Armenia CJSC)
Team Telecom Armenia CJSC
Ucom CJSC
- *Disclaimer: Major Players sorted in no particular order

Recent Industry Developments
- June 2025: Ucom launched the largest Armenian 5 G network, covering 35 cities and 65% of the population, using Nokia non-stand-alone architecture.
- June 2025: NVIDIA and Firebird pledged USD 500 million to build an AI supercomputer in Armenia, boosting demand for high-capacity telecom services.
- May 2025: AWS engaged the Ministry of High-Tech Industry on local cloud infrastructure and Kuiper satellite integration.
- December 2024: The Public Services Regulatory Commission granted Starlink a network exploitation license, enabling satellite Internet pilots.
- December 2024: Asian Development Bank subscribed USD 18.5 million to Team Telecom Armenia’s sustainability-linked bond to fund rural upgrades.


Armenia Telecom MNO Market Report Scope
| Voice Services |
| Data and Internet Services |
| Messaging Services |
| IoT and M2M Services |
| OTT and PayTV Services |
| Other Services (VAS, Roaming and International Services, Enterprise and Wholesale Services, etc.) |
| Enterprises |
| Consumer |
| Service Type | Voice Services |
| Data and Internet Services | |
| Messaging Services | |
| IoT and M2M Services | |
| OTT and PayTV Services | |
| Other Services (VAS, Roaming and International Services, Enterprise and Wholesale Services, etc.) | |
| End-user | Enterprises |
| Consumer |


Key Questions Answered in the Report
How large will data and internet revenues become by 2030 in Armenia?
Data and internet revenues are expected to exceed USD 180 million by 2030 as premium fiber and 5 G services lift ARPU.
Which operator leads 5 G deployment in Armenia?
Ucom leads with a 5 G footprint spanning 35 cities and covering 65% of the population as of mid-2025.
What CAGR is forecast for Armenia’s enterprise telecom segment through 2030?
The enterprise segment is projected to advance at a 6.25% CAGR driven by cloud migration and AI workloads.
How is mountainous terrain influencing network costs?
High-altitude regions inflate fiber backhaul costs by around 20%, prompting satellite backup and microwave links to manage capex.
What role does foreign investment play in Armenia’s telecom upgrades?
Multilateral financing such as ADB’s bond subscription and prospective AWS infrastructure commitments supply capital for 5 G and rural fiber expansions.
How vulnerable is Armenia’s international connectivity?
Transit dependency on cables through Georgia and Iran exposes the network to outage risks when either corridor experiences physical damage.
Page last updated on:


