
Market Overview
| Study Period | 2021 - 2031 |
|---|---|
| Forecast Data Period | 2026 - 2031 |
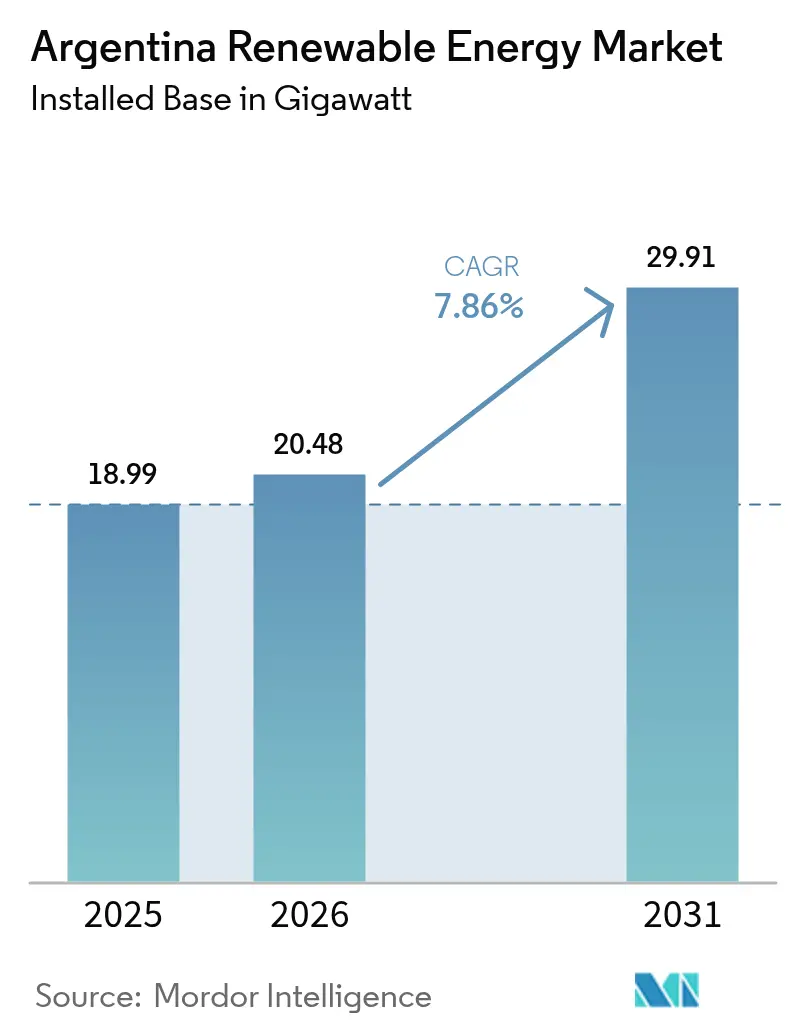
| Base Year Market Size (2025) | 18.99 gigawatt |
| Market Volume (2026) | 20.48 gigawatt |
| Market Volume (2031) | 29.91 gigawatt |
| Growth Rate (2026 - 2031) | 7.86 % |
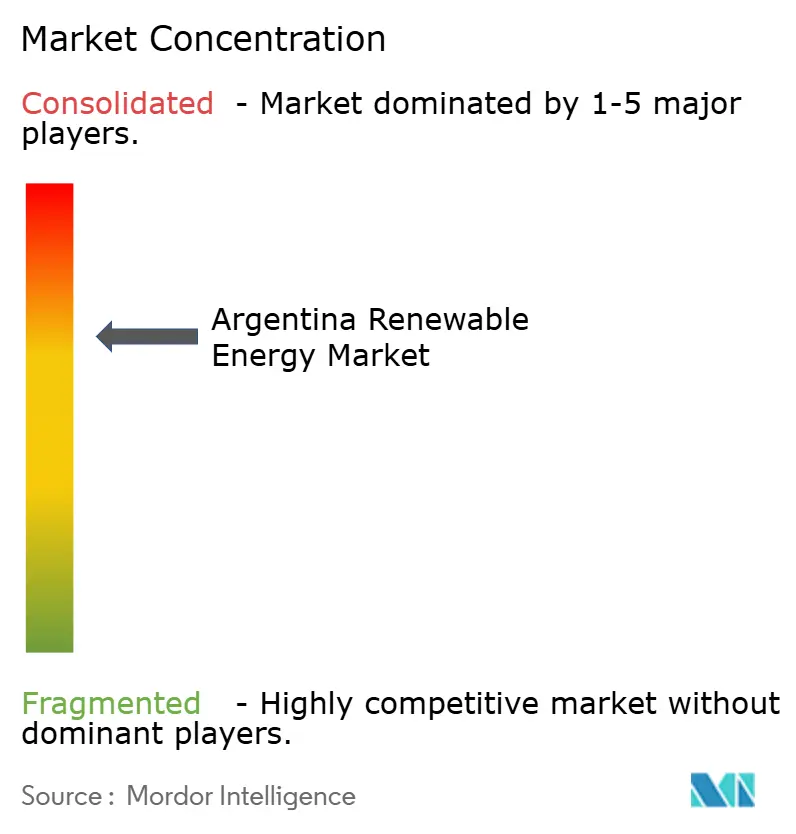
| Market Concentration | Medium |
Major Players *Disclaimer: Major Players sorted in no particular order Image © Mordor Intelligence. Reuse requires attribution under CC BY 4.0. | |
Argentina Renewable Energy Market Analysis by Mordor Intelligence
The Argentina Renewable Energy Market size was valued at 18.99 gigawatt in 2025 and estimated to grow from 20.48 gigawatt in 2026 to reach 29.91 gigawatt by 2031, at a CAGR of 7.86% during the forecast period (2026-2031).
Capacity additions focus largely on utility-scale wind farms in Patagonia and large solar plants in the northwest, while inflation moderation and projected 5.2% GDP growth in 2025 improve investor confidence. Regulatory certainty created by the 30-year guarantees under the Large Investment Incentive Regime (RIGI) attracts developers planning projects above USD 200 million. Continued cost deflation in wind‐turbine and solar-module supply chains makes renewables cheaper than fossil fuel generation, an advantage amplified by Argentina’s exceptional resource quality.[1]International Renewable Energy Agency, “Renewable Power Generation Costs 2024,” irena.org Climate-finance inflows from MDBs, green bonds, and sustainability-linked loans further reduce the weighted average cost of capital for the Argentine renewable energy market, helping close the funding gap for transmission projects that connect remote high-resource zones to Buenos Aires demand centers.
Key Report Takeaways
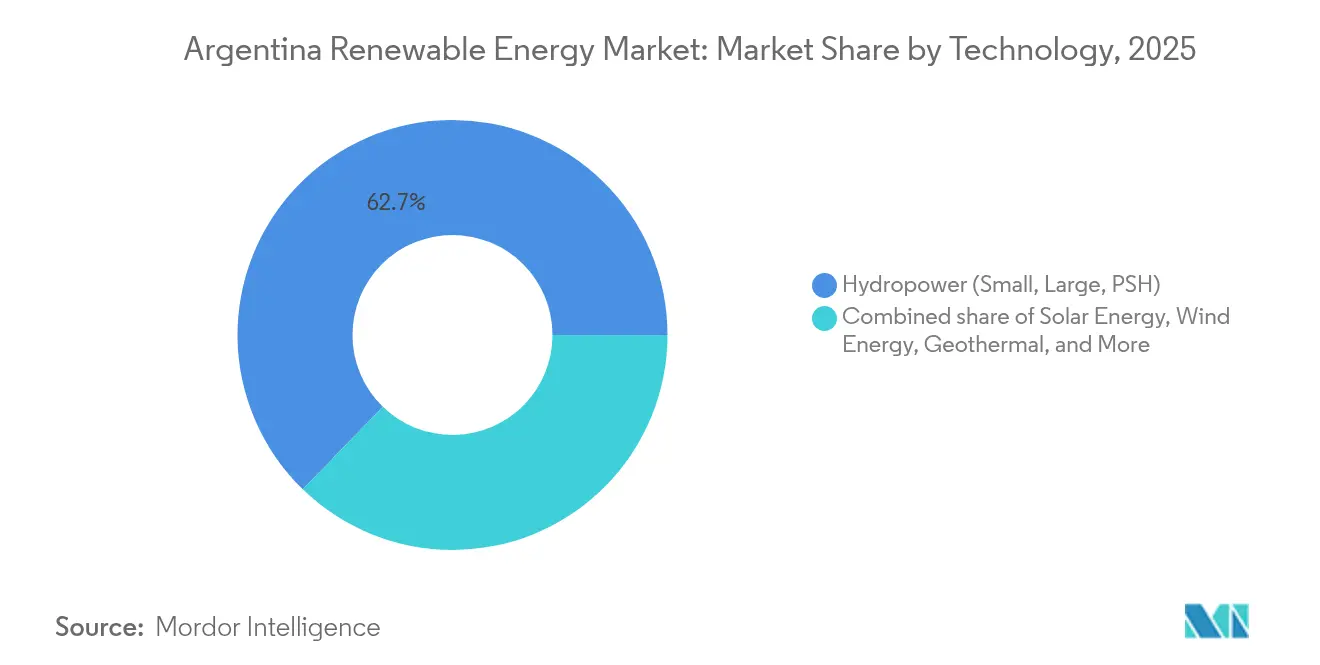
- By technology, hydropower accounted for 62.74% of the Argentine renewable energy market share in 2025, while geothermal is forecast to expand at a 22.7% CAGR to 2031.
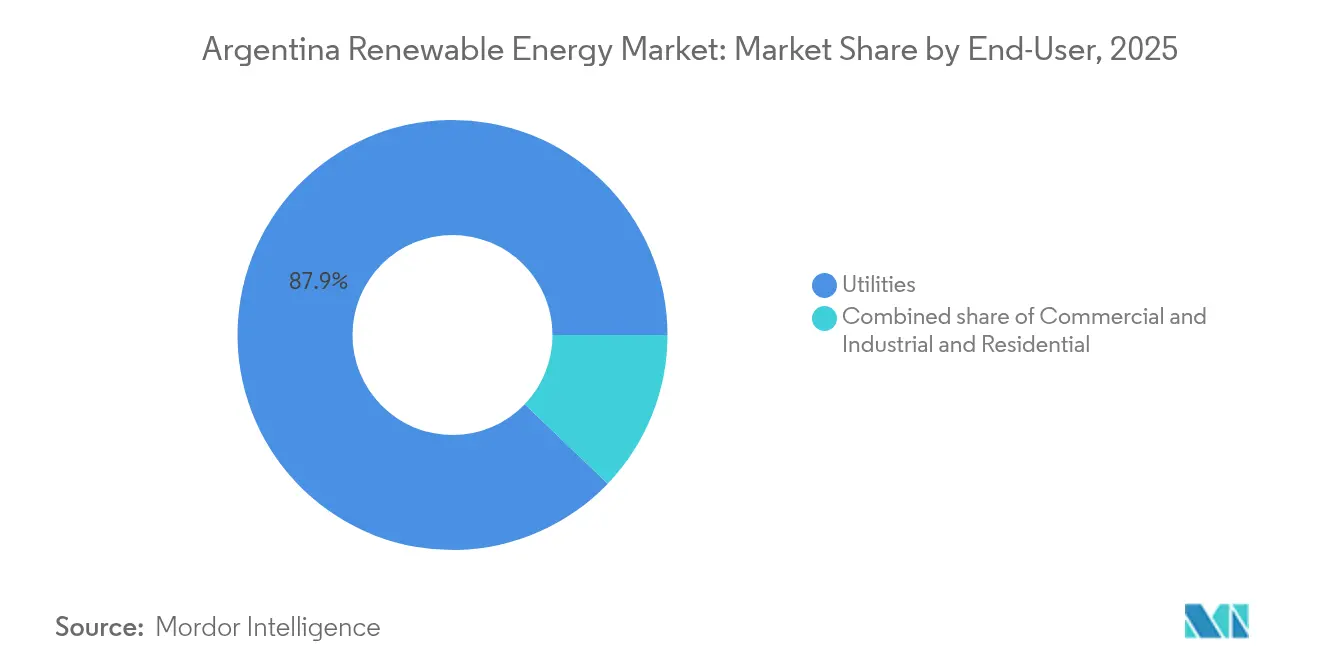
- By end-user, utilities held 87.85% share of the Argentine renewable energy market size in 2025; the C&I segment records the highest projected CAGR at 10.32% through 2031.
Note: Market size and forecast figures in this report are generated using Mordor Intelligence’s proprietary estimation framework, updated with the latest available data and insights as of 2026.
Argentina Renewable Energy Market Trends and Insights
Drivers Impact Analysis*
| Driver | (~) % Impact on CAGR Forecast | Geographic Relevance | Impact Timeline |
|---|---|---|---|
| Renewable-energy auction rounds (RenovAr & MATER) | +1.80% | National, with concentration in Buenos Aires, Patagonia, and Norte Grande | Medium term (2-4 years) |
| Declining LCOE for solar PV & onshore wind | +1.50% | National, strongest in high-irradiance NOA and high-wind Patagonia | Short term (≤ 2 years) |
| International climate-finance inflows (green, sustainability-linked bonds) | +1.20% | National, channeled through IDB, World Bank, and private green-bond issuances | Medium term (2-4 years) |
| National grid expansion (Plan Federal I & II) | +1.00% | Patagonia and NOA transmission corridors | Long term (≥ 4 years) |
| Lithium-battery value-chain localisation enabling hybrid RE-storage plants | +0.90% | Catamarca, Jujuy, Salta lithium triangle; storage deployment nationwide | Long term (≥ 4 years) |
| Corporate PPAs from export-oriented agribusiness (EU CBAM compliance) | +0.70% | Buenos Aires, Santa Fe, Córdoba agro-industrial hubs | Short term (≤ 2 years) |
| Source: Mordor Intelligence | |||
Renewable-energy auction rounds (RenovAr & MATER)
Argentina’s RenovAr and MATER programs have evolved into sophisticated capacity allocation tools that deliver bankable PPAs for private investors. A new MATER call assigned 209 MW of dispatch priority along corridors with superior resources, ensuring revenue visibility for Patagonia and the Litoral projects. The third RenovAr round added 400 MW for small-scale plants, broadening market access for distributed generation. Since 2016, auction rounds mobilized more than USD 11 billion, adding 8.7 GW and positioning the Argentine renewable energy market as the region’s benchmark for transparent procurement. World Bank guarantees underpinning these PPAs reduce counterparty risk in a country still rated high-yield. Continuity of the schemes under the Milei administration signals long-term policy support and sustains deal flow into the next decade.
Declining LCOE for solar PV & on-shore wind
Global cost declines place solar PV at USD 0.044/kWh and wind at USD 0.033/kWh in 2024, figures already below Argentina’s thermal generation costs. Patagonian wind farms achieve capacity factors above 40%, and north-western solar plants exceed 25%, magnifying the cost advantage. The 312 MW Cauchari complex, completed in July 2024, proved that large solar assets in remote deserts can achieve grid parity. Residential and commercial solar reached break-even in high-tariff provinces, stimulating rooftop uptake and feeding the emerging distributed segment. Falling hardware prices, therefore, underpin the 8.0% CAGR that solar is expected to post within the Argentine renewable energy market.
International climate-finance inflows (green, sustainability-linked bonds)
Argentina benefits from multilateral initiatives that blend concessional and commercial tranches, cutting interest spreads on long-tenor loans. IDB Invest renewed a Sustainable Financing Protocol covering 37 local lenders representing 94% of credit stock.[2]IDB Invest, “Sustainable Financing Protocol Argentina,” idbinvest.org EU-Argentina cooperation on green hydrogen opens the door to European climate funds tied to electrolyzer-ready renewable projects. Germany signaled its willingness to finance USD 1.7 billion in high-tension lines, proving climate finance can extend beyond generation assets. Ongoing green and sustainability-linked bond issuance, now a USD 800 billion global market, gives local developers emerging access to deep pools of ESG capital. IMF program clauses that earmark space for climate investment further lower sovereign-related uncertainty.
National grid expansion (Plan Federal I & II)
The Transmission Development Plan 2024-2050 earmarks USD 6.9 billion for new 500 kV lines that connect Patagonia and the northwest to Buenos Aires load centers.[3]DF SUD, “Plan de Expansión de Transmisión Eléctrica 2024-2050,” dfsud.com HVDC technology will reduce line losses over the 1,200 km stretch that separates prime wind fields from industrial demand. The user-driven Public Contest method lets developers trigger specific lines, aligning network build-out with actual pipeline locations. ICE committed USD 100 million to strengthen nodes that integrate new capacity. Although execution risk persists, the 30-year stability covered under RIGI increases the bankability of transmission concessions and should make the Argentine renewable energy market size accessible to investors.
Restraints Impact Analysis*
| Restraint | (~) % Impact on CAGR Forecast | Geographic Relevance | Impact Timeline |
|---|---|---|---|
| Macroeconomic instability & FX-risk deterring FDI | -1.30% | National, affecting all project finance structures | Short term (≤ 2 years) |
| Transmission bottlenecks in high-resource regions (Patagonia, NOA) | -0.90% | Patagonia wind corridor, Norte Grande solar belt | Medium term (2-4 years) |
| Policy uncertainty from tariff-freeze & energy-subsidy debate | -0.60% | National, with provincial variations in tariff pass-through | Short term (≤ 2 years) |
| Land-use conflicts with indigenous communities delaying wind farms | -0.40% | Neuquén, Río Negro, Chubut provinces | Medium term (2-4 years) |
| Source: Mordor Intelligence | |||
Macroeconomic instability & FX-risk deterring FDI
Although projected to drop to 18-23% by end-2025, inflation remains the highest in the G20 and complicates cost pass-through in long-term PPAs. Capital controls limit the conversion of peso revenues into USD, clouding the repatriation path for foreign sponsors. A 50% peso devaluation in late 2023 strained projects with peso-cost and USD revenue mismatches, prompting lenders to demand higher debt-service reserves. Fiscal consolidation reduces the state's ability to co-finance transmission, pushing more burden onto private balance sheets. These factors elevate hurdle rates and slow commitment pacing in Argentina's renewable energy market.
Transmission bottlenecks in high-resource regions (Patagonia, NOA)
Wind parks in Chubut and Santa Cruz can achieve world-class factors but face curtailment when 500 kV corridors saturate during peak output. Jujuy solar farms encounter similar constraints, forcing operators to accept reduced dispatch or negative prices. Grid expansion often lags behind new project commissioning, a mismatch that erodes developer returns. The Public Contest method helps, yet opponents argue it can overlook system-wide benefits by focusing on private beneficiaries. Until new lines become operational, available interconnection capacity will remain the binding constraint on the Argentine renewable energy market size that can be monetized.
*Our forecasts treat driver/restraint impacts as directional, not additive. The impact forecasts reflect baseline growth, mix effects, and variable interactions.
Segment Analysis
By Technology: Hydropower Anchors, Geothermal Surges
Hydropower held 62.74% of the Argentine renewable energy market share in 2025, backed by legacy dams such as Yacyretá (3.2 GW) and Salto Grande (1.9 GW). Expansion opportunities are confined to run-of-river schemes, while pumped storage remains capital-intensive at more than USD 2,000 per kW. Wind contributed 18.60% of 2025 capacity, capturing Patagonia’s 45% capacity factors, yet offshore remains dormant owing to challenging seabed conditions. Solar delivered 12.80% of installations, propelled by irradiance above 2,200 kWh/m² in NOA provinces and supported by Canadian Solar and Trina Solar modules that meet a 30% local-value rule. Geothermal, rising at a 22.7% CAGR, is set to commission the 30 MW Copahue plant by 2026 following a USD 120 million IDB facility.



By End-User: Utilities Dominate, C&I Accelerates
Utilities controlled 87.85% of installed renewable capacity in 2025, reflecting a centralized dispatch model managed by CAMMESA and provincial distributors. The C&I segment, however, is advancing at a 10.32% CAGR as exporters hedge CBAM exposure through long-term PPAs, which accounted for 380 MW of deals in 2024. Residential uptake is below 1% of the Argentine renewable energy market, as rooftop solar costs still hover at USD 1,200–1,500 per kW and net-metering rules remain patchy. MATER’s 450 MW distributed-generation awards target industrial parks, but 90-day payment delays weigh on smaller developers.
Geography Analysis
Patagonia hosts the bulk of wind capacity with average speeds above 9 m/s and factors surpassing 40%, yet line saturation toward Buenos Aires forces periodic curtailment. The north-western provinces of Jujuy and Salta rely on intense solar irradiation exceeding 2,200 kWh/m² per year, conditions that underpin utility projects such as Cauchari. Lithium mining in the same region adds local demand and enables co-located solar-storage plants that anchor off-grid operations.
The Buenos Aires metropolitan area, accounting for more than one-third of the national load, attracts distributed rooftop uptake because high tariffs improve paybacks. Central provinces Córdoba and Santa Fe see growth in C&I installations locked into corporate PPAs, motivated by exporters’ need to decarbonize supply chains. The Cuyo region, thanks to balanced wind and solar resources and existing 500 kV links, emerges as a diversified hub that feeds both local industry and the national grid.
Regional incentives create micro-climates for investment. Chubut offers provincial tax rebates for wind developers, while Jujuy finances small solar kits for remote villages. Yet social acceptance varies: Mapuche communities in Río Negro obtained a December 2024 ruling forcing the removal of turbines from sacred lands, a precedent likely to influence future projects. Environmental NGOs increasingly scrutinize cumulative wildlife impacts, especially in migratory bird corridors. These factors turn regional stakeholder management into a decisive element of success within the Argentine renewable energy market.
Regulatory Landscape
Argentina's renewables framework is anchored in the National Promotion Regime for Renewable Energy (Laws 26.190 and 27.191), which set a 20% renewables participation target in national electricity consumption by December 31, 2025. As the market moved into 2026, developers increasingly referenced broader investment-stability tools such as the Large Investment Incentive Regime (RIGI) when structuring large projects, alongside the established procurement tracks (RenovAr and MATER) used to contract renewable output.
Policy and market-governance updates in 2024-2025 changed how new renewable capacity is contracted and integrated into the Wholesale Electricity Market (MEM). Resolution 150/2024 removed CAMMESA's ability to enter new PPAs, reshaping counterparty and contracting pathways, while the Secretariat of Energy introduced "Lineamientos para la Normalizacion del Mercado Electrico Mayorista" with initial measures effective November 1, 2025 to progressively relax operational restrictions. At the same time, Resolution 306/2025 delegated authority to the Subsecretaria de Energia Electrica for renewable promotion certificates and RenovAr project relocation approvals, affecting how projects maintain eligibility and proceed through administrative changes.
Competitive Landscape
The market shows moderate concentration, with the five largest operators controlling slightly above 55% of installed capacity. Genneia, YPF Luz, and Pampa Energía leverage local financing channels and knowledge of regulatory nuances, while Enel Green Power, Acciona Energía, and Nordex Argentina supply technology and cross-border capital.[4]U.S. International Trade Administration, “Argentina Renewable Energy Report,” trade.gov Recent openings such as the 90 MW Sierras Blancas solar plant illustrate Genneia’s ability to diversify beyond wind.
Strategic partnerships dominate. Domestic EPCs team with foreign OEMs to deliver turnkey solutions that meet RenovAr specifications. Vertical integration gains ground as Argentina’s first solar-module factory comes online, capturing upstream value and reducing forex exposure for future developments. Players with in-house storage offerings exploit Argentina’s lithium advantage to bundle batteries with PV, an edge when bidding for micro-grids in mining or border communities.
Financing innovation differentiates leaders. Sustainability-linked loans tied to emission-reduction targets give cost advantages to firms able to document environmental benefits. Green bonds issued in 2024 fund pipeline additions under structures that align coupon step-ups with verified output. Digitalisation trends continue, with remote-sensing and AI-driven forecasting adopted to optimise dispatch and minimise curtailment. Environmental litigation risk pushes developers to invest more in baseline biodiversity studies, a field where European incumbents hold expertise.
Argentina Renewable Energy Industry Leaders
Genneia SA
YPF Luz
Central Puerto SA
Pampa Energía SA
360 Energy SA
- *Disclaimer: Major Players sorted in no particular order

Market Opportunities and Future Outlook
With the expiration of Law 27.191 on December 31, 2025 and no active new capacity procurement rounds under RenovAr in mid-2026, whitespace has opened for projects that can proceed through private contracting and investment-regime structures rather than relying on legacy incentive designs. This creates opportunity in MATER-linked corporate PPAs, particularly where exporters use renewable sourcing to support supply-chain decarbonization, and in hybrid configurations that reduce curtailment exposure in constrained nodes.
Grid and flexibility investments form a second, concrete opportunity track as transmission limits in SADI continue to bind new interconnections. In July 2026, the Secretaria de Energia awarded 700.5 MW of BESS capacity across 20 projects to Genneia, DQD Energy, 360 Energy Solar, Aluar, and Intermepro under the Alma SADI tender, highlighting a market shift toward storage-led solutions that can unlock additional renewable dispatch and improve reliability. Alongside this, the operating and construction pipeline (193 renewable projects in operation and 44 under construction as of early 2026, with USD 11.5 billion in accumulated direct investment) points to room for EPC, O&M, and financing offerings tailored to multi-asset solar clusters and storage additions tied to specific nodes and corridors.
Recent Industry Developments
- June 2026: Genneia completed commissioning of the 180 MW San Rafael solar farm. Bringing the plant fully online strengthens utility-scale solar supply in Argentina and supports developers bundling new PV with grid-support solutions where interconnection capacity is constrained.
- May 2026: YPF Luz inaugurated the 305 MW El Quemado solar farm in Mendoza, backed by a reported USD 220 million investment. The project set a new scale benchmark for solar in the country and expands the set of bankable large-plant references for future multi-hundred-megawatt developments.
- October 2024: Verano Energy started construction of the 200 MW San Rafael Solar Park. The build signaled continued foreign-backed project execution and added momentum to Argentina's utility-scale solar pipeline outside the traditional wind-heavy buildout regions.


Research Methodology Framework and Report Scope
Market Definition and Coverage
For this study, the Argentina renewable energy market is defined as installed electricity generation capacity from renewable sources that is connected to the grid or built for captive use, and it is measured in gigawatt (GW).
Scope exclusions: We exclude fossil-based power capacity and any off-grid pilot setups that are not commissioned as usable generation assets.
Segmentation Overview
- By Technology
- Solar Energy (PV and CSP)
- Wind Energy (Onshore and Offshore)
- Hydropower (Small, Large, PSH)
- Bioenergy
- Geothermal
- Ocean Energy (Tidal and Wave)
- By End-User
- Utilities
- Commercial and Industrial
- Residential
Data Sources, Market Sizing, and Validation
Desk Research
Desk research was used to build the base demand picture and to anchor the capacity pipeline to real-world project timelines. We leaned on public sources such as Argentina energy and power agencies for generation statistics, the national statistics office for macro indicators, multilateral sources such as the World Bank and IRENA for renewable definitions and time series, and grid operator releases for system planning signals.
To reduce the risk of relying on a single dataset, the inputs were cross-checked against import and trade disclosures for key equipment classes, project award and tender notices, and company filings and investor presentations where capacity additions and commissioning dates are discussed. In a few places, paid subscriptions that track company financials, patent activity, and shipment-level trade flows were used to confirm ownership changes and equipment delivery timing. These desk sources are illustrative only, and we also referenced other public documents and datasets for data collection, validation, and clarification.
Primary Interviews and Surveys
Primary work was used to validate what is actually getting built versus what is only announced, and to pressure-test utilization and commissioning assumptions. We spoke with a mix of developers, EPC and O&M participants, equipment channels, grid-linked stakeholders, and large power buyers. Feedback was also gathered from finance and policy-facing roles to sanity-check the pace of new additions. Since this is a country-level market, the fieldwork focused on Argentina, while still covering different demand pockets such as utility-scale projects and C&I captive installations.
Distribution of primary research fieldwork respondents
| Company type | Respondent position |
|---|---|
| Top tier: 39% | CXOs: 13% |
| Mid tier: 46% | Functional/Unit leaders: 36% |
| Smaller Players: 15% | Managers: 51% |
Market-Sizing & Forecasting
Sizing was built using a top-down approach where Argentina generation and grid statistics were used to reconstruct the installed renewable base, and then the forward build-out was layered in using project pipeline visibility. Only after the demand pool was established, selective bottom-up checks were run using sampled project lists, typical MW block sizes, and the observed commissioning cadence, which helped adjust for delays and cancellations.
Key inputs that shaped the model included historical renewable capacity additions by technology, auction and tender award volumes, grid connection lead times, project completion and COD patterns, and equipment availability signals inferred from trade flows and public project disclosures. When gaps appeared, we handled them through conservative interpolation based on comparable project timelines, followed by expert checks to keep assumptions realistic.
For forecasting, scenario analysis was used to reflect policy execution risk and financing conditions, and it was guided by what interviewees expected for award frequency, grid readiness, and the pace of repowering. The output was produced as annual installed capacity (GW), and it was reviewed for consistency with the observable pipeline and typical construction cycles in Argentina.
Data Validation & Update Cycle
Validation was done in layers, starting with cross-checks between the modeled capacity totals and independent signals such as generation trends, announced commissioning schedules, and grid expansion cues. If a year showed an unusual jump or drop, we traced the drivers back to a small set of assumptions, and those assumptions were rechecked using follow-up outreach and a second analyst review.
Before sign-off, variances were reconciled across technologies so the final totals remained coherent with the build pipeline and known constraints. The report is refreshed annually, and interim updates are triggered when material events occur, such as major policy changes, large project cancellations, or new auction rounds. Right before delivery, we run a final pass to ensure the latest public announcements are reflected.
Mordor Intelligence's Argentina Renewable Energy Market Size Compared With Other Published Estimates
Published estimates for Argentina renewable energy often vary because some studies size revenue value while others size physical capacity. The underlying assumptions around commissioning timing and what qualifies as operational can also differ. Currency timing, inflation treatment, and whether forecasts lean aggressive or conservative add another layer of spread.
The table shows that the largest gaps usually come from a unit mismatch and from scope choices around what is counted as market activity. Some sources report only non-hydro renewables or only utility-scale projects, while others mix generation revenue, equipment value, and services into a single number, which can inflate totals during years with big project announcements.
Benchmark comparison
| Source | Market Size | Gaps in Research Methodology |
|---|---|---|
| Mordor Intelligence | USD 18.99 B (2025) | |
| Global Consultancy A | USD 14.50 B (2025) | Reported as revenue value in USD, with a different coverage of technologies and a price-based build that is sensitive to tariff and currency assumptions, so it does not map cleanly to installed GW. |
| Industry Research Group B | USD 2.50 B (2023) | Uses an earlier base year and a valuation lens, and it is likely to reflect market value rather than physical capacity, which lowers the stated total when new builds are delayed. |
The table points to a clear unit and scope split. In Mordor Intelligence's model, the market is tracked as installed renewable capacity that is commissioned and usable, so revenue-based totals from other sources will naturally land at different values even for the same year.


Key Questions Answered in the Report
How large is the Argentina renewable energy market in 2026?
Installed capacity stands at 20.48 GW in 2026 and is on track for 29.91 GW by 2031, reflecting a 7.86% CAGR.
Which technology leads Argentina’s clean-power mix?
Hydropower remains the anchor with 62.74% of capacity, though wind and solar are expanding fastest.
What hinders faster renewable build-out in Argentina?
High inflation, currency volatility, and transmission bottlenecks delay financial close and grid connection.
Why are corporate PPAs gaining traction?
Exporters seek renewable certificates to comply with EU CBAM, locking 10- to 15-year fixed-price PPAs around USD 45 per MWh.
What role will batteries play by 2031?
At least 500 MW of contracted storage is due online by 2026 to cut curtailment and provide ancillary services.
Which regions show the highest resource potential?
Patagonia offers wind capacity factors above 45%, while Norte Grande boasts solar irradiation exceeding 2,200 kWh/m².
Page last updated on:


 Your data is secure and never sold or shared.


