Butter Market Size and Share
Market Overview
| Study Period | 2021 - 2031 |
|---|---|
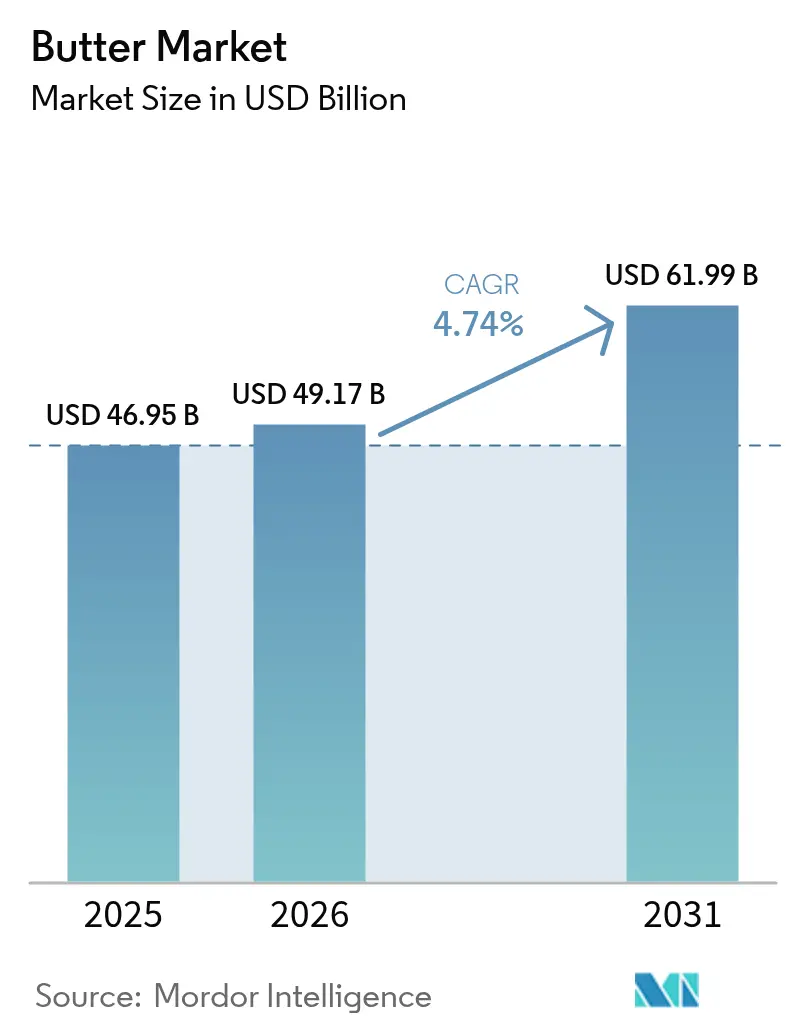
| Market Size (2026) | USD 49.17 Billion |
| Market Size (2031) | USD 61.99 Billion |
| Growth Rate (2026 - 2031) | 4.74% CAGR |
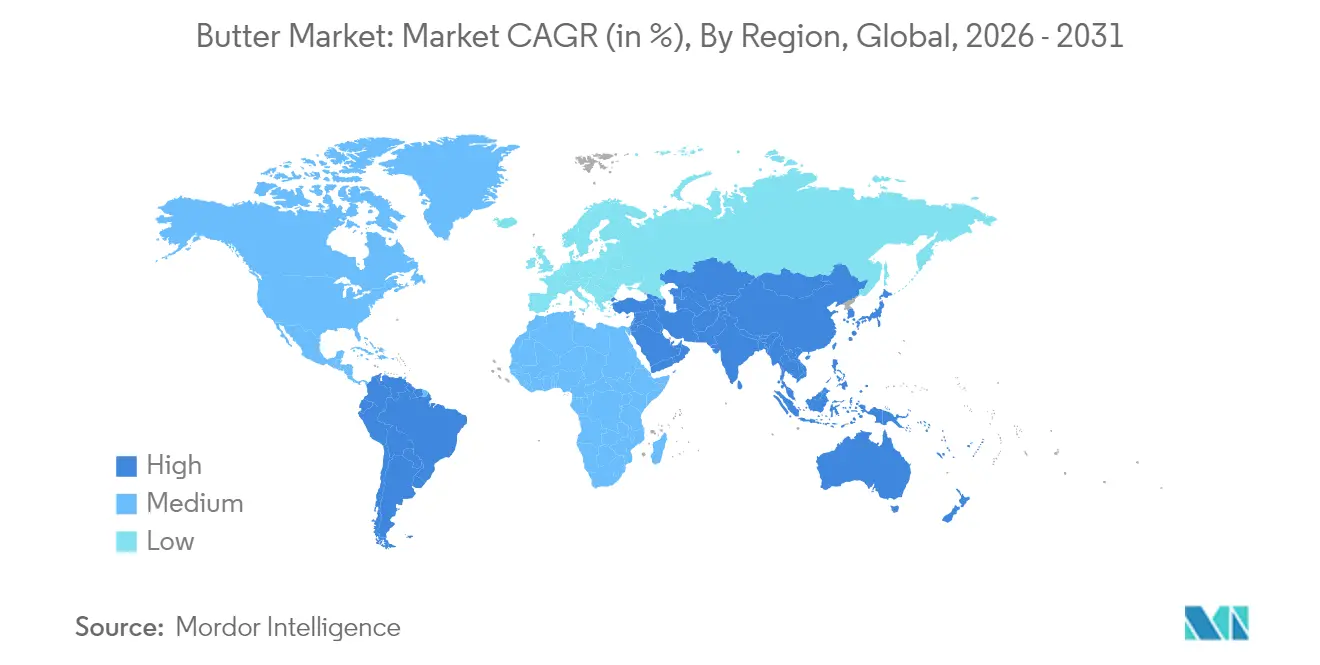
| Fastest Growing Market | Asia Pacific |
| Largest Market | Europe |
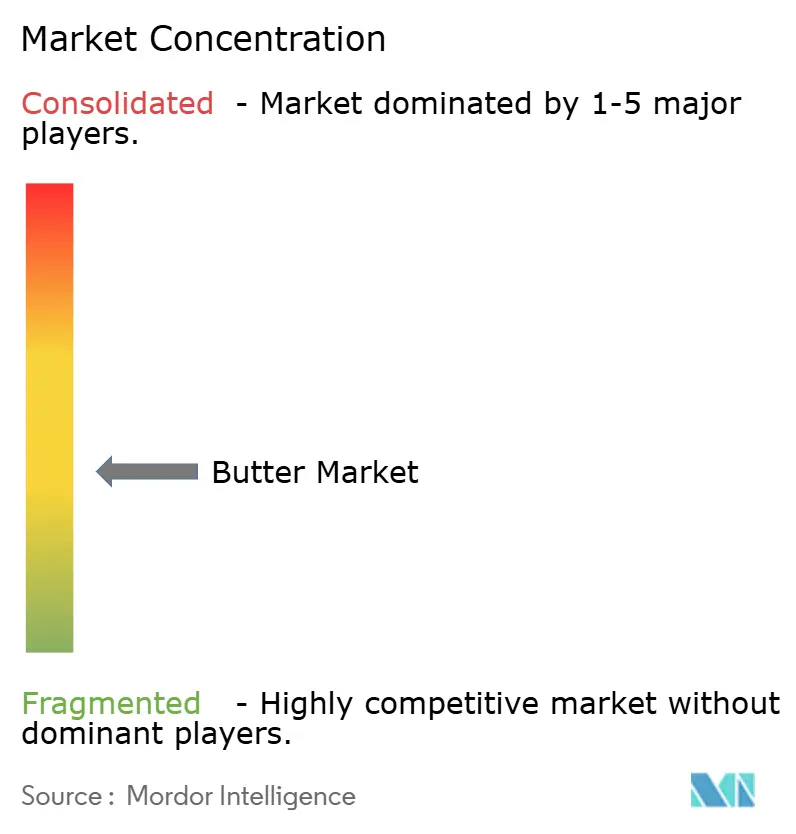
| Market Concentration | Medium |
Major Players
*Disclaimer: Major Players sorted in no particular order Image © Mordor Intelligence. Reuse requires attribution under CC BY 4.0. |
|
Butter Market Analysis by Mordor Intelligence
The global butter market size was valued at USD 46.95 billion in 2025 and estimated to grow from USD 49.17 billion in 2026 to reach USD 61.99 billion by 2031, at a CAGR of 4.74% during the forecast period (2026-2031). The butter market exhibits steady growth driven by traditional household demand and new premium product segments, enabling it to maintain stability compared to the price fluctuations seen in other dairy commodities. Also, major cooperatives continue to channel milk fat away from bulk cream and toward higher-margin butter SKUs, thereby strengthening processor pricing power and justifying fresh capacity investments. Besides, premiumisation further supports value creation, as origin-specific stories and small-batch claims move butter from an anonymous pantry staple to a product that signals craftsmanship at retail. Alongside these shifts, the butter market benefits from home-baking enthusiasm and long-term supply contracts between dairies and commercial bakeries, which collectively shield processors from short-term input volatility and encourage stable capital allocation within the butter market.
Key Report Takeaways
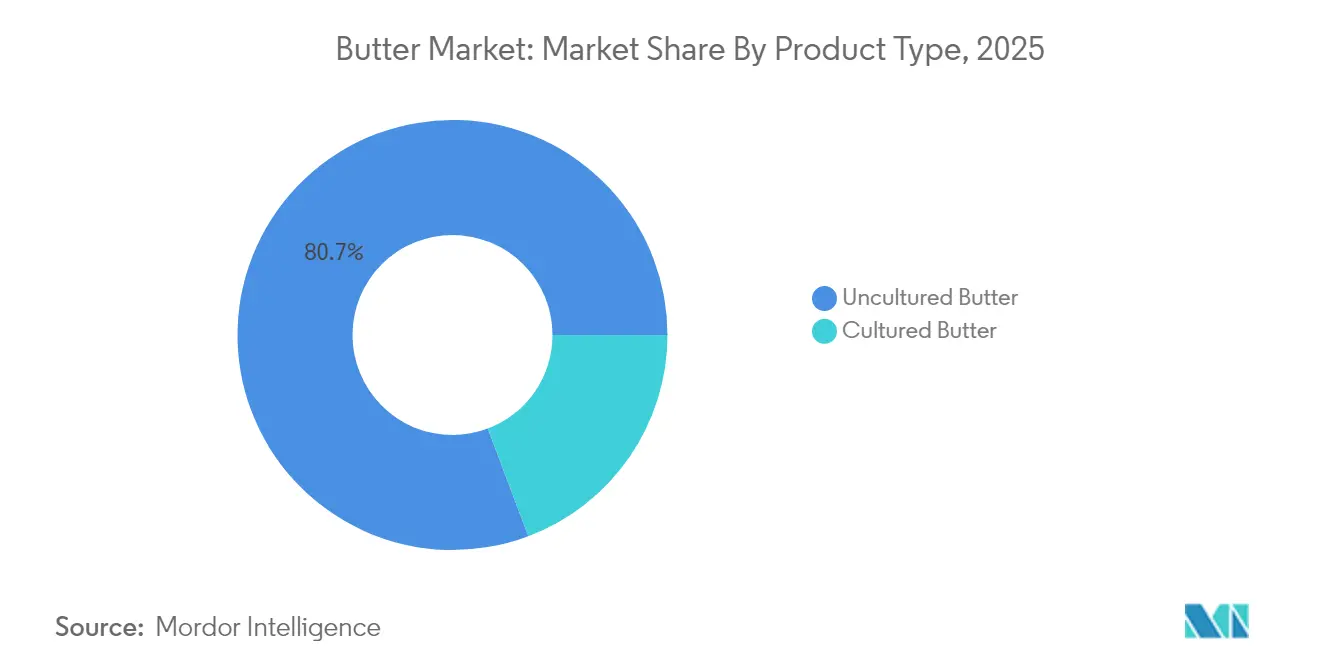
- By product type, uncultured butter accounted for 80.74% revenue share in 2025, and cultured butter is forecast to expand at a 5.69% CAGR through 2031.
- By source, animal-based held a 91.85% butter market share in 2025, and plant-based butter analogs are projected to grow at a 9.15% CAGR to 2031.
- By salt content, salted butter captured 63.72% of the butter market size in 2025, and unsalted butter is forecast to expand at a 4.86% CAGR between 2026 and 2031.
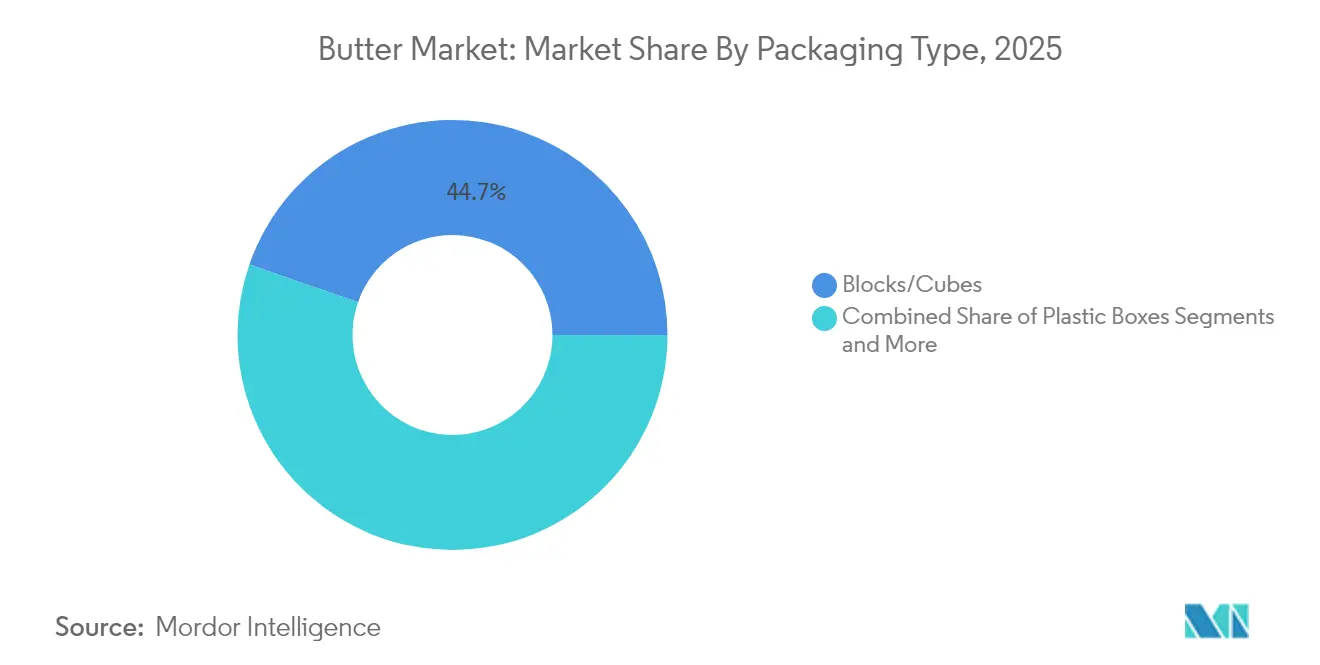
- By packaging type, blocks and cubes led with 44.68% butter market share in 2025, while plastic boxes are slated to grow at 4.88% CAGR over the forecast horizon.
- By distribution channel, off-trade channels represented 77.05% of global revenue in 2025, while on-trade channels are positioned to expand at a 5.12% CAGR through 2031, reflecting shifting access patterns in the butter market.
- By geography, Europe commanded 34.10% of global revenue in 2025, whereas Asia-Pacific is projected to post the fastest regional CAGR at 5.49% to 2031.
Note: Market size and forecast figures in this report are generated using Mordor Intelligence’s proprietary estimation framework, updated with the latest available data and insights as of 2026.
Global Butter Market Trends and Insights
Drivers Impact Analysis*
| Driver | (~) % Impact on CAGR Forecast | Geographic Relevance | Impact Timeline |
|---|---|---|---|
| Premium Artisanal Butter Demand in the Bakery Channel | +1.2% | North America, Europe, Australia | Medium term (2-4 yrs) |
| Surge in Product Innovation and Packaging Efforts | +0.8% | Global; strongest in North America & Europe | Medium term (2-4 yrs) |
| Rising Demand for Natural and Organic Food Products | +1.0% | Global; led by developed markets | Long term (≥4 yrs) |
| Menu-innovation Push by QSR’s | +0.6% | Global urban centers | Short term (≤2 yrs) |
| Growing Popularity of Home Baking and Cooking | +0.5% | Global, with emphasis on developed markets | Medium term (2-4 yrs) |
| Growing Culinary Tourism and Globalization of Cuisines | +0.4% | Global, with strongest impact in tourist destinations | Medium term (2-4 yrs) |
| Source: Mordor Intelligence | |||


Premium Artisanal Butter Demand in the Bakery Channel
Artisanal butter products command substantial price premiums, often several multiples above mainstream offerings, yet bakery buyers continue to absorb the higher cost because flavor differentiation boosts product value downstream. Both independent and chain bakeries report that customers request information about the butter source used in pastries, demonstrating that butter origin has evolved into a key differentiator rather than an undisclosed ingredient. Manufacturers have responded by producing small-batch cultured variants, rolling out laminated formats optimised for croissant production, and highlighting single-breed or pasture-specific claims. The improved demand visibility for high-fat, low-moisture butter has enabled dairies to plan their production schedules more efficiently. The companies are offering new artisan butter products in the butter market to cater to the rising demand. For instance, Chef Nuno Bergonse and his wife Raquel established Manteiga Boua, an artisanal butter manufacturing operation, in Almancil. The product portfolio encompasses diverse flavor variants.
Rising Demand for Natural and Organic Food Products
The butter market is experiencing significant changes due to increasing consumer demand for clean-label products, with natural and organic varieties growing at double-digit rates compared to conventional products. This transformation aligns with broader food market trends where consumers actively seek products with clear ingredient transparency and minimal processing methods. Organic Valley's strategic expansion through the addition of more than 100 new family farms to its cooperative in 2024 directly addresses this increased market demand while emphasizing the fundamental relationship between sustainable farming practices and superior product quality. The continuous growth in the premium segment reflects consumers' increasing willingness to pay higher prices for products they perceive as healthier and environmentally sustainable. This consumer behavior trend is particularly prominent among younger demographic groups and higher-income households, creating substantial opportunities for product development and positioning that emphasize comprehensive health benefits and environmental sustainability credentials, driving premium growth in the butter market.
Menu-Innovation Push by QSRs
Quick-service restaurants are expanding butter usage in their menus beyond basic applications to include premium varieties as key differentiators. This creates opportunities for butter manufacturers to develop specialized foodservice formulations that maintain consistency while helping restaurants distinguish their offerings. The trend is particularly prominent in breakfast and bakery segments, where butter quality significantly influences customer perceptions of the final products. High-quality butter enhances the taste, texture, and overall appeal of baked goods, making it a crucial ingredient for foodservice operations. For instance, KFC Japan offers Premium Biscuits incorporating fermented butter from Hokkaido, aligning with its market expansion strategy and Japan's evolving butter market dynamics. The company maintains 1,200 stores across Japan and aims to increase its market presence. This strategic shift demonstrates the increasing recognition of foodservice as a key driver of value and innovation in the butter market.
Growing Popularity of Home Baking and Cooking
The increased adoption of home baking and cooking activities has driven global butter consumption. Consumer migration toward home-prepared meals has generated higher butter demand. This trend persists as consumers select home cooking due to health advantages and cost efficiency. According to the Agriculture and Horticulture Development Board, in 2024, 11% of survey respondents in the United Kingdom engaged in baking activities weekly, while 20% participated in baking monthly, demonstrating consistent consumer engagement in home baking [1]Agriculture and Horticulture Development Board, "Baking Trends in 2024", ahdb.org.uk. Additionally, social media platforms, specifically TikTok's "butter board" trend, have increased butter's market penetration and influenced consumer behavior toward butter-based food preparation. Manufacturers have implemented product innovations, including Land O'Lakes' butter balls, to address consumer demand for cooking efficiency. The sustained consumer engagement in home baking and cooking activities continues to drive butter market growth. This trend further strengthens the butter market.
Restraints Impact Analysis*
| Restraint | (~) % Impact on CAGR Forecast | Geographic Relevance | Impact Timeline |
|---|---|---|---|
| Competition from Other Alternatives | -0.9% | North America, Europe, Australia | Long term (≥4 yrs) |
| Climate-driven Milk-Supply Volatility | -1.1% | Global; acute in Oceania & Europe | Long term (≥4 yrs) |
| Saturated-fat Labeling Tightening Laws Hinder its Growth | -0.6% | North America, Europe | Medium term (2-4 yrs) |
| Environmental and Sustainability Issues | -0.8% | Global, with strongest impact in developed markets | Long term (≥4 yrs) |
| Source: Mordor Intelligence | |||
Climate-driven Milk-Supply Volatility
Weather-related disruptions in global milk production are significantly affecting butter availability and prices worldwide. The impact is particularly evident in butter prices across the European Union, which increased by 19% from October 2023 to October 2024. These substantial price fluctuations create operational challenges for food manufacturers and bakeries that depend on stable butter supplies and predictable prices for their production planning and cost management. The supply constraints are further intensified by reduced milk production in major exporting regions, creating additional market pressure. For instance, Australia has reached "peak milk," indicating a structural decline in production capacity, which has substantially increased its reliance on dairy imports to meet domestic demand. The persistent supply-demand imbalance in the global butter market presents strategic opportunities for producers with established milk supply chains and robust price management systems to maintain butter market stability.
Environmental and Sustainability Issues
Environmental and sustainability factors impact the butter market operations, primarily through dairy farming's carbon emissions, water consumption, and soil quality deterioration. Consumer awareness regarding the environmental effects of dairy products has increased monitoring of butter production processes. Manufacturers have implemented sustainable operations, including procurement from grass-fed cattle, adoption of recyclable packaging, and reduction of methane output. The market demonstrates increased demand for plant-based butter substitutes, indicating a shift toward environmentally efficient products. In developed markets, companies implementing sustainability measures demonstrate market growth. For instance, Fonterra, one of the world's largest dairy exporters, has committed to reducing on-farm emissions by 30% by 2030 through investments in low-emission farming technologies.
*Our forecasts treat driver/restraint impacts as directional, not additive. The impact forecasts reflect baseline growth, mix effects, and variable interactions.
Segment Analysis
By Product Type: Cultured Butter Gains Premium Edge
Uncultured butter holds a dominant market share of 80.74% in 2025, driven by consumer familiarity and its wide use across retail and foodservice sectors. Cultured butter is experiencing rapid growth with a projected CAGR of 5.69% (2026-2031). This premium segment's expansion stems from its distinct tangy flavor and traditional production methods, which appeal to culinary enthusiasts and health-conscious consumers in developed markets who are willing to pay higher prices. The growth of cultured butter aligns with increasing consumer interest in fermented foods and their potential probiotic properties.
Moreover, manufacturers emphasize traditional production processes and extended fermentation times to differentiate their products. Premium packaging that maintains product quality while emphasizing high-end positioning has become a key competitive factor. As cultured butter transitions from specialty to premium mainstream status, both established manufacturers and artisanal producers can benefit from enhanced profit margins.


By Source: Plant-based Disrupts Traditional Dominance
Animal-based butter holds 91.85% market share in 2025, supported by established production infrastructure and widespread consumer acceptance across global markets. Plant-based butter alternatives represent the fastest-growing segment, with a projected CAGR of 9.15% during 2026-2031, significantly outpacing the overall market growth rate. This growth stems from increasing consumer focus on health, sustainability, and animal welfare, particularly among younger consumers and in environmentally conscious markets.
Moreover, the plant-based segment continues to evolve through technological advancement, as demonstrated by companies like Savor, which has developed methods to produce fats using carbon dioxide, hydrogen, and oxygen without animal or plant inputs. For instance, in May 2025, French luxury pastry brand Maison Linotte launched Purely, a plant-based butter alternative. This product, designed for professional chefs and home bakers, features organic ingredients and excludes palm oil, additives, and common allergens.
By Salt Content: Unsalted Captures Health-Conscious Segment
The salted butter segment holds a 63.72% market share in 2025, maintaining its dominant position due to its versatile applications and flavor enhancement properties. The unsalted segment is projected to grow at a CAGR of 4.86% during 2026-2031, significantly outpacing the overall market growth rate. This growth stems from consumer preferences for products with lower sodium content and specific culinary applications, especially in baking, where salt content control is crucial. The expansion is supported by increased awareness of recommended sodium intake levels and their relationship to heart health.
The unsalted butter segment shows significant growth in health-conscious markets where butter serves primarily as a cooking ingredient. Manufacturers have adapted by introducing premium unsalted products with specific flavor characteristics developed through specialized cultures and production methods. The segment's minimal ingredient composition aligns with clean label preferences. This sustained growth pattern indicates a lasting change in consumer behavior, presenting opportunities for manufacturers to expand their unsalted butter product lines.
By Packaging Type: Innovation Drives Consumer Convenience
Blocks/cubes packaging format holds a dominant 44.68% market share in 2025, driven by its manufacturing efficiency and widespread acceptance across the retail and foodservice sectors. Plastic boxes are experiencing the highest growth rate with a projected CAGR of 4.88% during 2026-2031, exceeding the butter market's overall growth rate. The format's market expansion results from its product protection capabilities, shelf life extension features, and ease of use, particularly for premium butter products requiring flavor preservation.
In addition, sheets/slabs and carton formats maintain substantial market presence, catering to specific usage requirements and regional market preferences. Packaging developments are becoming key market differentiators. Fonterra introduced Anchor Squeezy in June 2024, featuring a butter and rapeseed oil blend in a squeezable bottle format designed for baking applications. In parallel, sustainability initiatives influence packaging decisions, as demonstrated by Cabot Creamery's implementation of packaging containing 30% post-consumer recycled film for its dairy products.
By Distribution Channel: Off-Trade Reshapes Market Access
Off-trade holds a dominant 77.05% market share in 2025, supported by its extensive retail presence and established cold chain infrastructure for butter distribution. The on-trade is experiencing significant growth, with a projected CAGR of 5.12% during 2026-2031, exceeding the overall market growth rate. This expansion stems from pandemic-influenced shopping behavior changes, enhanced cold chain logistics, and the ability to offer diverse premium and specialty butter products. Online retail stores are gaining share as internet penetration. For instance, globally, 6 billion people were using the internet in 2025, according to the International Telecommunication Union .
Convenience stores, specialty stores, and other retail channels maintain their market positions by targeting specific consumer segments. Dairy manufacturers are increasingly implementing direct-to-consumer (D2C) strategies to enhance brand control and customer relationships. This shift responds to digitally-influenced consumer behavior changes and pandemic-driven shopping preferences. Companies adopt D2C approaches to improve profitability and expand market reach by removing intermediaries and reducing distribution costs. While logistics management and competition from plant-based alternatives present challenges, the industry continues to invest in e-commerce and direct sales channels to optimize operations and enhance customer service.
Geography Analysis
Europe holds a 34.10% market share in 2025, supported by traditional butter consumption patterns and advanced dairy infrastructure. The region experiences supply challenges due to climate-related milk production fluctuations, resulting in increased butter prices. In response, European producers continue to expand capacity, as evidenced by Arla Foods' USD 300 million investment across five United Kingdom sites in May 2024. The investment includes upgrades to the Taw Valley site for export enhancement and improvements at Stourton, Aylesbury, and Westbury facilities.
Asia-Pacific shows the highest growth potential with a projected CAGR of 5.49% during 2026-2031, exceeding global market growth rates. This growth stems from increased disposable incomes, urbanization, and Western dietary influence. The expansion of modern retail and e-commerce platforms improves product availability in non-urban areas. Fonterra's expansion of foodservice operations in Asia, particularly in China, indicates the region's strategic importance.
North American butter consumption is increasing as consumers transition to natural, full-fat dairy products, influenced by taste preferences and health perceptions. According to the International Dairy Foods Association data from 2024, 6.5 pounds of butter were consumed per capita in the United States . Also, the region faces supply challenges as dairy producers prioritize cheese production, affecting milk fat availability. The impact of avian influenza on dairy herds has contributed to reduced milk output and higher butter prices. The market continues to develop in premium and specialty butter categories. Moreover, South America and the Middle East & Africa represent emerging markets, with Brazil's food sector benefiting from updated regulations aimed at improving efficiency and competitiveness.

Competitive Landscape
The global butter market maintains moderate concentration, with established multinational dairy cooperatives operating alongside regional producers and new market entrants. Companies in the dairy industry are increasing their manufacturing capacity through facility expansions to address the growing global butter demand and evolving consumer preferences. In October 2023, Ornua expanded its Kerrygold Park facility through a substantial EUR 40 million investment, effectively doubling its butter production capacity from 40,000 to 80,000 tonnes annually. This expansion positions the company to better address the increasing global demand for butter products and strengthens its market presence across the butter industry.
In addition, market opportunities are developing in sustainability, nutrition, and convenience segments. Companies like Savor are creating innovative butter alternatives using advanced carbon capture technology to deliver significant environmental benefits while maintaining essential product functionality and taste profiles.
Moreover, companies are gaining competitive advantages through sophisticated automated production systems that enhance product consistency and reduce operational costs, while implementing comprehensive digital supply chain solutions to effectively manage and mitigate climate-related disruptions. These technological implementations are becoming increasingly critical for maintaining market competitiveness and operational efficiency within the butter industry.
Butter Industry Leaders
-
Ornua Co-operative Ltd.
-
Land O' Lakes, Inc.
-
Arla Foods Amba
-
Fonterra Co-operative Group
-
Groupe Lactalis
- *Disclaimer: Major Players sorted in no particular order

Recent Industry Developments
- April 2025: French dairy giant Lactalis ramped up its production in Brazil, channeling significant investments to amplify cheese and butter output in Minas Gerais. The company earmarked USD 50 million for its Uberlândia facility in the state.
- March 2025: Savor, a US-based food technology startup, has launched a butter product manufactured without animal or plant ingredients. The company uses a proprietary fermentation process that transforms carbon dioxide (CO₂), green hydrogen (GH₂), and methane (CH₄) into structured fats, eliminating the need for traditional agricultural inputs.
- January 2025: Anchor Food Professionals introduced 100% recyclable mini butter portions in the Middle East. This launch, featuring butter made from grass-fed New Zealand milk, emphasizes sustainability, quality, and convenience for the industry.
- November 2024: Springfield Creamery has launched Nancy's Organic Butter under its Nancy's Probiotic Foods product line. The butter, manufactured from organic cultured cream through a controlled churning process, is available in Sea Salted and Unsalted variants.


Research Methodology Framework and Report Scope
Market Definitions and Key Coverage
Our study defines the global butter market as the value generated from sales of churned dairy butter, cultured or uncultured, sold through retail, food-service, and industrial channels in solid or spreadable forms. Currency is expressed in current-year USD, and we treat clarified ghee, butter-oil, plant-based analogs, and blended fat spreads as adjacent but separate categories.
Scope Exclusion: We do not include revenue from ghee, margarine, vegan or nut butters, or butter embedded as an ingredient inside composite processed foods.
Segmentation Overview
-
By Product Type
- Cultured Butter
- Uncultured Butter
-
By Source
-
Animal Based
- Cow-milk
- Buffalo-milk
- Goat and Sheep-milk
- Other Animal Based
- Plant-based Butter Analogs
-
Animal Based
-
By Salt Content
- Salted
- Unsalted
-
By Packaging Type
- Blocks/Cubes
- Plastic Boxes
- Others (Sheet/slabs, cartons, etc.)
-
By Distribution Channel
-
Off-Trade
- Supermarkets / Hypermarkets
- Convenience and Grocery Stores
- Specialty Stores
- Online Retail Stores
- Other Distribution Channels
- On-Trade
-
Off-Trade
-
By Geography
-
North America
- United States
- Canada
- Mexico
- Rest of North America
-
Europe
- Germany
- France
- United Kingdom
- Netherlands
- Italy
- Sweden
- Poland
- Belgium
- Spain
- Rest of Europe
-
Asia-Pacific
- China
- India
- Japan
- Australia
- South Korea
- Indonesia
- Thailand
- Singapore
- Rest of Asia-Pacific
-
South America
- Brazil
- Argentina
- Chile
- Colombia
- Peru
- Rest of South America
-
Middle East and Africa
- United Arab Emirates
- South Africa
- Nigeria
- Saudi Arabia
- Egypt
- Morocco
- Turkey
- Rest of Middle East and Africa
-
North America
Detailed Research Methodology and Data Validation
Primary Research
We validate desk findings through interviews with dairy processors, cold-chain distributors, bakery formulators, and large retailers across North America, Europe, Asia-Pacific, South America, and the Middle East. Respondents clarify trade-class price gaps, fat-content preferences, and channel mix, letting us close data voids and refine elasticity assumptions.
Desk Research
We begin with public datasets such as FAOSTAT milk output, OECD-FAO dairy trade tables, USDA tariff files, and Eurostat extraction ratios, which let us map regional butter supply and trade. National nutrition surveys, HS-0405 customs flows, and retail scanner feeds further anchor consumption volumes and average shelf prices. This is where Mordor Intelligence differentiates by insisting that only audited, non-paywalled metrics seed the first model pass.
Next, we pull company splits and capacity plans from D&B Hoovers, news wires on Dow Jones Factiva, and stock exchange filings, then marry those with demand signals from bodies such as the American Bakers Association and FoodDrinkEurope. Patent activity tracked on Questel and government food price indices help us sense technology shifts and inflation trends. The sources named are illustrative only, with many other yearbooks, shipment dashboards, and investor decks enriching the workbook.
Market-Sizing & Forecasting
Our model starts with a top-down reconstruction of regional butter supply using milk-fat availability and churning yields, aligned to import-export reconciliations. We then run a sampled bottom-up check built from manufacturer shipment audits and wholesale average selling prices to spot variance. Key variables include per-capita butter intake, retail price inflation, bakery output indices, raw-milk yield growth, and food-service penetration. Multivariate regression combined with scenario analysis projects these drivers through 2030, and expert consensus parameters temper extreme outcomes. Where data gaps remain for smaller countries, we apply regional proxy ratios and note every adjustment.
Data Validation & Update Cycle
Analysts perform tiered error scans, variance thresholds, and peer reviews before sign-off. We revisit the model each year, while interim updates trigger when milk price shocks, tariff revisions, or major capacity additions break preset bands. A final pre-publication sweep ensures clients receive the latest calibrated view.
Why Our Butter Market Baseline Commands Reliability
Decision-makers often see very different butter values in the public domain, and we explain why results diverge.
Gaps usually stem from scope choices, base-year timing, currency conversions, or refresh cadence.
Benchmark comparison
| Market Size | Anonymized source | Primary gap driver |
|---|---|---|
| USD 29.08 B (2025) | Mordor Intelligence | - |
| USD 41.67 B (2024) | Global Consultancy A | Bundles butter with dairy spreads and plant-based substitutes |
| USD 52.59 B (2022) | Industry Journal B | Older baseline rolled forward without retail shrinkage factors |
| USD 27.84 B (2024) | Research Publisher C | Focuses on bulk blocks, excludes food-service and artisanal channels |
The comparison shows that our disciplined scope selection, current-year refresh, and dual-path validation deliver a balanced, transparent figure clients can trace to clear variables and repeatable steps.


Key Questions Answered in the Report
What is the projected global butter market size by 2031?
The market is expected to reach USD 61.99 billion by 2031.
How fast will the butter industry grow between 2026 and 2031?
Revenue is forecast to advance at a 4.74% CAGR over the period.
Which region will register the fastest butter market growth?
Asia-Pacific is projected to post the highest regional CAGR at 5.49% through 2031, fueled by rising incomes and Western-style baking adoption.
Why is cultured butter gaining traction with consumers?
Cultured butter delivers a tangy flavor profile and artisanal image that resonate with consumers seeking premium differentiation, underpinning its projected 5.69% CAGR to 2031.
Page last updated on:


