Aquaculture Products Market Size and Share
Market Overview
| Study Period | 2021 - 2031 |
|---|---|
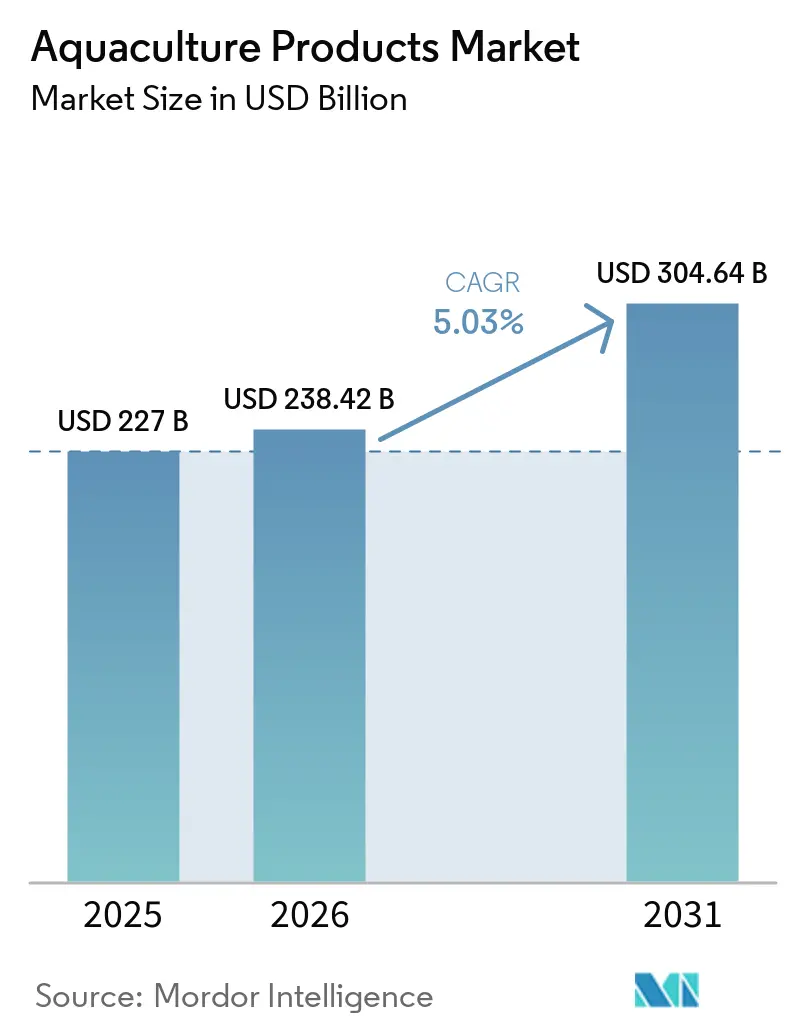
| Market Size (2026) | USD 238.42 Billion |
| Market Size (2031) | USD 304.64 Billion |
| Growth Rate (2026 - 2031) | 5.03% CAGR |
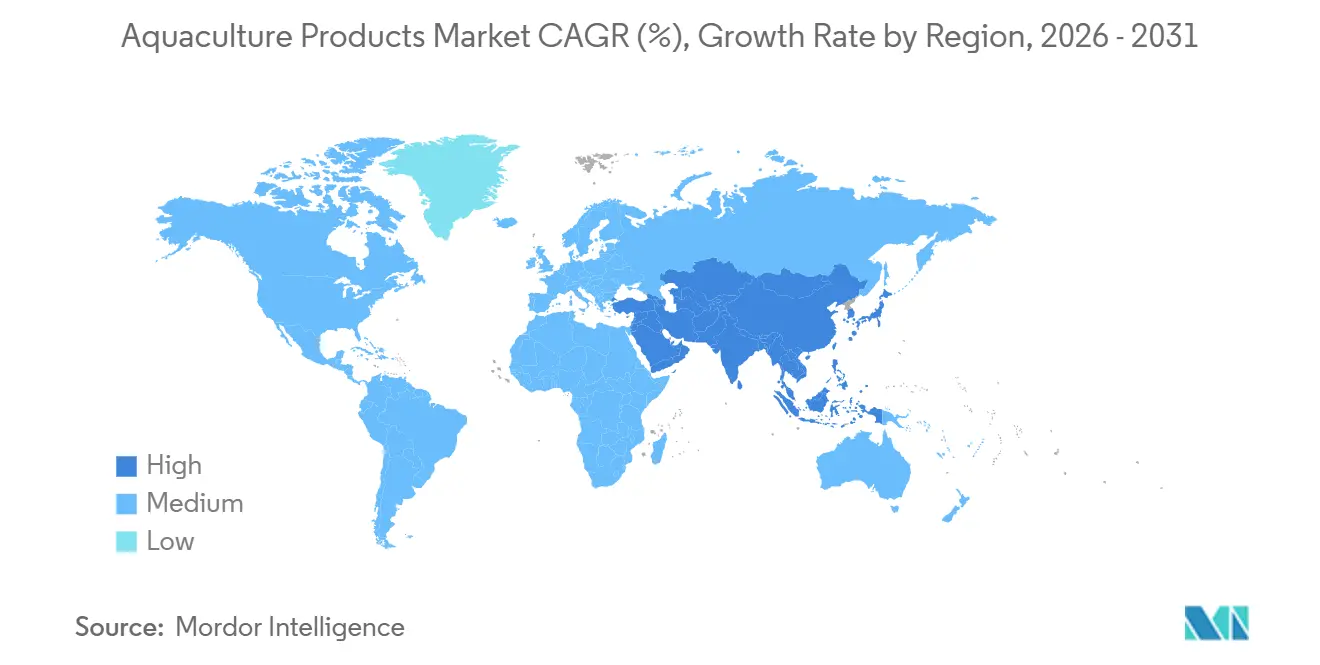
| Fastest Growing Market | Middle East |
| Largest Market | Asia-Pacific |
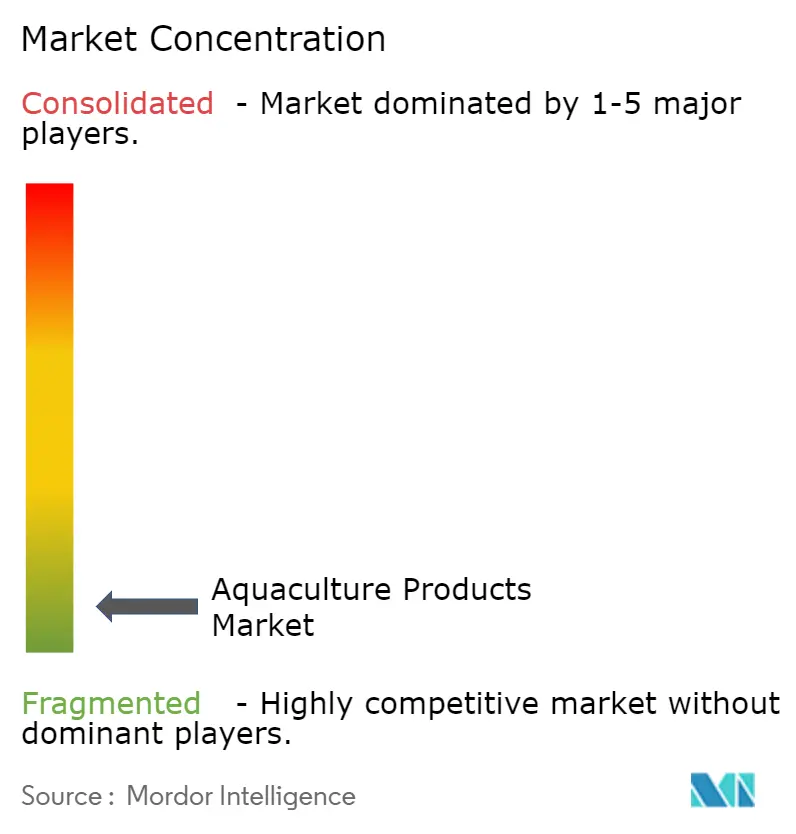
| Market Concentration | Low |
Major Players *Disclaimer: Major Players sorted in no particular order Image © Mordor Intelligence. Reuse requires attribution under CC BY 4.0. | |
Aquaculture Products Market Analysis by Mordor Intelligence
The aquaculture products market size was valued at USD 227 billion in 2025 and is projected to grow from USD 238.42 billion in 2026 to USD 304.64 billion by 2031, at a CAGR of 5.03% during 2026-2031. This growth is driven by the increasing dominance of farmed aquatic animal production. According to the Food and Agriculture Organization, aquaculture is projected to account for 56% of total global fisheries and aquaculture production by the year 2034, significantly influencing the global seafood supply chain. The Food and Agriculture Organization also reported that global aquaculture output reached 104.1 million metric tons in 2025, up from 101.4 million metric tons in 2024, sustaining demand for feed, equipment, fertilizers, and additives across major producing countries. According to the Ministry of Fisheries, Animal Husbandry and Dairying, the Asia-Pacific region remained the focal point of the aquaculture products market in 2025, with China continuing as a key shrimp producer and India’s fish production reaching 19.7 million metric tons during fiscal year 2024-25. The market is also being shaped by increased investments in formulation science, automation, and health management technologies. These advancements are improving feed efficiency, reducing disease risks, and enhancing environmental performance in intensive farming systems.
Key Report Takeaways
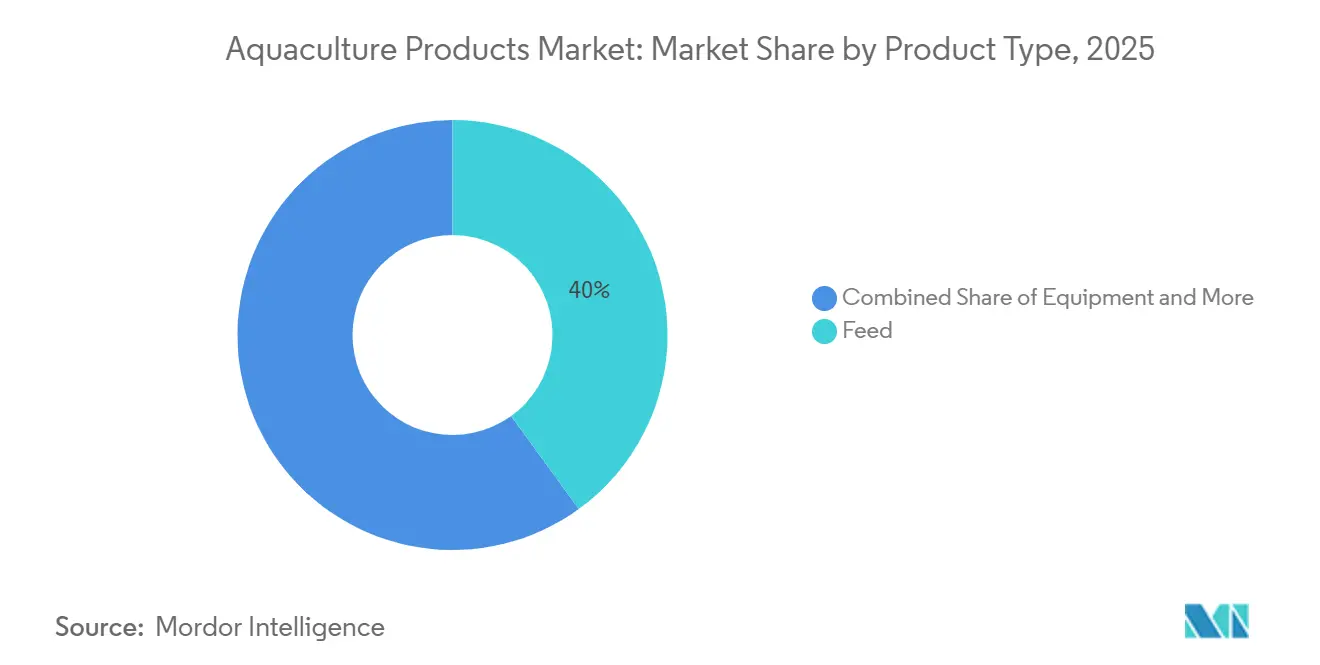
- By product type, the aquaculture products market share for the feed segment accounted for the largest 40.0% in 2025, and the aquaculture products market size for the chemicals and additives segment is projected to grow the fastest at a 13.5% CAGR from 2026 to 2031.
- By culture environment, the aquaculture products market share for the freshwater segment accounted for the largest 55.0% in 2025, while the aquaculture products market size for the marine segment is projected to grow the fastest at a 12.0% CAGR from 2026 to 2031.
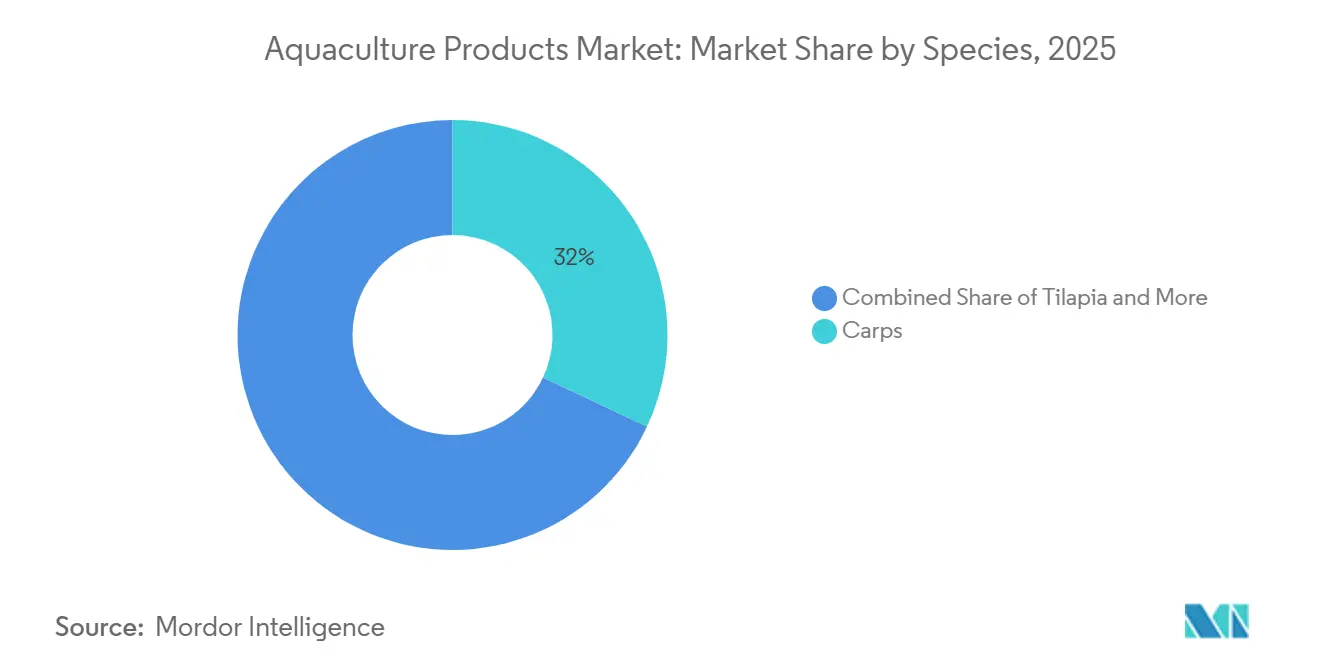
- By species, the aquaculture products market share for the carps accounted for the largest 32.0% in 2025, whereas the aquaculture products market size for the shrimp and prawn segment is advancing at the fastest 11.5% CAGR from 2026 to 2031.
- By geography, the aquaculture products market share for Asia-Pacific accounted for the largest 68.0% in 2025, while the aquaculture products market size for the Middle East is projected to grow the fastest at a 10.6% CAGR from 2026 to 2031.
Note: Market size and forecast figures in this report are generated using Mordor Intelligence’s proprietary estimation framework, updated with the latest available data and insights as of 2026.
Global Aquaculture Products Market Trends and Insights
Drivers Impact Analysis*
| Driver | (~) % Impact on CAGR Forecast | Geographic Relevance | Impact Timeline |
|---|---|---|---|
| Rising seafood protein demand | +1.5% | Global | Short term (≤ 2 years) |
| Declining wild-capture fish stocks | +0.8% | Global, strongest in Asia-Pacific and Europe | Medium term (2-4 years) |
| Government incentives for sustainable fish farming | +0.8% | Global, particularly Asia-Pacific, North America, and Middle East | Medium term (2-4 years) |
| Recirculating aquaculture systems and automation adoption | +0.7% | Asia-Pacific, North America, and Europe | Medium term (2-4 years) |
| AI-enabled precision feeding and biomass analytics | +0.5% | Asia-Pacific, Europe, and North America | Long term (≥ 4 years) |
| Blue-carbon and nutrient-credit monetization for low-emission farms | +0.3% | Asia-Pacific and Europe | Long term (≥ 4 years) |
| Source: Mordor Intelligence | |||
Rising Seafood Protein Demand
According to the Food and Agriculture Organization, global per capita fish consumption reached 21.3 kilograms annually in 2024, with aquaculture contributing 12.3 kilograms per capita[1]Source: Food and Agriculture Organization of the United Nations, “Fish and Other Aquatic Products,” fao.org . This underscores the increasing preference for farmed seafood. The Agricultural Outlook 2025-2034, published by the Food and Agriculture Organization and the Organization for Economic Co-operation and Development, forecasts a 13% rise in global aquatic food demand over the next decade, with Africa projected to experience the highest growth at 24%. In the aquaculture products market, this trend is driving demand for feed, health products, water-quality solutions, and monitoring technologies, particularly in salmon, shrimp, and tilapia farming systems. This is especially evident in Asia, where urbanization and the expanding middle class are fueling higher seafood consumption. Additionally, structured traceability systems and stricter food safety standards in export markets are boosting demand for certified aquaculture inputs and production technologies.
Declining Wild-Capture Fish Stocks
The aquaculture products market is experiencing growth driven by the decline in wild-capture fish stocks. According to the Food and Agriculture Organization (FAO), the Barents Sea cod quota for 2026 has been reduced to 269,440 metric tons, representing a 21% decrease compared to 2025. Similarly, Northeast Atlantic mackerel quotas have dropped by 48% to 299,010 metric tons. In 2025, the FAO reported that farmed cod constituted more than half of Norway’s fresh cod exports, highlighting the ongoing shift from wild capture fisheries to aquaculture-based seafood supply. These trends are increasing the need for aquaculture expansion and boosting demand for related products, including feed, equipment, water treatment systems, and farm chemicals.
Government Incentives for Sustainable Fish Farming
Government policies are playing a significant role in driving demand for aquaculture products, as food security strategies in various countries increasingly recognize aquaculture as a vital source of protein. According to the Ministry of Fisheries, Animal Husbandry and Dairying, India’s Fisheries and Aquaculture Infrastructure Development Fund has a corpus of INR 7,522.4 crore to create and strengthen fisheries and aquaculture infrastructure in the country[2]Source: Press Information Bureau, Government of India, “Fisheries and Aquaculture Infrastructure Development Fund,” pib.gov.in. In the United States, the National Science and Technology Council’s Strategic Plan for Aquaculture Economic Development, published in December 2024, highlighted domestic aquaculture expansion as a national priority, noting that 70% to 85% of seafood consumed by value is imported. Additionally, the Food and Agriculture Organization’s sustainable aquaculture guidelines are increasing compliance requirements, driving demand for standardized feed, water-treatment products, and farm equipment. Public financing support and infrastructure investments continue to bolster commercial aquaculture operations, as supported farms typically procure inputs through more structured supply systems.
Recirculating Aquaculture Systems and Automation Adoption
Recirculating aquaculture systems (RAS) are reshaping the aquaculture products market by enabling high-density production in areas where pond and sea-cage farming models face scalability challenges. Research published in Bioresource Technology Reports in 2025 indicates that modern RAS facilities can reduce labor requirements by 25% to 30%, enhance feed conversion efficiency by 15% to 20%, and decrease energy consumption by 20% to 40%. Commercial seawater RAS facilities for Atlantic salmon are operational in countries such as Denmark, Iceland, China, Canada, the United States, and Poland. This shift significantly benefits the aquaculture products market, as RAS facilities demand greater use of water-treatment systems, monitoring technologies, sensors, and biosecurity inputs compared to traditional farming models.
Restraints Impact Analysis*
| Restraint | (~) % Impact on CAGR Forecast | Geographic Relevance | Impact Timeline |
|---|---|---|---|
| Disease outbreaks and rising biosecurity spending | -0.5% | Global, particularly Asia-Pacific, Europe, and South America | Short term (≤ 2 years) |
| Volatile fishmeal and soy protein costs | -0.4% | Global, strongest in Asia-Pacific and South America | Short term (≤ 2 years) |
| Social license pressure from coastal communities | -0.2% | North America, Europe, and Asia-Pacific | Medium term (2-4 years) |
| Scarcity of marine drug regulatory approvals | -0.2% | Global | Long term (≥ 4 years) |
| Source: Mordor Intelligence | |||
Disease Outbreaks and Rising Biosecurity Spending
Disease poses a significant operational risk in the aquaculture products market, as it can quickly destroy biomass and escalate costs related to prevention and treatment. Researchers from Universidad Andres Bello, Santiago, Chile, reported that a new vapA-absent strain of Aeromonas salmonicida accounted for 88% of polymerase chain reaction (PCR)-positive tissue samples during the first half of 2024. This has raised concerns about the efficacy of older pentavalent vaccines. These disease-related issues are driving up operational expenses for aquaculture producers, while major outbreaks continue to strain farm cash flow, disrupt stocking plans, and hinder overall market growth.
Volatile Fishmeal and Soy Protein Costs
Fluctuations in input costs continue to directly constrain the aquaculture products market, as feed represents the largest operating expense in most production systems. This impact is particularly pronounced in intensive systems, where high-value species require precise nutritional profiles, leaving limited flexibility to accommodate sudden increases in formulation costs. In response, producers may delay expansion plans, reduce the use of premium feed, or opt for lower-cost alternatives, which can diminish short-term demand visibility across the aquaculture products market. This cost volatility underscores the growing importance of feed optimization, alternative proteins, and procurement partnerships as competitive strategies for suppliers.
*Our forecasts treat driver/restraint impacts as directional, not additive. The impact forecasts reflect baseline growth, mix effects, and variable interactions.
Segment Analysis
By Product Type: Feed Anchors Market Share, While Additives Emerge as the Fastest-Growing Pivot
The aquaculture products market share for the feed segment held the largest 40.0% in 2025. This dominance is attributed to the reliance of intensive fish and shrimp farming systems on nutritionally balanced formulations to sustain growth performance, feed conversion, and survival rates. Commercial aquaculture producers are increasingly adopting functional feed containing probiotics, immune-support ingredients, omega-3 enrichment, and alternative proteins to enhance production efficiency and disease resilience. Additionally, export-oriented farms demand traceable and certified feed products to meet retail and international seafood sourcing standards. These factors continue to reinforce the critical role of feed in commercial aquaculture operations worldwide.
The aquaculture products market size for the chemicals and additives segment is projected to grow the fastest at a 13.5% CAGR from 2026 to 2031. The rising demand for water-treatment compounds, disinfectants, probiotics, and health-support additives is driven by the need for stronger disease management and water-quality control in intensive aquaculture systems. The adoption of recirculating aquaculture systems and high-density pond farming has further increased the use of biosecurity products and monitoring solutions. Additionally, equipment is gaining importance as producers invest in automation, aeration systems, and feeding technologies. Fertilizers remain significant in freshwater pond farming, particularly in carp and tilapia production systems, where nutrient management supports productivity in large-scale inland aquaculture operations globally.


By Culture Environment: Freshwater Anchors Volume, Marine Drives Innovation Capital
The aquaculture products market share for the freshwater segment held the largest 55.0% in 2025. Freshwater aquaculture remains the leading contributor to global production, driven by the prevalence of inland pond systems used for farming carp, tilapia, and catfish, particularly in the Asia-Pacific region. Large-scale freshwater operations rely on consistent feed supply, pond fertilizers, aeration systems, and health-management products to ensure stable production. Government-supported aquaculture expansion initiatives and improved access to technical support services are further promoting intensive inland fish farming practices. Freshwater systems are commercially significant due to their relatively lower production costs and greater accessibility for producers in developing aquaculture economies.
The aquaculture products market size for the marine segment is projected to grow the fastest at a 12.0% CAGR from 2026 to 2031. Marine aquaculture is advancing through offshore salmon farming, seawater recirculating aquaculture systems, and diversification into high-value marine species. Producers are increasingly investing in oxygen management, precision feeding, water-quality monitoring, and automated farm-control systems to support higher stocking densities and meet stricter environmental regulations. Additionally, closed-containment production models are gaining traction as coastal permitting and environmental restrictions tighten in several regions. These developments are driving global demand for advanced aquaculture technologies, biosecurity inputs, and specialized marine feed formulations.
By Species: Carps Provide Scale, Shrimp and Prawn Drive the Value Growth Frontier
The aquaculture products market share for the carps accounted for the largest 32.0% in 2025. Carp farming remains the leading species category due to its well-established production across China, India, Bangladesh, and Southeast Asia. The use of large freshwater pond systems continues to drive demand for feed, fertilizers, aeration systems, and routine farm-management inputs in commercial carp production. Carp farming typically operates at lower production costs compared to premium seafood species, making it widely adopted by small-scale and mid-sized aquaculture producers. Additionally, the segment benefits from strong regional food demand and its extensive integration into inland aquaculture systems within Asia-Pacific's high-volume freshwater farming industry.
The aquaculture products market size for the shrimp and prawn segment is advancing at the fastest 11.5% CAGR from 2026 to 2031. Shrimp farming is increasingly attracting investments in precision feeding systems, pond monitoring technologies, water-treatment products, and biosecurity solutions, as disease exposure and survival management remain critical challenges. Export-oriented shrimp production systems also require enhanced traceability, feed certification, and environmental compliance to meet the standards of premium international seafood markets. Advanced health-management practices and automation technologies are becoming essential as producers aim to achieve better feed conversion, higher productivity, and improved disease resistance in intensive shrimp aquaculture operations worldwide.
Geography Analysis
The aquaculture products market share for Asia-Pacific accounted for the largest 68.0% in 2025. This dominance is attributed to the extensive freshwater and marine farming systems in countries such as China, India, Vietnam, Indonesia, and Bangladesh. The region exhibits high demand for aquafeed, pond-management products, aeration systems, and aquatic animal health inputs. Additionally, large-scale production of shrimp, carp, and tilapia continues to drive the consumption of commercial aquaculture products. Factors such as public financing support, export-oriented seafood industries, and the increasing adoption of intensive farming systems are further promoting the use of advanced aquaculture technologies in the region's commercial fish and shrimp production infrastructure.
The aquaculture products market size for the Middle East is projected to grow the fastest at a 10.6% CAGR from 2026 to 2031. This growth is driven by food-security policies, hatchery expansion projects, and investments in recirculating aquaculture systems aimed at water-efficient fish production. In Europe, the focus remains on sustainable salmon farming, traceability standards, and environmental compliance. South America continues to play a significant role through its export-driven salmon and shrimp industries. Meanwhile, North America is investing in domestic aquaculture expansion through automation and controlled-environment farming systems. These advancements are boosting demand for feed, water-treatment products, monitoring technologies, and biosecurity solutions across global aquaculture production networks.
Europe and South America represent two distinct regional clusters in the aquaculture products market, both influenced by high-value species and stringent operational standards. According to the Food and Agriculture Organization, in Europe, Norway's salmon-focused system remains the largest contributor, with farmed cod gaining prominence in 2025, surpassing half of fresh cod exports. According to the European Commission's 2025 review of global marine fishery resources and the European Union's aquaculture policy, there is a continued emphasis on sustainable aquaculture growth[3]Source: European Commission Joint Research Centre, “Review of the State of World Marine Fishery Resources – 2025,” ec.europa.eu. In South America, Chile faces ongoing disease risks in salmon farming, including the emergence of new Aeromonas salmonicida variants, which complicate health management efforts. Meanwhile, Ecuador's shrimp industry remains strategically significant, driving demand for premium feed, precision tools, and health inputs within its export-oriented production system.

Competitive Landscape
The \aquaculture products market remains fragmented, with major key players such as Cargill, Incorporated, Evonik Industries AG, Nutreco N.V. (SHV Holdings N.V.), BioMar Group A/S, and Thai Union Feedmill Public Company Limited holding strong positions due to their expertise in feed formulation, automation technologies, farm analytics, and aquatic animal health solutions. Competitive differentiation is increasingly driven by digital monitoring, sustainable sourcing, precision feeding systems, and integrated aquaculture management platforms, rather than scale alone. Technology-focused suppliers are gaining importance as intensive farming systems demand higher operational efficiency and improved environmental control.
Vertical integration is becoming increasingly important because large aquaculture companies seek stronger control over feed quality, disease management, and production economics. Suppliers are broadening their capabilities in nutrition, farm software, sensors, genetics, and monitoring technologies to deliver integrated operational ecosystems. Equipment manufacturers are also advancing digital platforms for biomass tracking, automated feeding, and real-time environmental monitoring. Certification requirements and export-market traceability standards favor companies that can ensure consistent formulation quality and provide technical support across multiple regions. These developments are driving strategic partnerships, increased research investments, and deeper integration among feed suppliers, technology providers, and seafood producers worldwide.
Competitive positioning increasingly depends on research capability, sustainability compliance, and integrated production systems rather than solely on production scale. According to the Mowi ASA Annual Report 2024, the company’s feed division generated EUR 1.12 billion (USD 1.21 billion) in revenue during 2024, underscoring the growing significance of vertically integrated aquaculture feed operations. Suppliers are also making significant investments in precision feeding software, recirculating aquaculture technologies, and health-management solutions to support intensive seafood farming systems. Market leadership remains distributed across feed, equipment, genetics, additives, and monitoring technologies, as no single supplier dominates the entire global aquaculture supply ecosystem.
Aquaculture Products Industry Leaders
Cargill, Incorporated
Evonik Industries AG
Nutreco N.V. (SHV Holdings N.V.)
BioMar Group A/S (Schouw & Co.)
Thai Union Feedmill Public Company Limited
- *Disclaimer: Major Players sorted in no particular order

Recent Industry Developments
- February 2026: Thai Union Feedmill Public Company Limited entered into a Memorandum of Understanding (MoU) with the Bangladesh Shrimp and Fish Foundation to enhance aquaculture collaboration across South and Southeast Asia. The agreement emphasizes technology transfer, sustainable shrimp and fish farming, aquafeed development, and the improvement of production standards for species including whiteleg shrimp, black tiger shrimp, giant freshwater prawn, and barramundi.
- December 2025: Mowi ASA and Skretting, the aquaculture feed division of Nutreco N.V., have announced a strategic industrial feed partnership. Under this agreement, Mowi's mills located in Valsneset, Norway, and Kyleakin, Scotland, with a combined production capacity of 700,000 metric tons, will manufacture feed using Skretting's proprietary formulations.
- March 2025: BioMar Group A/S entered into an agreement to acquire full ownership of LetSea, a leading aquaculture research center in Norway. This acquisition aims to enhance innovation in fish feed, waterborne feeding systems, and aquaculture technology development. It also expands BioMar’s research capabilities in fish health, feed ingredients, and seawater production systems.


Global Aquaculture Products Market Report Scope
Aquaculture products consist of aquatic organisms such as finfish, shellfish (including crustaceans and mollusks), and plants like seaweed, which are cultivated and harvested under controlled conditions. These organisms are raised in freshwater, brackish water, or marine environments with interventions such as feeding and protection to enhance production. They are utilized for food, trade, or restoration purposes. The aquaculture products market report is segmented by product type (feed, equipment, fertilizers, and chemicals and additives), by culture environment (freshwater, marine, and brackish water), by species (carps, salmonids, tilapia, shrimp and prawn, mollusks, and other species), and by geography (North America, South America, Europe, Asia-Pacific, Middle East, and Africa). The market forecasts are provided in terms of value (USD).
| Feed |
| Equipment |
| Fertilizers |
| Chemicals and Additives |
| Freshwater |
| Marine |
| Brackish Water |
| Carps |
| Salmonids |
| Tilapia |
| Shrimp and Prawn |
| Mollusks |
| Others |
| North America | United States |
| Canada | |
| Mexico | |
| Rest of North America | |
| South America | Brazil |
| Ecuador | |
| Chile | |
| Rest of South America | |
| Europe | Norway |
| United Kingdom | |
| Russia | |
| Rest of Europe | |
| Asia-Pacific | China |
| India | |
| Vietnam | |
| Indonesia | |
| Rest of Asia-Pacific | |
| Middle East | Saudi Arabia |
| United Arab Emirates | |
| Turkey | |
| Rest of Middle East | |
| Africa | Egypt |
| South Africa | |
| Nigeria | |
| Rest of Africa |
| By Product Type | Feed | |
| Equipment | ||
| Fertilizers | ||
| Chemicals and Additives | ||
| By Culture Environment | Freshwater | |
| Marine | ||
| Brackish Water | ||
| By Species | Carps | |
| Salmonids | ||
| Tilapia | ||
| Shrimp and Prawn | ||
| Mollusks | ||
| Others | ||
| By Geography | North America | United States |
| Canada | ||
| Mexico | ||
| Rest of North America | ||
| South America | Brazil | |
| Ecuador | ||
| Chile | ||
| Rest of South America | ||
| Europe | Norway | |
| United Kingdom | ||
| Russia | ||
| Rest of Europe | ||
| Asia-Pacific | China | |
| India | ||
| Vietnam | ||
| Indonesia | ||
| Rest of Asia-Pacific | ||
| Middle East | Saudi Arabia | |
| United Arab Emirates | ||
| Turkey | ||
| Rest of Middle East | ||
| Africa | Egypt | |
| South Africa | ||
| Nigeria | ||
| Rest of Africa | ||


Key Questions Answered in the Report
What is the current value of the aquaculture products market?
The aquaculture products market stands at USD 238.42 billion in 2026.
Which region leads global demand for aquaculture inputs?
Asia-Pacific led with the largest 68% market share in 2025.
Which product category generates the most revenue?
Feed is the largest product type with 40% aquaculture product market share in 2025 because it remains the biggest cost item in most farming systems.
Which segment is growing the fastest by species?
Shrimp and prawn is the fastest-growing species segment, with an 11.5% CAGR from 2026 to 2031.
Page last updated on:


