
Market Overview
| Study Period | 2021 - 2031 |
|---|---|
| Forecast Data Period | 2026 - 2031 |
| Base Year Market Size (2025) | USD 25.7 Billion |
| Market Size (2026) | USD 27.57 Billion |
| Market Size (2031) | USD 39.18 Billion |
| Growth Rate (2026 - 2031) | 7.28 % |
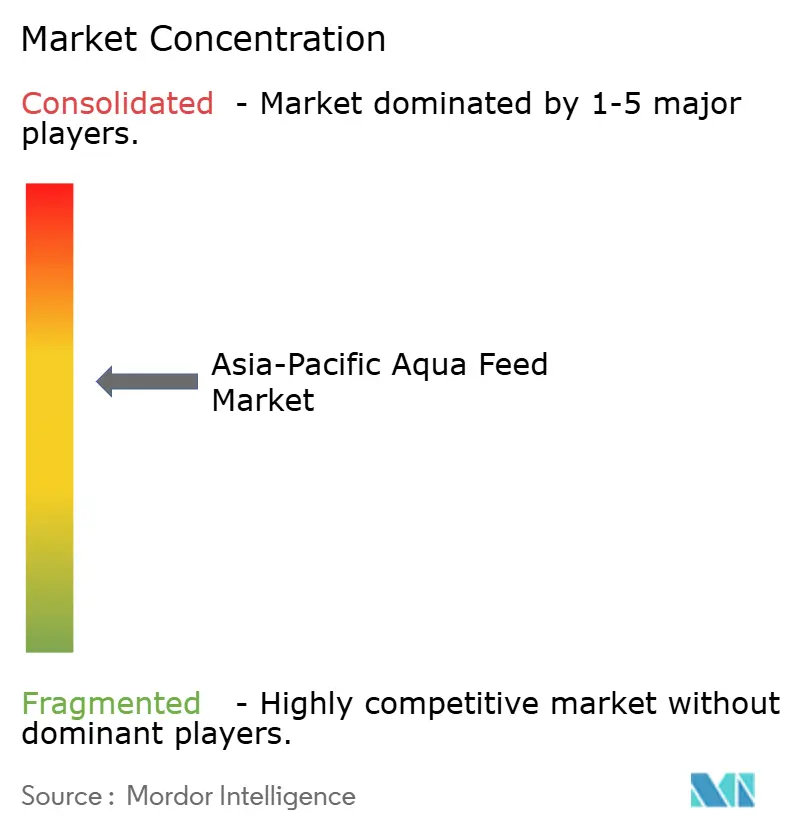
| Market Concentration | Medium |
Major Players *Disclaimer: Major Players sorted in no particular order Image © Mordor Intelligence. Reuse requires attribution under CC BY 4.0. | |
Asia-Pacific Aqua Feed Market Analysis by Mordor Intelligence
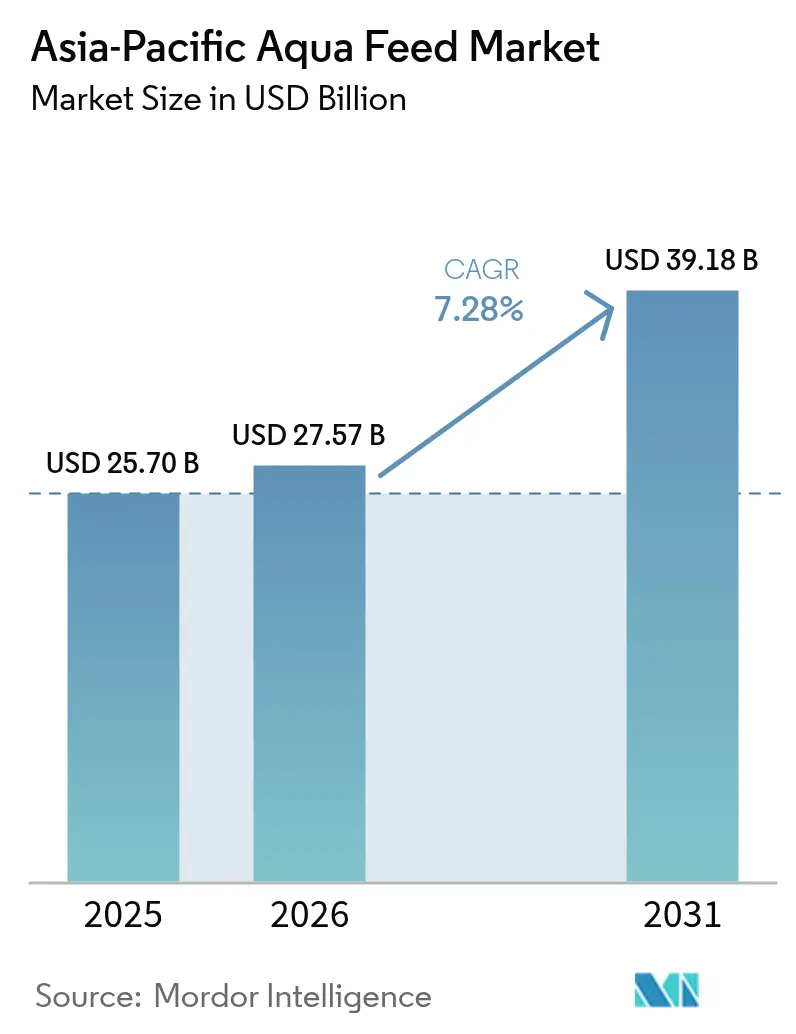
Asia-Pacific aquafeed market size in 2026 is estimated at USD 27.57 billion, growing from 2025 value of USD 25.7 billion with 2031 projections showing USD 39.18 billion, growing at 7.28% CAGR over 2026-2031. This growth is driven by the anticipated increase in consumption of aquatic animal products, with Asia representing the largest market share.[1]OECD, “Aquaculture Production Statistics 2024,” OECD, oecd.org Robust demand emerges from sharply rising fish and shrimp output, tighter government food-security agendas, and a decisive shift toward high-performance feed formulas that limit disease losses and lower environmental footprints. Intensifying production targets in China and India now blend with stronger urban seafood demand, spurring investments in extruded feed technology, functional additives, and precision nutrition research. Meanwhile, soaring ingredient volatility around fishmeal and fish oil propels soybean meal and novel proteins into core feed rations, even as regulators clamp down on phosphorus discharge. Taken together, these forces position the Asia-Pacific aquafeed market for steady value growth while widening the gap between technology-enabled suppliers and purely volume-based producers.
Key Report Takeaways
- By species, fish feed held 51.35% of the Asia-Pacific aquafeed market share in 2025, and crustaceans are advancing at an 8.22% CAGR through 2031.
- By ingredient, soybean meal captured 33.20% of the Asia-Pacific aquafeed market size in 2025, and functional additives are forecast to post a 9.85% CAGR to 2031.
- By form, pellets led with 47.10% revenue share in 2025, and extruded feed is projected to expand at a 9.22% CAGR between 2026 and 2031.
- By geography, China accounted for 42.05% of the Asia-Pacific aquafeed market size in 2025, and India is primed for a 6.84% CAGR to 2031.
Note: Market size and forecast figures in this report are generated using Mordor Intelligence’s proprietary estimation framework, updated with the latest available data and insights as of 2026.
Market Trends and Insights
Drivers Impact Analysis of Asia-Pacific Aqua Feed Market*
| Driver | (~) % Impact on CAGR Forecast | Geographic Relevance | Impact Timeline |
|---|---|---|---|
| Intensifying aquaculture production in China and India | +2.10% | China and India with spillover to Vietnam and Thailand | Medium term (2-4 years) |
| Rising seafood consumption driven by income growth | +1.80% | Urban centers across core Asia-Pacific markets | Long term (≥ 4 years) |
| Advances in nutritionally balanced, species-specific formulations | +1.20% | China, India, and Vietnam | Medium term (2-4 years) |
| Increasing adoption of extruded aquafeed for improved digestibility | +0.90% | China, Thailand, Vietnam, and Indonesia | Short term (≤ 2 years) |
| Government push for integrated multi-trophic aquaculture | +0.60% | India and China with pilot rollouts in Thailand and Vietnam | Long term (≥ 4 years) |
| Expansion of offshore cage farming | +0.40% | China and Vietnam with early interest in Indonesia and Thailand | Long term (≥ 4 years) |
| Source: Mordor Intelligence | |||


Intensifying Aquaculture Production in China and India
China’s aquaculture output in 2024 represented a modest year-over-year rise and underscores Beijing’s policy commitment to diversifying national protein sources. India mirrors that focus but wrestles with disease-linked losses each year. Larger pond stocking densities and expanding shrimp estates, therefore, compel feed makers to deliver higher amino-acid precision and stronger immune additives. Local supply chain investments in Vietnam and Thailand benefit as regional processing hubs capture a portion of surging raw-feed demand. Enforcement of stricter ingredient standards by China’s Ministry of Agriculture and Rural Affairs raises compliance hurdles, favoring producers that can document nutrient consistency and traceability.
Rising Seafood Consumption Driven by Income Growth
Seafood demand in the Asia-Pacific is flourishing, lifted by swelling middle-class wallets and fast-urbanizing diets. Domestic buyers across Shanghai, Mumbai, and Jakarta fuel a premium shift that rewards feed with superior digestibility, flavor, and shelf-life performance. As producers command higher farm-gate prices, they allocate bigger budgets toward functional additives that protect stock health, reinforcing a virtuous spending loop for quality formulations. Indonesia’s goal of 2 million metric tons of shrimp output galvanizes local hatcheries, even if timelines appear optimistic in light of infrastructure gaps.
Advances in Nutritionally Balanced, Species-Specific Formulations
Research showing 15-20% feed-conversion improvement through tailored amino-acid profiles is accelerating precision nutrition adoption. Probiotics such as Bacillus coagulans increasingly feature in Asian formulas to fortify gut health and lower antibiotic reliance. SHV Holding's (Skretting) Hezhoubei facility exemplifies deep investment in local species trials, while phosphorus-discharge caps push formulators to minimize waste without compromising growth. As regulators monitor nitrogen effluent more closely, balanced profiles that raise digestibility become economic necessities. Premium pricing gains acceptance when documented through growth trials, solidifying a shift away from cost-only buying criteria.
Increasing Adoption of Extruded Aquafeed for Improved Digestibility
Extruded feed raises protein digestibility by roughly 10-15% and reduces in-pond disintegration, lowering waste in systems where feed can exceed half of operating costs[2]Bonnie Waycott, “A Singular Focus: Making Single-Cell Proteins a Fixture on the Aquaculture Feed Ingredient Menu,” Global Seafood Alliance, globalseafood.org. Early adopters in Thailand and Vietnam retrofit lines to keep pace with shrimp and finfish farms demanding tighter pellet durability. Output gains translate into faster harvest cycles that justify the unit-cost premium. Regulators also favor extrusion due to improved water quality, limiting feed-loss fines. Suppliers integrating ozone-nanobubble biofloc demonstrate additional water clarity and health benefits, widening the performance gap with classic pellet products.
Restraints Impact Analysis of Asia-Pacific Aqua Feed Market*
| Restraint | (~) % Impact on CAGR Forecast | Geographic Relevance | Impact Timeline |
|---|---|---|---|
| Volatile fishmeal and fish-oil prices | -1.40% | China, Vietnam, and Thailand | Short term (≤ 2 years) |
| Disease outbreaks leading to temporary stocking cuts | -1.10% | India, Vietnam, Indonesia, and Thailand | Short term (≤ 2 years) |
| Regulatory caps on phosphorus discharge from feed | -0.70% | China, India, and Vietnam | Medium term (2-4 years) |
| Competition from single-cell protein alternatives | -0.30% | China with gradual regional rollout | Long term (≥ 4 years) |
| Source: Mordor Intelligence | |||
Volatile Fishmeal and Fish-Oil Prices
Spot fishmeal averaged USD 1,504 to USD 1,882 per metric ton in 2024, whipsawing margins and complicating inventory planning. Smaller Asian mills lacking hedging tools scramble for soybean meal substitutions, but carnivorous species still require concentrated marine amino acids. Fish-oil turbulence echoes meal swings and fuels algae-oil pilots despite higher upfront costs. Vietnamese and Thai exporters face thin price flexibility against global buyers, magnifying the squeeze. Broad substitution accelerates R&D toward microbial and insect oils that soothe price shocks but retain essential fatty-acid profiles.
Disease Outbreaks Leading to Temporary Stocking Cuts
Annual disease losses in India underscore biosecurity gaps that ripple across feed demand. Tilapia Parvovirus flare-ups compel emergency harvests, collapsing local feed call-offs for months. Southeast Asian shrimp ponds confront Aeromonas and Vibrio waves, forcing antibiotic-free remedies and lower stocking densities that depress feed volumes. Recovery periods often stretch 6-12 months as farmers rebuild broodstock and confidence. Yet outbreaks also spur specialty diets fortified with immunostimulants, cushioning losses for agile suppliers.
*Our forecasts treat driver/restraint impacts as directional, not additive. The impact forecasts reflect baseline growth, mix effects, and variable interactions.
Asia-Pacific Aqua Feed Market Segment Analysis
By Species:
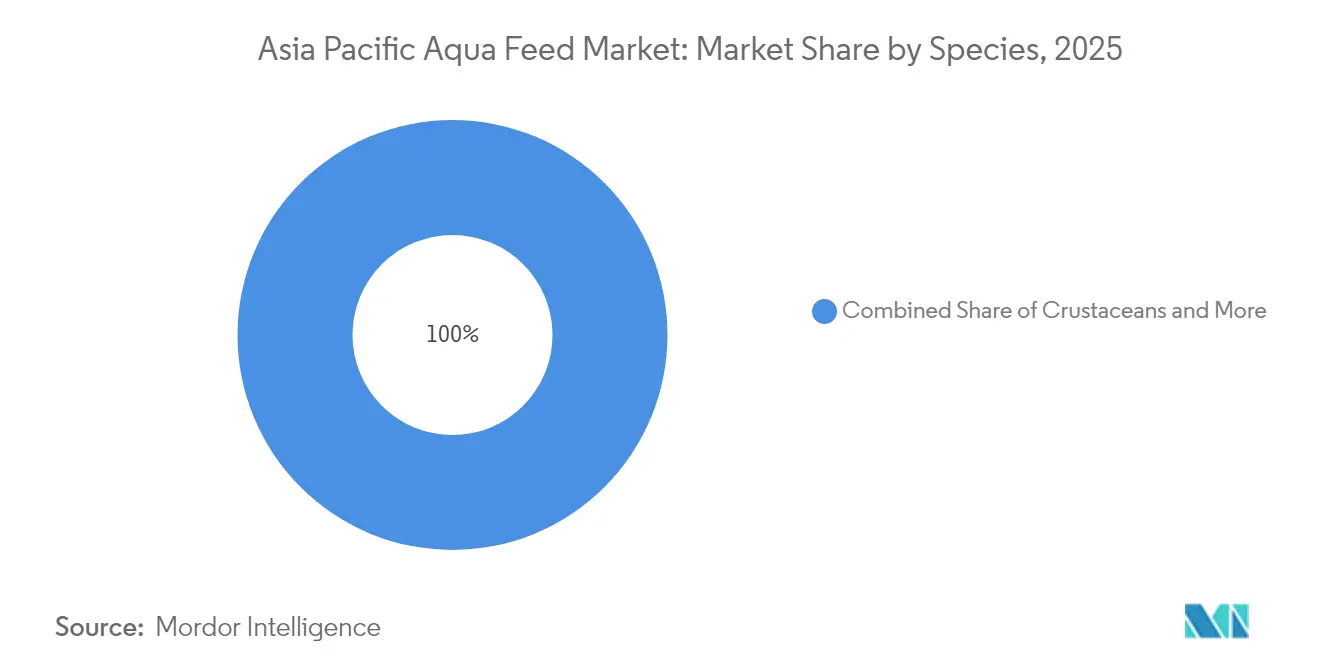
Fish Dominance Drives Volume GrowthFish diets generated 51.35% of the Asia-Pacific aquafeed market share in 2025, confirming the segment’s volume supremacy within the Asia-Pacific aquafeed market. Carp, tilapia, catfish, and diverse marine finfish underpin China’s mammoth output, with each species requiring unique amino-acid ratios to hit optimal feed-conversion benchmarks. The Asia-Pacific aquafeed market size attached to crustaceans remains smaller today, yet is rising quickly as shrimp estates in Vietnam, Thailand, and Indonesia pursue intensification and higher protein feeds. Crustaceans are estimated to grow at the highest rate, with an estimated CAGR of 8.22% from 2026 to 2031, reflecting strong demand momentum.
Mollusk feed sees steady orders from Chinese coastal polyculture schemes that recycle excess nutrients through bivalves. Emerging eel and ornamental species stay in niche but command premium prices, enabling specialty manufacturers to charge higher margins. Precision-nutrition gains, delivering up to 20% feed-conversion efficiencies, allow growers to trim feeding days while lifting survival rates. Producers calibrate vitamin and mineral packs against water-temperature swings to mitigate stress-related diseases. Ultimately, wide species variety ensures sustained tonnage growth while inviting tailored feed niches that cushion producers from commodity price pressure.


By Ingredient:
Soybean Meal Leadership Faces Alternative Protein PressureSoybean meal represented 33.20% of the Asia-Pacific aquafeed market size in 2025 and remains the backbone of many formulations thanks to established logistics networks and attractive protein ratios. Despite this edge, functional additives are projected to capture the fastest incremental value at a 9.85% CAGR (2026-2031) as disease mitigation rises to board-level priority. Fishmeal retains irreplaceable roles for marine carnivores and hatchery diets, though price spikes force partial substitution with corn-gluten meal and poultry by-product hydrolysate. Single-cell proteins, led by Calysta’s methane-fed technology, enter commercial rations for shrimp and freshwater fish in China, reducing reliance on volatile marine inputs.
Microalgae products such as Spirulina and Chlorella widen the functional-nutrition toolkit by delivering pigments, antioxidants, and essential fatty acids that lift flesh coloration and shelf life. Feed makers also explore insect meal sourced from black soldier fly larvae in Thailand and Vietnam, whose chitin content confers gut-health benefits. Suppliers refine enzymes to unlock greater digestibility from plant proteins, slicing inclusion levels of marine raw materials without compromising growth. With sustainability audits expanding across export markets, lower-carbon protein ingredients gain traction and may erode soybean meal’s share over the next decade.
By Form:
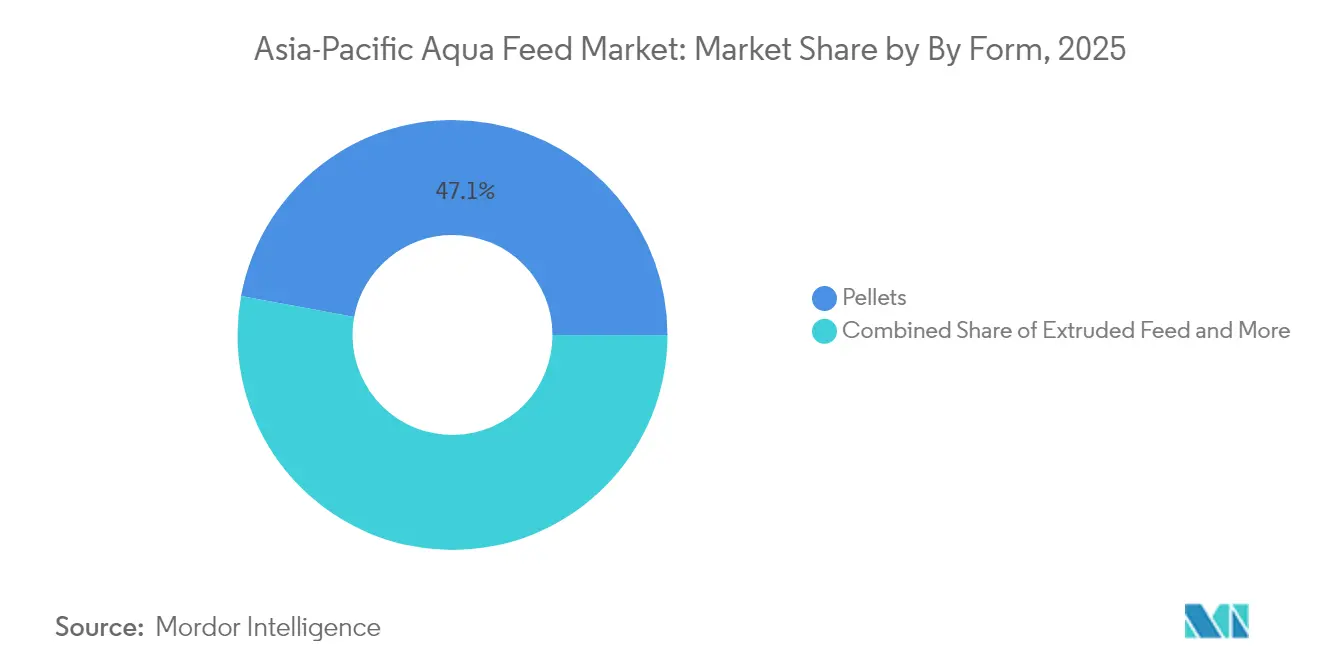
Pellets Maintain Leadership Despite Extruded Feed InnovationPellets controlled 47.10% of 2025 revenue, reflecting the format’s entrenched infrastructure and budget appeal across the Asia-Pacific aquafeed market. Easy manufacturing, broad farmer familiarity, and low power requirements keep pellets popular in semi-intensive ponds. Yet extruded feed, posting a 9.22% CAGR, steadily chips away at that lead. Extrusion expands starch gelatinization, improving protein availability and limiting nutrient leaching, attributes now prized in high-density recirculating aquaculture systems.
Digital twin modeling within modern extrusion plants optimizes temperature and pressure settings, achieving tighter pellet uniformity and lower energy consumption. Powder meal maintains a foothold in hatcheries requiring micro-size particles for larval stages; technology advances now allow cold-set micro-encapsulation of sensitive vitamins. Overall, format diversification supports feed makers’ ability to match differing farming intensities while sustaining margins through value-added specifications.
Geography Analysis
China Aqua Feed Market
China’s aquafeed leadership rests on unmatched output scale, deep ingredient pools, and rising offshore cage projects that stretch technical feed demands. China accounted for 42.05% of the Asia-Pacific aquafeed market in 2025, solidifying its dominance. Government environmental rules now incentivize low-phosphorus feeds, nudging suppliers toward enzyme supplementation and high-digestibility proteins. High-specification shrimp diets form a vibrant premium segment serving Guangdong processors that supply Japanese and U.S. retailers.
India Aqua Feed Market
India’s catch-up path relies on integrated multi-trophic regulations that balance pond ecology, a policy cocktail that pulls novel functional-additive suppliers into the market. India is estimated to grow at a CAGR of 6.84% from 2026 to 2031, driven by increased focus on value-added inputs. Tilapia Parvovirus episodes sharpen India’s appetite for immune-boosting ingredients and real-time pond monitoring tools, embedding quality considerations into procurement norms once driven purely by price.
APAC Aqua Feed Market
Vietnam’s export-oriented industry benefits from free-trade pacts that favor compliance with sustainability certifications, putting pressure on feed makers to provide traceable formulas with lower fishmeal inclusion. The country’s Mekong Delta hubs are increasingly pilot automatic feeding barges that link to cloud-based biomass estimations. Indonesia’s archipelagic geography complicates logistics, yet recent pellet plant investments along Java’s northern coast shorten lead times and curb freight costs. Thailand continues to set regional standards for Good Aquaculture Practices certification, expanding market access and feeding demand for pathogen-controlled feed lots. Smaller Asia-Pacific islands progressively adopt seaweed-and-bivalve integrations, supplying eco-certified stocks to tourism hotspots and adding incremental feed demand for tropical marine fish.
Regulatory Landscape
Across Asia-Pacific, aquafeed regulation is tightening around feed safety, traceability, and environmental compliance, with more reliance on digital systems for filings and proof of conformity. In China, the Ministry of Agriculture and Rural Affairs (MARA) continues to control market access for novel ingredients and registered feed products. In 2026, MARA introduced additional compliance-document requirements into force for agricultural products quality and safety commitment certificates, reinforcing documentation and audit readiness for feed manufacturers and importers.
Cross-border compliance is also becoming more structured. In June 2026, China’s General Administration of Customs (GACC) advanced implementation guidance tied to Decree 280 for overseas producer registration, adding rigor to registration and renewal processes for certain categories. This affects imported feed ingredients and upstream supply chains. In Southeast Asia, ASEAN’s adopted food safety and traceability guidance, including traceability principles aligned with international practices, increases the compliance burden for suppliers serving export-oriented aquaculture. Vietnam’s 2026 move to mandatory self-declaration of domestically produced and imported feed supplements via a government electronic portal adds a practical digital checkpoint for market participation.
Competitive Landscape
The Asia-Pacific aquafeed market sits at moderate consolidation, as the top five firms command the majority of revenue. Charoen Pokphand Foods PCL exploits vertically integrated operations from broodstock to retail-branded seafood, allowing internal feed usage forecasts to align plant scheduling and hedge cost shocks.
Chinese champions Tongwei Group Co., Ltd. cashes in proprietary probiotic strains and AI-driven nutrient modeling, differentiating offerings from generic peers. Norway-based SHV Holdings (Skretting) scales local production in Long An, Vietnam,[3]Skretting, “Our History,” skretting.com to bring European formulation experience closer to Asian grow-out conditions. De Heus Animal Nutrition chips away in Indonesia with modular mill designs that can be expanded in phases, balancing risk and growth.
As integrated producers broaden into branded seafood, feed quality becomes a competitive focal point that links farm survival rates to supermarket shelf margins. Overall, firms that marry nutrient science with digital management tools earn premium pricing power and foster stickier contracts.
Asia-Pacific Aqua Feed Industry Leaders
Charoen Pokphand Foods PCL
Tongwei Group Co., Ltd.
Guangdong HAID Group Co., Ltd.
Cargill, Inc.
New Hope Group
- *Disclaimer: Major Players sorted in no particular order
Asia-Pacific Aqua Feed Market Companies Covered in this Report
- Charoen Pokphand Foods PCL
- Cargill, Inc.
- Tongwei Group Co., Ltd.
- SHV Holdings
- New Hope Group
- ADM
- Alltech
- Guangdong HAID Group Co., Ltd.
- Aller Aqua A/S
- Thai Union Feedmill Public Company Limited.
- De Heus Animal Nutrition
- Avanti Feeds Limited
- IFB Agro Industries Ltd
- Schouw & Co., (Biomar)
- Maruichi Co., Ltd. (Dainichi)
- Godrej Agrovet Limited
- Ridley Corporation Limited.
- Kemin Industries, Inc.

Market Opportunities and Future Outlook
Premiumization and specialization in hatchery and nursery nutrition appear as a notable whitespace as intensification raises the value of survival and early-stage growth performance. A near-term signal comes from BioMar’s February 2026 announcement of a 50,000-tonne capacity expansion at its Wuxi, China facility through a joint venture with Tongwei, with added emphasis on advanced nursery and specialty species feeds. This tracks the region’s shift toward higher-performance formulations and more controlled production systems.
Capacity localization and R&D siting are also shaping competitive positioning, particularly where logistics and ingredient volatility increase delivered-cost risk. Haid Group’s 2026 actions reflect this pattern, combining a new production and R&D facility in Singapore (as a regional hub) with a new 200,000-tonne feed project in Phu Tho Province, Vietnam, focused on tilapia and local species, which improves responsiveness for Southeast Asian aquaculture corridors with shorter lead times. Policy-linked cost and compliance levers are opening incremental operating headroom for farms and pushing manufacturers toward more formalized go-to-market models, including Malaysia’s 2026 Sales and Service Tax (SST) exemption on animal feed raw materials and Vietnam’s 2026 circulars and decrees that formalize management, import, and commercial use of aquafeed and aquatic species, favoring suppliers that can execute permitting and documentation at scale.
Recent Industry Developments in Asia-Pacific Aqua Feed Market
- June 2026: Tongwei Group unveiled the Tongwei Agricultural Development Shrimp Feed Microparticle Production Base at Jiangsu Tongwei and launched its Tongwei Beyond series of shrimp fry feed. The build-out included four high-end fry feed production lines supported by an additional 15 million yuan investment made in 2025, reinforcing Tongwei’s push into higher-value hatchery and early-life-stage nutrition where technical differentiation carries pricing power.
- May 2025: SHV Holdings subsidiary Skretting China opened its first LifeStart production line in Asia at its Zhuhai facility and launched five new hatchery feed products for species including salmon, tilapia, golden pompano, snakehead, and catfish. The launch expands specialized hatchery offerings in China, a key market where performance feeds and tighter quality requirements support a more premium product mix.
- January 2024: Calysta’s FeedKind protein received formal approval from China’s Ministry of Agriculture and Rural Affairs (MARA) for use in aquaculture feeds. The approval enabled broader commercialization in fish and shrimp diets, with distribution through Calysseo (Calysta and Adisseo joint venture) using Adisseo’s China sales network, accelerating adoption pathways for single-cell proteins as alternatives to marine ingredients.


Asia-Pacific Aqua Feed Market Report Scope and Research Methodology
Market Definition and Coverage
This market covers the value of commercial aqua feed sold for farmed aquatic species in Asia Pacific, counted as feed products supplied to aquaculture operations across the covered countries.
Scope exclusions: This sizing excludes on-farm feed made for self-consumption and non-feed farm inputs such as equipment, medicines, and water-treatment products.
Segments Covered in This Report
- By Species
- Fish
- Crustaceans
- Mollusks
- Others (Eels, etc.)
- By Ingredient
- Soybean Meal
- Fishmeal
- Fish-oil
- Functional Additives
- Others (Corn Gluten, etc.)
- By Form
- Pellets
- Extruded Feed
- Powdered Meal
- Liquid Feed
- By Country
- China
- India
- Indonesia
- Vietnam
- Thailand
- Rest of Asia-Pacific
Data Sources, Market Sizing, and Validation
Desk Research
Desk work started with a clean fact base on aquaculture output and feed use in Asia Pacific, then aligned definitions so the measurement units and currencies were consistent across countries. We used public sources such as FAO fisheries and aquaculture statistics, national fisheries or aquaculture departments, customs and trade statistics portals, and published standards and regulations on feed and additives to anchor the demand environment. We also reviewed academic journals on feed conversion and diet formulation (species-specific), along with trade association releases and reputable press for near-term shifts, including fishmeal substitution and periods of fishmeal and fish oil price volatility.
To translate activity into market value, we used a mix of company annual reports, investor presentations, and product catalogs to capture typical feed forms, species focus, and pricing bands, then cross-checked against a paid subscription focused on company financials and news for consistency. For triangulation of cross-border flows, an import and export shipment-level subscription was used selectively to sanity-check movements for key ingredients that can swing feed costs. These desk sources are not exhaustive, and we also consulted other public documents and references to collect, validate, and clarify the data.
Primary Interviews and Surveys
Primary work focused on interviews and structured surveys with feed manufacturers, distributors, and large farming operators, followed by discussions with nutrition and procurement roles who see real purchase behavior. We covered the main producing pockets across APAC so assumptions on feed inclusion, form mix, and pricing were checked against local purchasing patterns, then adjusted when desk inputs looked outdated or too generalized.
Distribution of primary research fieldwork respondents
| Company type | Respondent position |
|---|---|
| Top tier: 27% | CXOs: 15% |
| Mid tier: 51% | Functional/Unit leaders: 31% |
| Smaller Players: 22% | Managers: 54% |
Market-Sizing & Forecasting
The core model used a top-down approach: aquaculture production and species mix were translated into feed demand using practical feed-use ratios, and then feed demand was priced using observed regional price bands by feed form. After building the demand pool, we corroborated it with selective bottom-up approximations, such as rolling up sampled supplier revenues by country and checking whether the implied volumes were consistent with channel feedback, before final totals were locked.
Key inputs used in the model included aquaculture output by major species, typical feed conversion ratios and feeding intensity by culture stage, the split between pellets and extruded feed in commercial diets, ingredient-driven cost movement (fishmeal, fish oil, and plant protein substitution), and country-level adoption of functional additives that can lift average selling prices. Where direct country splits were not consistently available, we handled gaps using production-weighted allocation and then rechecked the split through interviews with regional sales and procurement respondents.
For forecasting, we ran scenario analysis and then anchored it with a simple multivariate regression on drivers that interviewees repeatedly connected to feed demand, mainly farmed output growth, feed price movement, and intensity shifts toward higher-value species. Assumptions were tightened in the later years by applying realistic limits on ASP progression and by checking that implied feed demand did not exceed plausible farming capacity growth.
Data Validation & Update Cycle
Validation used multiple checks to keep the final numbers consistent with how the Asia Pacific aqua feed market operates. Model outputs were compared against independent signals such as production trends, trade movement of key ingredients, and company-level revenue direction, then outliers were investigated before sign-off. A second analyst review was used to re-check definitions, currency treatment, and year alignment, and when large mismatches appeared, respondents were re-contacted to confirm what changed and why.
Reports are refreshed annually, and interim updates are triggered when major events can materially shift feed demand or pricing, such as sudden disease outbreaks, policy changes, or large ingredient price shocks observed in the ingredient supply chain. Before delivery, a final pass is completed so the view reflects the latest data available at that time.
Mordor Intelligence's Asia Pacific Aqua Feed Market Size Versus Other Published Estimates
Published market sizes for Asia Pacific aqua feed often differ because firms do not always count the same countries, product boundaries, and pricing points, and they can also use different base years. Differences also show up when one study covers only a narrower product view, while another adds adjacent categories or uses broader assumptions that are not tested against on-ground buying behavior.
Production trends by key species and the observed shift toward pellets and extruded feed, followed by price-band checks with regional interviews, are the evidence points that tie Mordor Intelligence's 2025 value to an explained feed demand pool rather than a single revenue proxy. When the scope is widened to include additional APAC countries not covered here, or when value is inferred mainly from additive-focused sub-segments, the totals can move materially even if the underlying growth story appears similar.
Benchmark comparison
| Source | Market Size | Gaps in Research Methodology |
|---|---|---|
| Mordor Intelligence | USD 25.70 B (2025) | |
| Industry Publisher A | USD 21.34 B (2024) | Uses an earlier base year and a different time window, and the estimate is presented at a broader regional level without the same country-scope boundary and feed-form price-band checks. |
| Data Book B | USD 31.84 B (2022) | Built from a scope that leans toward ingredient and additive sub-segments, and the value base year is earlier, which can inflate comparisons if later-year pricing and form mix are not normalized. |
The comparison shows that year choice and what gets counted as aqua feed are the biggest drivers behind the spread in published values. By keeping the country scope explicit, separating feed forms in pricing, and rechecking assumptions with primary inputs, the final number stays traceable to repeatable steps that a client can follow and stress-test.


Key Questions Answered in the Report
How large is the Asia Pacific aquafeed market today?
The market is valued at USD 27.57 billion in 2026 and is projected to reach USD 39.18 billion by 2031.
Which species segment uses the most feed across Asia Pacific?
Fish diets represent 51.35% of total feed value, making them the largest consuming segment.
What ingredient dominates Asia Pacific feed formulations?
Soybean meal leads with a 33.20% share, though functional additives are the fastest-growing category.
Why are extruded feeds gaining popularity?
Extruded pellets improve protein digestibility by 10-15% and reduce waste, which lowers overall production costs.
What is driving interest in single-cell proteins?
Regulatory approval in China and more predictable pricing than fishmeal makes single-cell proteins an attractive alternative.
Page last updated on:


 Your data is secure and never sold or shared.


