
Market Overview
| Study Period | 2021 - 2031 |
|---|---|
| Forecast Data Period | 2026 - 2031 |
| Base Year Market Size (2025) | USD 7.28 Billion |
| Market Size (2026) | USD 7.65 Billion |
| Market Size (2031) | USD 9.84 Billion |
| Growth Rate (2026 - 2031) | 5.14 % |
| Market Concentration | High |
Major Players
*Disclaimer: Major Players sorted in no particular order Image © Mordor Intelligence. Reuse requires attribution under CC BY 4.0. |
|
Europe Aquafeed Market Analysis by Mordor Intelligence
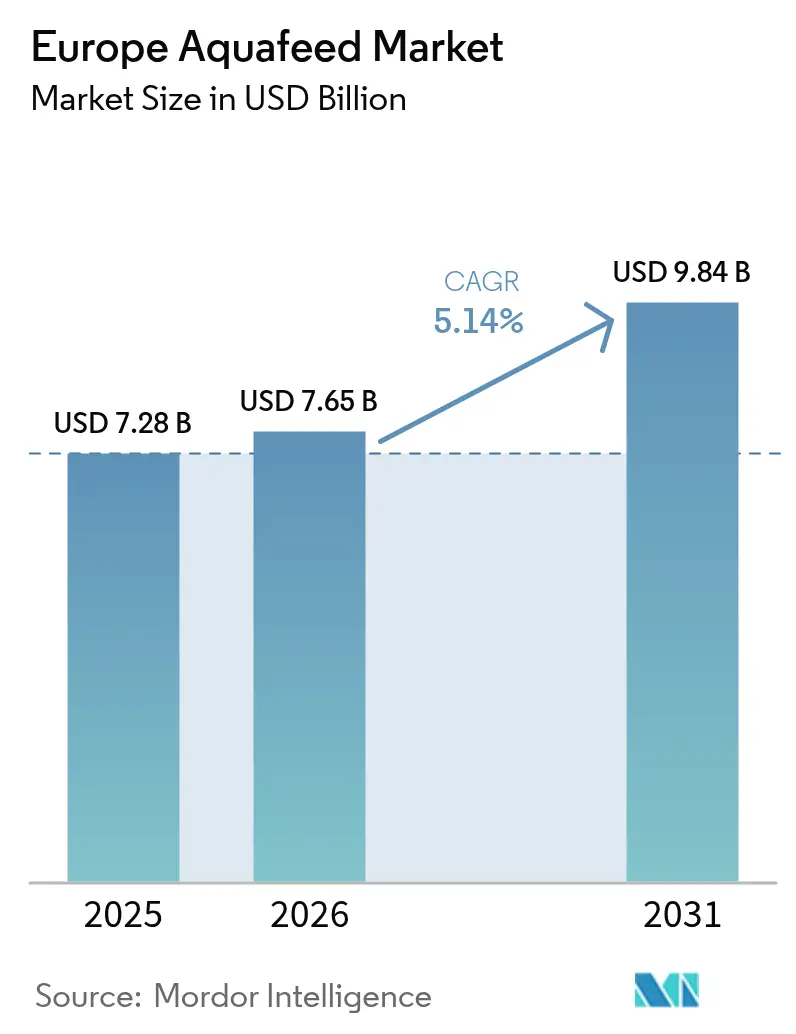
The Europe aquafeed market size was valued at USD 7.28 billion in 2025 and estimated to grow from USD 7.65 billion in 2026 to reach USD 9.84 billion by 2031, at a CAGR of 5.14% during the forecast period (2026-2031). Market growth is driven by regulatory incentives for low-carbon formulations, increased adoption of recirculating aquaculture systems, and the development of precision-feeding technologies. According to the Statistical Office of the European Union, aquaculture farming in Europe produced 1.1 million metric tons of aquatic organisms in 2023, valued at Euro 4.8 billion (USD 5.62 billion). Spain, France, Greece, and Italy accounted for more than two-thirds (66.6%) of the European Union's aquaculture output volume in 2023[1]Source: Eurostat, "Aquaculture statistics", ec.europa.eu. Norway maintains its position in salmon farming, concentrating high-volume demand in the North, while Spain's Mediterranean region expands production of sea bass, sea bream, and shrimp. The development of single-cell proteins and algal oils reduces dependence on marine resources and enhances supply security. Investments in digital twin platforms and data-driven feeding strategies enable producers to optimize feed conversion ratios and maintain profitability despite fluctuations in energy prices. These developments indicate a stable, technology-driven future for the Europe aquafeed market.
Key Report Takeaways
- By type, fish feed held 37.28% of the Europe aquafeed market share in 2025, while crustacean feed is projected to grow at a 7.06% CAGR to 2031.
- By ingredient, fishmeal accounted for 41.88% of the Europe aquafeed market size in 2025, whereas supplements are projected to register the fastest 7.15% CAGR through 2031.
- By geography, Norway captured 26.55% of the market revenue in 2025, while Spain is forecast to post the highest 7.95% CAGR to 2031.
- Nutreco N.V. (SHV Holdings N.V.), BioMar Group A/S (Schouw & Co. A/S), Cargill, Incorporated, Mowi Feed AS (Mowi ASA), and Aller Aqua A/S collectively hold the majority of the market share in 2024.
Note: Market size and forecast figures in this report are generated using Mordor Intelligence’s proprietary estimation framework, updated with the latest available data and insights as of 2026.
Europe Aquafeed Market Trends and Insights
Drivers Impact Analysis*
| Driver | (~) % Impact on CAGR Forecast | Geographic Relevance | Impact Timeline |
|---|---|---|---|
| Rising intensification of aquaculture across the region | +1.0% | Norway, Spain, France, and Italy | Medium term (2-4 years) |
| Growth of Recirculating Aquaculture Systems (RAS) demanding specialized high-density feeds | +0.8% | Germany, Netherlands, and Norway | Long term (≥ 4 years) |
| European Union green deal incentives for low-carbon feed ingredients | +0.7% | European Union -27, and United Kingdom | Long term (≥ 4 years) |
| Widening adoption of Single-Cell Protein (SCP) to bridge Europe’s protein gap | +0.6% | Northern Europe, and Scandinavia | Medium term (2-4 years) |
| Digital twin–enabled precision feeding reducing feed conversion ratio | +0.5% | Norway, Netherlands, and Denmark | Short term (≤ 2 years) |
| Retailer sustainability scorecards pushing certified aquafeed sourcing | +0.3% | Western Europe, and United Kingdom | Short term (≤ 2 years) |
| Source: Mordor Intelligence | |||
Rising Intensification of Aquaculture Across the Region
European aquaculture production is increasing as operators transition from extensive ponds to high-density sea cages and land-based facilities. This intensification creates concentrated feed demand, enabling feed mills to benefit from economies of scale and optimize delivery networks. The 2023 harvest in Norway's Trøndelag region, which reached 239,800 metric tons valued at NOK 17.1 billion (USD 1.6 billion), illustrates how concentrated production creates high-volume demand centers[2]Source: Statistics Norway, “Aquaculture Statistics,” ssb.no. Simplified permitting processes for compliant intensive operations support this transition, while environmental regulations limit extensive farming. This development pattern sustains demand for high-performance feeds that command higher prices due to improved feed conversion ratios and lower environmental impact.
Growth of Recirculating Aquaculture Systems (RAS) Demanding Specialized High-density Feeds
Recirculating Aquaculture Systems (RAS) are expanding across Germany, the Netherlands, and Norway, supported by stable energy prices and improved engineering reliability[3]Source: Norwegian Directorate of Fisheries, “Aquaculture Regulations and Data,” fiskeridir.no. These closed-loop systems require specialized feeds with high digestibility and low phosphorus content to maintain water quality. Feed manufacturers, such as BioMar, developed RAS-specific product lines in 2021 with enhanced nutrient absorption and durability features that reduce solid waste output. The technical complexity of these specialized feeds enables premium pricing while creating barriers for conventional feed producers. The integration between feed manufacturers and RAS technology suppliers increases customer retention and competitive advantages. RAS adoption is anticipated to grow through 2030, driven by land availability constraints and regulations aimed at preventing fish escapes, which will support continued growth in feed revenue.
European Union Green Deal Incentives for Low-Carbon Feed Ingredients
The Carbon Border Adjustment Mechanism transitioned from a reporting phase in 2023-2025 to implementing phased tariffs in 2026, imposing additional costs of 2.5-100% on high-carbon imports[4]Source: European Commission, “Carbon Border Adjustment Mechanism,” ec.europa.eu. The fishmeal and soybean supply chains face significant exposure to these tariffs, driving a shift toward alternative ingredients such as single-cell proteins, insect meals, and European cereals. DSM-Firmenich's divestment of its Feed Enzymes Alliance stake for EUR 1.5 billion (USD 1.6 billion) in February 2025 reflects corporate portfolio adjustments to meet low-carbon requirements. The European Deforestation Regulation's stricter controls on soy sourcing enhance the cost competitiveness of low-carbon alternatives. Feed mills that maintain low-emission product portfolios gain sustainable competitive advantages in both brand value and cost structure.
Retailer Sustainability Scorecards Pushing Certified Aquafeed Sourcing
Major grocery retailers evaluate seafood suppliers based on ingredient transparency and certifications from MarinTrust or the Aquaculture Stewardship Council. Certified feed products command 10-15% price premiums, while non-certified products risk removal from premium retail shelves. In 2024, Skretting's procurement agreements with insect-protein manufacturer Volare demonstrate efforts to secure certified ingredients and maintain retail market access. Supplier scorecards establish traceability requirements throughout the supply chain, creating a market division between verified and non-verified feeds. Growing consumer demand for sustainable products influences retailers to prioritize certified feed ingredients, leading to consistent market demand for third-party verified ingredients.
Restraints Impact Analysis*
| Restraint | (~) % Impact on CAGR Forecast | Geographic Relevance | Impact Timeline |
|---|---|---|---|
| High capital cost of extrusion and pelletizing upgrades for novel ingredients | -0.8% | Western Europe, and Scandinavia | Medium term (2-4 years) |
| Consumer skepticism toward genetically edited feed ingredients | -0.6% | European Union -27, and United Kingdom | Long term (≥ 4 years) |
| Biosecurity threats lengthening product-approval timelines | -0.5% | Norway, Scotland, and Ireland | Short term (≤ 2 years) |
| Energy price swings elevating production costs for feed mills | -0.7% | Germany, Netherlands, and Belgium | Short term (≤ 2 years) |
| Source: Mordor Intelligence | |||
High Capital Cost of Extrusion and Pelletizing Upgrades for Novel Ingredients
The processing of insect meal and algal oils requires specialized equipment with specific shear forces, temperature controls, and coating capabilities that existing production lines cannot accommodate. Production line upgrades cost between EUR 2-5 million (USD 2.2-5.4 million), which creates financial constraints for regional feed mills. The EUR 37 million (USD 40 million) loan from the European Investment Bank to Protix in 2024 for its Polish operations demonstrates the significant capital requirements. Large companies, including Nutreco N.V., can distribute investment costs across multiple facilities, which increases market consolidation. This financial barrier causes smaller manufacturers to delay the adoption of alternative ingredients, impeding the industry's transition from marine-based proteins.
Biosecurity Threats Lengthening Product-Approval Timelines
In 2024, recurring sea lice outbreaks and viral incidents increased regulatory oversight in Norway. Norwegian authorities now require comprehensive trials for immunity-boosting additives, extending approval timelines by 18-24 months. Ingredient suppliers must provide documentation for traceability, contamination prevention, and pathogen-mitigation protocols, which increases initial costs. This regulatory scrutiny protects farms from disease outbreaks, but it also delays the introduction of new nutritional products that could improve sustainability.
*Our forecasts treat driver/restraint impacts as directional, not additive. The impact forecasts reflect baseline growth, mix effects, and variable interactions.
Segment Analysis
By Type: Fish Feed Remains Core Volume Driver
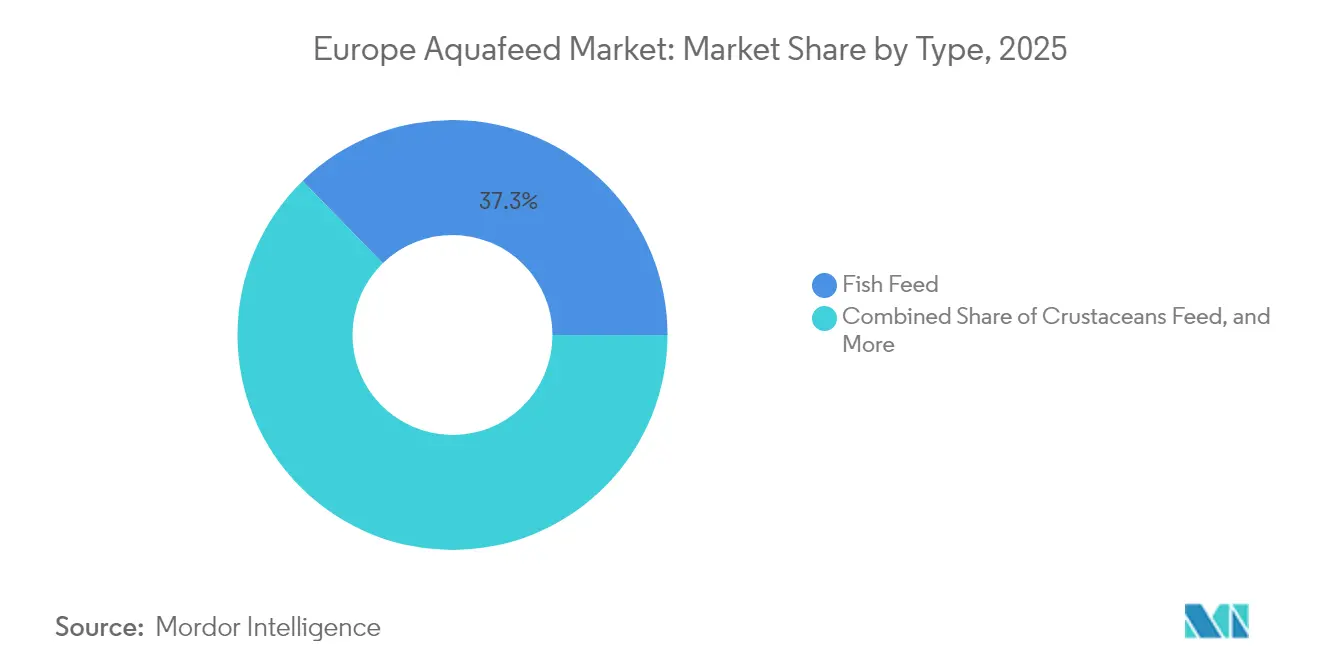
Fish feed accounts for 37.28% of the Europe aquafeed market share in 2025, driven by Norway's salmon and trout production and consistent demand for carp and tilapia in Central and Southern Europe. Salmon feed represents the highest volume, supporting extensive sea-cage operations and increasing land-based recirculating aquaculture systems (RAS) that require concentrated feed formulations. Carp feed sustains pond systems in Poland and the Czech Republic, while tilapia feed serves Mediterranean pond operations that maintain year-round production cycles.
The crustacean feed segment is projected to grow at a 7.06% CAGR, representing the highest growth rate in the market. This growth is primarily driven by shrimp farming, with Spain and Portugal expanding their Litopenaeus vannamei production systems, which require specific protein and lipid compositions different from fish feed. Additional demand comes from experimental crab farming operations in France and the United Kingdom. Crustacean feed commands higher prices than fish feed, resulting in faster revenue growth compared to volume increases. The expansion of crustacean feed production offers market diversification opportunities for producers looking to reduce their dependence on salmon feed market fluctuations.



By Ingredient: Fishmeal Still Ranks First While Supplements Surge
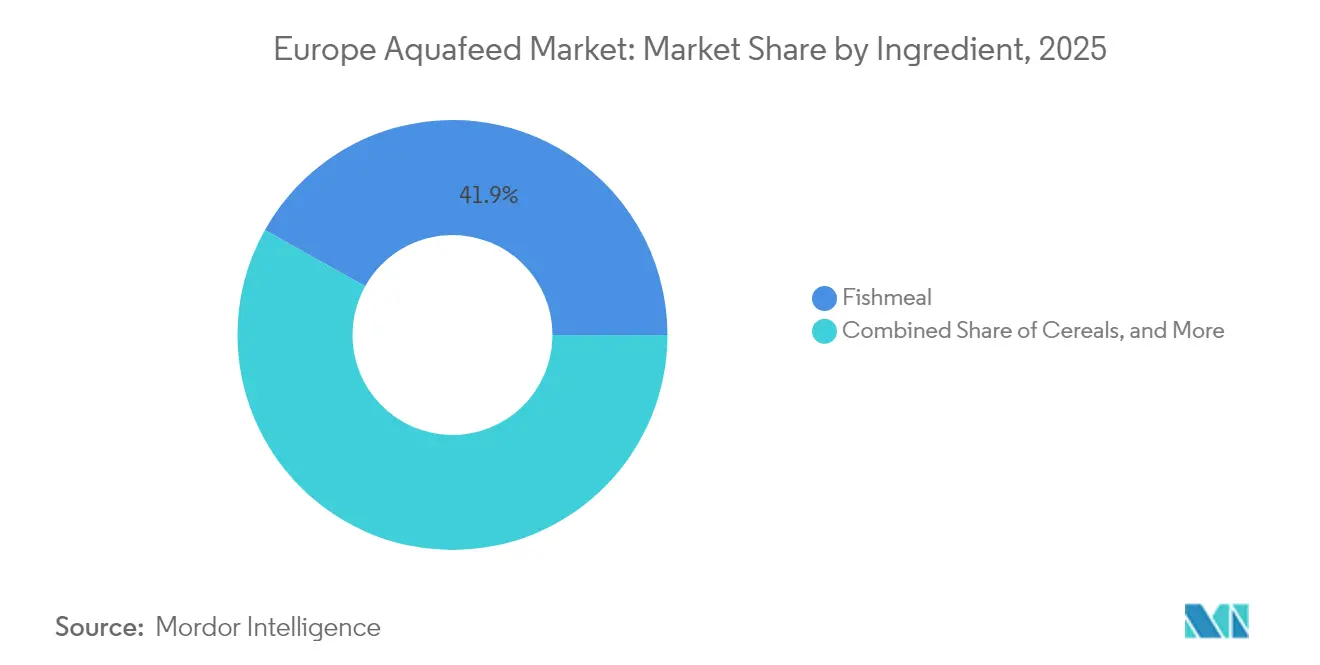
Fishmeal accounts for 41.88% of the Europe aquafeed market size in 2025, maintaining its dominant position due to its balanced amino-acid profile and established supply chain. Increasing sustainability concerns and supply chain constraints are leading to stricter fishing quotas and price fluctuations. The market share of fishmeal is projected to decrease as alternative ingredients, including recycled fish trimmings, insect meals, and single-cell protein, gain market share. Despite this trend, fishmeal remains essential in aquafeed formulations, particularly for early-stage fish development where digestibility is crucial.
The supplements segment, which includes single-cell proteins, algal oils, functional additives, and enzymes, demonstrates the highest growth rate at 7.15% CAGR. This growth is supported by European initiatives promoting carbon reduction and supply chain traceability. Veramaris's expansion of algal oil production in 2024 demonstrates the viability of fish oil alternatives for omega-3 supplementation. Advanced nutritional additives designed for recirculating aquaculture systems (RAS) enhance immune response and maintain water quality, reducing the need for antibiotics. The high value-per-kilogram nature of supplements contributes to significant revenue growth, transforming ingredient allocation patterns in the Europe aquafeed market.
Geography Analysis
Norway holds a 26.55% share of the Europe aquafeed market in 2025, establishing itself as a major production hub by combining large-scale operations with advanced technology. The region generated significant revenue, demonstrating the effectiveness of integrated feed mills, cold logistics, and established farming licenses. The country's government research funding and consistent licensing system enable feed mills to test precision diets and digital feeding systems.
Spain shows significant growth potential with a projected 7.95% CAGR through 2031. The Mediterranean climate enables continuous production cycles for sea bass, sea bream, and shrimp, increasing feed consumption efficiency. The Spanish Ministry of Agriculture, Fisheries and Food's 2024 funding for sustainable ingredient initiatives encourages mills to adopt certified soy and single-cell-protein, meeting both national food security objectives and European climate requirements.
Germany, France, and Italy represent stable but smaller market segments. Germany focuses on advanced RAS (Recirculating Aquaculture System) units near urban areas, requiring specialized diets that minimize nutrient discharge. France utilizes its existing animal feed infrastructure of 320 factories, with a turnover of EUR 10.9 billion (USD 11.8 billion), to expand into mussel and oyster feed production. Italy develops offshore cage farming in the Tyrrhenian Sea, requiring water-resistant pellets. These markets create a balanced distribution between Northern European technology centers and Southern diversification hubs, strengthening the overall Europe aquafeed market structure.
Regulatory Landscape
The Europe aquafeed market operates under the EU-wide animal feed framework, where feed additives require authorization under Regulation (EC) No 1831/2003 following EFSA assessment, and feed placing on the market is governed by Regulation (EC) No 767/2009 (labeling, safety, and claims). The Catalogue of Feed Materials under Regulation (EU) No 68/2013, together with ongoing amendments, governs which materials and related descriptions can be used across member states, which tightens compliance expectations for novel ingredient adoption and supporting documentation.
In 2026, multiple European Commission implementing acts updated the additive toolbox available to aquafeed formulators across all animal species, including aquatic species. Examples include authorizations for L-lysine sulphate (January 2026) and L-cysteine forms (May 2026), plus an authorization for a preparation of Pediococcus pentosaceus (May 2026) and renewal of thiamine (vitamin B1) forms (February 2026). These Official Journal updates reinforce the need for suppliers and feed mills to align formulations with the current EU Register conditions, particularly where maximum inclusion levels and use conditions influence cost, claims, and time-to-market for functional feeds.
Competitive Landscape
Nutreco N.V. (SHV Holdings N.V.), BioMar Group A/S (Schouw & Co. A/S), Cargill, Incorporated, Mowi Feed AS (Mowi ASA), and Aller Aqua A/S dominate the Europe aquafeed market share in 2024, creating a consolidated market structure that maintains pricing stability while accommodating regional specialists. Nutreco N.V. integrates global ingredient sourcing, research and development capabilities, and certification advisory services for farmers. BioMar maintains its market position through specialized RAS formulations and feeds with reduced phosphorus excretion. Cargill, Incorporated, utilizes its global commodity network while transitioning to verified low-carbon ingredients to maintain competitiveness.
The industry focus has shifted from capacity expansion to integrated solutions. In 2024, DSM-Firmenich's decision to separate its USD 3.6 billion animal-nutrition division into a specialized additive company indicates the increasing value of advanced supplements. Alternative-protein companies, including Enifer and Protix, are establishing direct supply relationships with large farms, compelling traditional manufacturers to either form partnerships or risk market share losses.
Technology adoption determines competitive advantage. Companies that develop data platforms connecting feed composition with farm sensor data create integrated systems that enhance performance and streamline MarinTrust audits. Companies without digital integration risk commoditization. Acquisition strategies now prioritize algorithmic capabilities, ingredient innovation, and geographic expansion over production volume, indicating market maturation in the European aquafeed.
Europe Aquafeed Industry Leaders
-
Nutreco N.V. (SHV Holdings N.V.)
-
BioMar Group A/S (Schouw & Co. A/S)
-
Cargill, Incorporated
-
Mowi Feed AS (Mowi ASA)
-
Aller Aqua A/S
- *Disclaimer: Major Players sorted in no particular order


Market Opportunities and Future Outlook
Opportunities cluster around ingredient substitution, additive-led performance, and compliance-focused differentiation as European aquaculture operators intensify production and increase the use of RAS. That shift increases demand for high-digestibility, low-discharge diets. The EU policy push toward alternative proteins provides a concrete runway for algae, insect, and fermentation-derived inputs: the European Commission published guidance in July 2026 recommending transitions from fish-based to algae-based ingredients in aquafeeds, and it adopted a Protein Action Plan in July 2026 targeting greater feed security through domestic production and alternative proteins. Together, these signals support business cases for localized supply chains and for supplement-heavy formulations that align with retailer scorecards and certification expectations.
Commercial opportunities also sit in moving industrial trials and prototypes into repeatable supply for high-volume species. In Spain, Bioflytech began aquaculture feeding trials in June 2026 (including Atlantic salmon, European seabass, and gilthead seabream). In May 2026, Aller Aqua produced industrial-scale aquafeed prototypes for upcoming sea cage trials in Norway (August to October 2026). Alongside this, logistics and Scope 3 reduction initiatives create room for collaboration between feed suppliers and transport partners, supporting integrated feeding solutions that combine formulation, data, and delivery.
Recent Industry Developments
- June 2026: Cargill commissioned a new extrusion pilot plant at its Innovation Center in Vilvoorde, Belgium, backed by an investment of EUR 5.4 million. The added pilot-scale capability increases R&D throughput for new aquafeed formats and novel-ingredient processing, supporting faster iteration on high-density and functional diets demanded by intensive systems.
- October 2025: BioMar obtained Aquaculture Stewardship Council (ASC) Feed Certification for its production facility in Duenas, Spain. The certification expands the availability of ASC-compliant aquafeed supply for the Iberian Peninsula, strengthening traceability and responsible sourcing as a commercial differentiator with retailers and seafood brands.
- November 2024: The European Investment Bank provided a EUR 37 million loan to Protix for its Polish operations. This financing supports scaling insect-based protein capacity and highlights the capital intensity behind alternative-ingredient localization, a key step toward lowering reliance on marine resources in European aquafeed formulations.


Research Methodology Framework and Report Scope
Market Definition and Coverage
For this study, the European aqua feed market covers the value of feed sold for farmed aquatic species across Europe, including complete feeds and feed mixes supplied in common formats (such as pellets, granules, and powders) for commercial aquaculture.
Scope exclusions: It does not count on-farm feed made for self-use and it excludes medicines and non-feed health products that are administered separately from feed.
Segmentation Overview
-
By Type
-
Fish Feed
- Carp
- Salmon
- Tilapia
- Catfish
- Other Fish Feed
-
Crustaceans Feed
- Shrimp
- Other Crustacean Feed
- Mollusks Feed
- Other Aquafeed
-
Fish Feed
-
By Ingredient
- Cereals
- Fishmeal
- Supplements
- Other Ingredients
-
By Geography
- Germany
- France
- Italy
- Spain
- United Kingdom
- Norway
- Rest of Europe
Data Sources, Market Sizing, and Validation
Desk Research
Desk research was used to set the factual base for the model and to keep assumptions realistic across countries. We referenced public statistics and technical publications that show aquaculture output and feed use patterns, such as Eurostat aquaculture datasets, FAO fisheries and aquaculture statistics, European Commission publications on seafood and aquaculture, and national fisheries or aquaculture agency releases.
To convert activity signals into market value, we also reviewed non-paywalled information on raw material pricing and feed formulation trends, such as commodity and oilseed price series, open scientific journals on aquaculture nutrition, and association websites that track farming practices. Company filings, investor presentations, and credible press were used to understand capacity additions, product mix shifts, and pricing language. In parallel, paid subscriptions that cover company financials, shipment-level trade flows, and patents were used selectively to cross-check scale and timing. The sources listed here are illustrative, and many other references were also consulted during data collection, validation, and clarification.
Primary Interviews and Surveys
Our Europe fieldwork uses expert interviews and surveys with feed producers, aquaculture operators, distributors, nutrition specialists, and procurement leaders. Respondents help test secondary data, close country and species gaps, and refine feed prices, usage ratios, and demand assumptions within the European market. Findings are reconciled before final analysis.
Distribution of primary research fieldwork respondents
| Company type | Respondent position |
|---|---|
| Top tier: 30% | CXOs: 15% |
| Mid tier: 45% | Functional/Unit leaders: 30% |
| Smaller Players: 25% | Managers: 55% |
Market-Sizing & Forecasting
Sizing was built using top-down and bottom-up approaches, with the main spine coming from a top-down demand pool reconstruction. Country-level aquaculture output was mapped to feed use through feed intensity and typical feed conversion behavior, and then market value was derived using an average selling price logic that reflects mix by species and feed type.
A few practical inputs were treated as the key levers in the model (illustrative): farmed output volumes by major countries, share of production that uses commercial feeds, average feed conversion ratios by species group, ingredient cost direction (such as fishmeal and cereals), and observed price pass-through timing in supply contracts. Where direct signals were weak, ranges were taken from interviews and used as controlled assumptions, and then checked so implied per-ton feed values stayed aligned with what buyers described.
Forecasts were developed using scenario analysis, because the market is influenced by biological cycles and commodity-linked pricing. Base, tighter, and higher cases were created around farming output growth, ingredient cost trends, and adoption of higher performance formulations, and then the final outlook was selected after aligning it with expert views on near-term farm expansion and feed pricing behavior.
Data Validation & Update Cycle
Results were validated through multiple checks before sign-off. We compared implied feed demand and value per ton against independent signals, reviewed outliers at the country and species level, and then adjusted assumptions when the model produced changes that could not be explained by farming output or realistic price movement.
Before publication, the numbers go through a multi-step analyst review so the logic, conversions, and units stay consistent across the time series. The report is refreshed annually, and interim updates are triggered when material events occur, such as major raw material shocks, regulatory changes, or visible capacity additions. Right before delivery, a final pass is completed so clients receive the most current view available.
Mordor Intelligence's European Aqua Feed Market Size Versus Other Published Estimates
Published market values for European aqua feed often do not match, even when the same geography is being discussed, because the timing of price capture and currency conversion can shift the final total. Differences also come from scope edges, where some sources fold in adjacent spend items that buyers do not always procure as feed.
A refresh-led build tends to narrow these gaps, since commodity-driven ASP updates, consistent FX timing, and re-check calls are applied when input costs move quickly, which is one reason the Mordor Intelligence number can separate from estimates that rely on a single static price point.
Benchmark comparison
| Source | Market Size | Gaps in Research Methodology |
|---|---|---|
| Mordor Intelligence | USD 7.28 B (2025) | |
| Trade Journal B | USD 7.54 B (2024) | Uses a 2024 base and a faster growth pathway, and the total can shift if ingredient pass-through and FX conversion are applied at a different point in the year. |
| Global Consultancy A | USD 17.23 B (2025) | Appears to use a broader aquafeed revenue scope, where additional feed formats and adjacent spend categories may be included, which lifts the 2025 value well above a feed-only definition. |
The spread mainly comes from two practical levers, the year and pricing moment used to translate activity into value, and how tightly feed is separated from nearby categories. By keeping assumptions tied to observable output signals and repeatable ASP updates, the final market size stays easy to reconcile and re-run when new data arrives.


Key Questions Answered in the Report
What is the projected value of the Europe aquafeed market in 2031?
The market is forecast to reach USD 9.84 billion by 2031, up from USD 7.65 billion in 2026.
Which country is the largest consumer of aquafeed in Europe?
Norway leads with 26.55% market share in 2025, driven by its massive salmon farming sector.
Which aquafeed segment is projected to grow the fastest?
Crustacean feed is anticipatedd to expand at a 7.06% CAGR through 2031, benefiting from shrimp and emerging crab cultivation.
How will the EU Green Deal affect aquafeed ingredients?
The Carbon Border Adjustment Mechanism and deforestation rules will make high-carbon imports costlier, accelerating the shift to single-cell proteins and other low-emission alternatives.
What technology trend is most influential for feed efficiency?
Digital twin-enabled precision feeding that integrates sensor data and predictive analytics can cut feed waste by up to 12% while improving growth rates.
Why are supplements gaining traction in feed formulations?
Supplements such as algal oils and precision additives deliver environmental benefits and performance gains, leading the ingredient category with a 7.15% CAGR forecast.
Page last updated on:


 Your data is secure and never sold or shared.


