Market Overview
| Study Period | 2021 - 2031 |
|---|---|
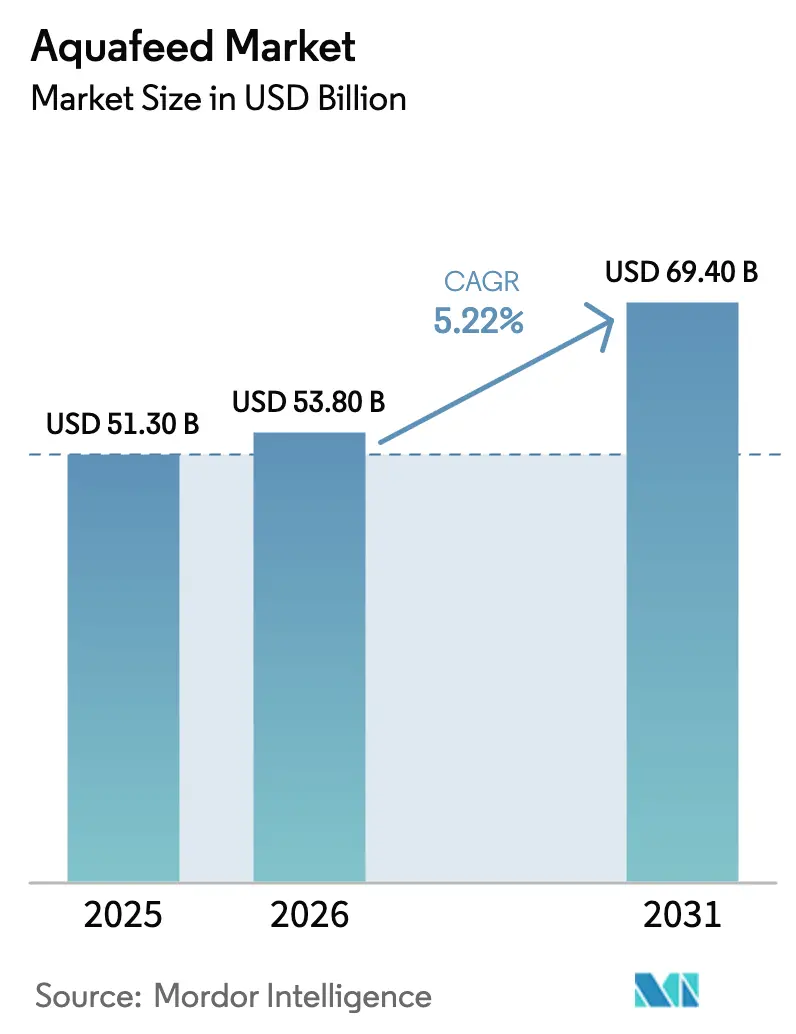
| Market Size (2026) | USD 53.80 Billion |
| Market Size (2031) | USD 69.40 Billion |
| Growth Rate (2026 - 2031) | 5.22% CAGR |
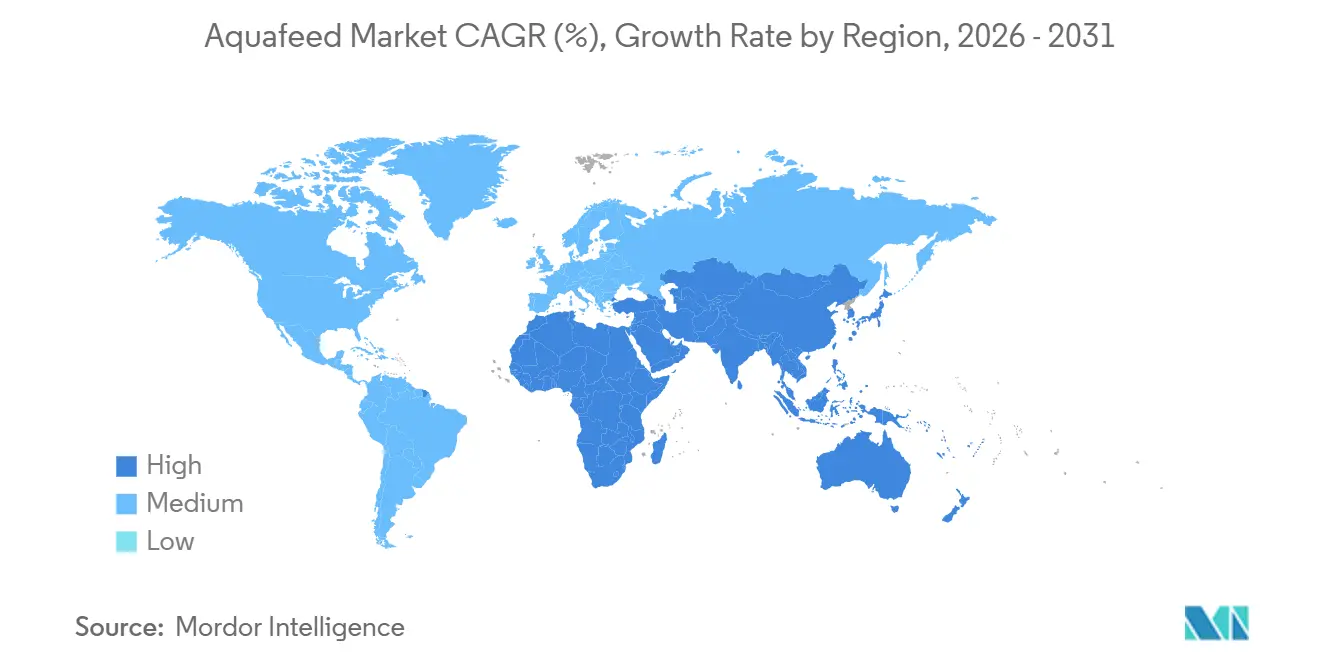
| Fastest Growing Market | Asia Pacific |
| Largest Market | Asia Pacific |
| Market Concentration | Low |
Major Players *Disclaimer: Major Players sorted in no particular order Image © Mordor Intelligence. Reuse requires attribution under CC BY 4.0. | |
Aquafeed Market Analysis by Mordor Intelligence
The aquafeed market size was valued at USD 51.30 billion in 2025 and is estimated to reach USD 53.80 billion in 2026. It is further projected to grow to USD 69.40 billion by 2031, registering a CAGR of 5.22% during the forecast period (2026–2031). The outlook reflects sustained protein demand in emerging economies and steady gains in feed conversion efficiency, which are widening profit margins while lowering environmental footprints. Robust aquaculture output in China and India keeps the Asia-Pacific region at the center of global supply. However, policy incentives in Africa and the Middle East are beginning to diversify production hubs and unlock new customers for formulated diets. Ingredient innovation is another driving force behind the growth of the aquafeed market, with insect meal, algae, and single-cell protein transitioning from pilot volumes to commercial scale following safety approvals in the European Union and Norway[1]Source: European Food Safety Authority, “Scientific Opinion on the Safety of Insect-Derived Proteins in Aquafeed,” EFSA Journal, efsa.europa.eu. Functional additives, such as probiotics and enzymes, are enabling mills to meet stricter discharge rules while minimizing feed costs. Automated feeding systems equipped with artificial intelligence are enhancing ration accuracy, further reducing waste. Competitive intensity remains moderate as regional specialists gain ground in niche segments, despite the global reach of companies such as Tongwei Co., Ltd., Guangdong HAID Group Co., Ltd., Cargill, Incorporated, BioMar Group A/S, and Charoen Pokphand Foods Public Company Limited.
Key Report Takeaways
- By species, fish feed captured 63.7% in the aquafeed market in 2025, while crustacean feed is on track for a 5.4% compound annual growth rate through 2031.
- By ingredient, oilseeds and pulses accounted for 29.6% of the aquafeed market size in 2025, while novel proteins are expanding at a 6.0% compound annual growth rate from 2026 to 2031.
- By additive type, vitamins and minerals led with a 24.9% share in 2025, whereas probiotics are posting the fastest growth pace of 6.1% through 2031.
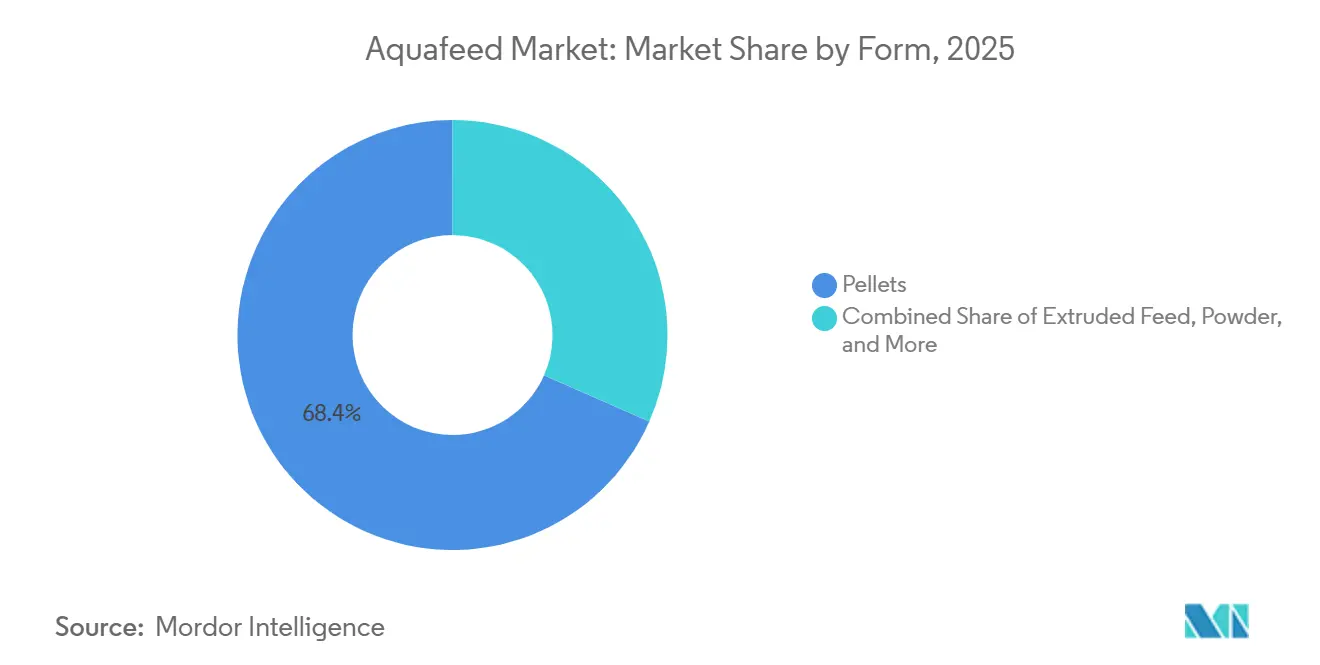
- By form, pellets accounted for 68.4% of the 2025 aquafeed market share, while extruded feed is rising at a 5.5% compound annual growth rate from 2026 to 2031.
- By life-cycle stage, grower diets accounted for 38.1% of 2025 revenue, and starter feeds are forecast to grow at 5.6% through 2031.
- By geography, the Asia-Pacific region generated 69.9% share of the aquafeed market in 2025 and is also the fastest-growing region, projected to advance at a CAGR of 5.5% through 2031.
Note: Market size and forecast figures in this report are generated using Mordor Intelligence’s proprietary estimation framework, updated with the latest available data and insights as of January 2026.
Global Aquafeed Market Trends and Insights
Drivers Impact Analysis*
| Driver | (~) % Impact on CAGR Forecast | Geographic Relevance | Impact Timeline |
|---|---|---|---|
| Rising Global Seafood Consumption | +1.8% | Global, highest intensity in Asia-Pacific and Africa | Long term (≥ 4 years) |
| Expansion of Intensive Aquaculture Farming Systems | +1.5% | Asia-Pacific core, spillover to South America and Middle East | Medium term (2-4 years) |
| Advances in Functional Feed Additives and Precision Nutrition | +0.9% | North America, European Union, and advanced Asian markets | Medium term (2-4 years) |
| Blockchain-Enabled Raw-Material Traceability Mandates | +0.4% | European Union, United States, and early adoption in Southeast Asia | Short term (≤ 2 years) |
| ESG-Linked Loan Covenants Accelerating Uptake of Alternative Proteins | +0.7% | European Union, North America, and emerging influence in South America | Medium term (2-4 years) |
| AI-Driven Feeding Automation Improving Feed-Conversion Ratios | +0.6% | Norway, Chile, China and large-scale operations globally | Short term (≤ 2 years) |
| Source: Mordor Intelligence | |||
Rising Global Seafood Consumption
Per-capita seafood intake climbed to 21.4 kilograms in 2025, up from 19.2 kilograms in 2019, and aquaculture already supplies 58% of that demand, underscoring the structural tailwind for formulated feeds. The expanding middle classes in India, Indonesia, and Nigeria are trading up from cereals to fish proteins, driving steady consumption even as economic growth cools. Feed economics reinforce the appeal that fish and shrimp require only 1.2-1.8 kilograms of feed per kilogram of live weight, significantly lower than pork, giving aquaculture an efficiency edge. China alone projects seafood demand to rise 3.8% annually through 2031, absorbing most of its own record output and drawing product from neighbors such as Vietnam and Thailand. Harmonized food-safety rules under the International Organization for Standardization (ISO) 22000 are reducing trade friction and enabling mills to scale for export. These forces combine to lift the aquafeed market across all major regions, while sustaining price discipline despite raw material inflation.
Expansion of Intensive Aquaculture Farming Systems
Land constraints and rising labor costs are prompting a shift from extensive ponds to high-density systems that need nutrient-dense feeds. Offshore cages in Norway now stock 200,000 salmon per unit, double prior norms, while biofloc ponds in India yield four times the shrimp per hectare. Such density raises disease risk, so mills must fine-tune amino acid and energy levels using least-cost formulation models that react to daily ingredient prices. Vietnam’s operators have increased their stocking density to 150-200 post-larvae per square meter and consequently purchase feeds with 38-42% protein, plus immunostimulants. Regulators in Europe and the United States are lowering antibiotic residue ceilings, prompting farms to shift toward functional additives rather than drugs. All of these factors increase demand for premium rations and boost the aquafeed market value, even if volume gains moderate.
Advances in Functional Feed Additives and Precision Nutrition
Probiotic inclusion has increased since 2020, as Bacillus and Pediococcus strains have shown consistent 18-22% weight gain improvements in shrimp and a 12% drop in feed conversion ratios. Enzymes such as phytase now account for 40% of global tonnage, reducing phosphorus waste by up to 20% and saving mills USD 8-12 per metric ton when fishmeal prices spike. Precision platforms integrate water-quality sensors, enabling Norwegian farms to adjust ration size every six hours and reduce feed loss by 9%. Encapsulation maintains the stability of antioxidants for up to six months in tropical climates, providing distributors with greater flexibility. Together, these tools enable producers to meet stringent discharge caps while still protecting margins, propelling steady growth in the aquafeed market.
Blockchain-Enabled Raw-Material Traceability Mandates
The European Union Deforestation Regulation, which entered into force in 2025, obliges soy buyers to certify zero-deforestation origin, thereby accelerating the adoption of purpose-built blockchain platforms. United States importers impose similar rules under the Seafood Import Monitoring Program, so mills across Southeast Asia are digitizing supplier ledgers to keep access to a USD 6.2 billion destination market. Early pilots at Nutreco cut raw-material audit time from two weeks to two days and saved USD 0.50 per metric ton, a material sum at a multimillion metric ton scale. Smaller Indian and Bangladeshi mills are forming consortia to split USD 200,000-500,000 in software costs, illustrating how compliance pressures are reshaping industry structure. As traceability shifts from optional to mandatory, compliant suppliers gain share, lifting the aquafeed market even where overall seafood demand is flat.
Restraints Impact Analysis*
| Restraint | (~) % Impact on CAGR Forecast | Geographic Relevance | Impact Timeline |
|---|---|---|---|
| Volatility in Fish-Meal and Fish-Oil Prices | -1.2% | Global, acute impact on salmon and marine-fish feed producers | Short term (≤ 2 years) |
| Disease Outbreaks Causing Abrupt Feed-Demand Swings | -0.8% | Asia-Pacific, South America, and sporadic impact in Africa | Short term (≤ 2 years) |
| Stricter Phosphorus-Discharge Caps on Aquaculture Effluents | -0.5% | Norway, Chile, China and European Union member states | Medium term (2-4 years) |
| Novel-Protein Supply Diverted to Premium Pet-Food Segment | -0.4% | North America, European Union, and emerging competition in Asia | Medium term (2-4 years) |
| Source: Mordor Intelligence | |||
Disease Outbreaks Causing Abrupt Feed-Demand Swings
Early Mortality Syndrome slashed Thai shrimp harvests by 40% in 2024, resulting in a 180,000 metric tons reduction in feed demand in one quarter and forcing mill shutdowns. In 2025, Tilapia Lake Virus in Ecuador and Colombia cut local feed offtake by 25% and left inventories unsold for months. Resurgent Infectious Salmon Anemia in Chile removed 8 million fish and reduced feed orders by 35,000 metric tons. Shrimp still has only three commercial vaccines versus fifteen for salmon, so crustacean farmers must pay 8-12% more for immunostimulant rations. Such shocks create unpredictable volume gaps that limit the steady expansion of the aquafeed market.
Stricter Phosphorus-Discharge Caps on Aquaculture Effluents
Norway’s 2024 Aquaculture Act cut allowed phosphorus discharge to 45 kilograms per metric ton of fish, prompting feed mills to double phytase enzyme rates and add low-phosphorus wheat gluten, raising costs by NOK 150 (USD 14) per metric ton[2]Source: Norwegian Ministry of Trade Industry and Fisheries, “Revised Aquaculture Act 2024,” government.no . China soon followed with effluent rules that forced 20% of small tilapia farms to close, consolidating demand among integrated players who can amortize compliance outlays. Chile is piloting underwater phosphorus sensors and fines up to USD 500,000 for non-compliance. The European Union will extend freshwater caps to trout and carp operations in 2026. Reformulation raises feed prices and can trim growth rates, thereby tempering the value of the aquafeed market.
*Our forecasts treat driver/restraint impacts as directional, not additive. The impact forecasts reflect baseline growth, mix effects, and variable interactions.
Segment Analysis
By Species: Crustacean Surge Reshapes Protein Portfolios
The aquafeed market size for fish feed accounted for 63.7% of the global value in 2025, is driven by the continued dominance of carp, tilapia, and salmon in Asian and Atlantic farm budgets. Crustacean formulas, led by shrimp, are experiencing a 5.4% CAGR from 2026 to 2031, driven by double-digit growth in vannamei harvests in Ecuador and India[3]Source: United States Department of Agriculture Foreign Agricultural Service, “Global Aquaculture Production Report 2025,” fas.usda.gov. Trout, seabass, and catfish feeds remain price sensitive, but disease-driven shifts toward functional additives are moving buyers into premium tiers. Salmon diets are now being trialed with 25-30% insect protein alongside algae oil to protect omega-3 levels while meeting retailer sustainability codes.
Growth momentum within the crustacean segment continues to rebalance regional ingredient flows, drawing more soybean meal into South America and attracting insect meal to Norwegian and Vietnamese mills. Premium shrimp formulas already command 25% higher prices than generic fish grower pellets, driving up the overall aquafeed market value ahead of volume. Niche gains in mollusk feed remain small but highlight rising water-quality concerns in Chinese oyster farms. Catfish demand is flat as pangasius competes on price in export channels, yet targeted immunostimulant blends are projected to revive margins from 2027 onward.


By Ingredient: Novel Proteins Move into Mainstream Mixes
Oilseeds and pulses held a 29.6% value share in 2025, underscoring the cost advantage of soybean meal, which trades at USD 500 per metric ton, compared to fish meal at USD 1,500. Novel proteins, including insect meal, algae, and single-cell protein, are projected to grow at a CAGR of 6.0% during the 2026–2031 forecast period and account for 9% of total formulation spending by 2031, following recent safety approvals by the European Food Safety Authority. Fish meal and fish oil still account for a significant portion of ingredient budgets, as their functional role in larval and broodstock stages remains irreplaceable. Grain energy sources enable extrusion lines to meet the starch targets necessary for pellet durability.
The rising uptake of black soldier fly larvae in trout and seabass feeds is reducing land and water footprints by more than 90% per kilogram of protein, an advantage that lenders are now incorporating into environmental loan covenants. Single-cell protein from gas fermentation is on track to cost USD 900 per metric ton by 2027, which is well below current insect prices, and pilots in China suggest including levels of up to 40% in tilapia diets. Such gains diversify supply chains and reinforce the outlook for aquafeed market growth, despite periodic spikes in fishmeal prices.
By Additive Type: Probiotics Guide Functional-Ingredient Upswing
Vitamins and minerals accounted for 24.9% of the additive value in 2025 because antioxidant premixes remain mandatory in warm-water operations where lipid oxidation risks are high. Probiotics are the fastest-growing segment at 6.1% CAGR through 2031, as shrimp farmers utilize Bacillus, Lactobacillus, and Saccharomyces blends to mitigate Vibrio outbreaks and increase survival by 30-40%. Amino acids enable mills to reduce fish meal inclusion by balancing lysine and methionine, and enzymes unlock bound phosphorus in plant meals, thereby reducing discharge costs.
Greater regulatory scrutiny of antibiotic residues is broadening demand for immunostimulants such as beta-glucans, especially in starter diets. Antioxidants are increasingly micro-encapsulated to extend shelf life in tropical climates, a change that reduces rancidity-driven feed rejection and supports consistent daily intakes. These shifts together deepen the aquafeed market share of higher-margin functional additives.
By Form: Extrusion Technology Extends Premium Reach
Pellets remained the dominant form, accounting for 68.4% of the revenue in 2025, as carp and tilapia farmers prioritized low processing costs. Extruded feed is projected to grow at a CAGR of 5.5% during the 2026–2031 forecast period, reaching USD 19.3 billion by 2031, driven by shrimp and salmon buyers who demand water stability for 8 to 12 hours. Twin-screw extruders now account for 60% of new equipment, as they can handle 40-50% of the lipid loads required in high-energy formulations.
Micro-encapsulation inside extruded pellets protects vitamins and probiotics, cutting nutrient leaching by 25% in field trials. Powder and liquid feeds remain niche for the hatchery and broodstock phases, yet they earn premium pricing that offsets the low volumes. Continued capital investment in extrusion lines fosters technology spillover into mid-sized Asian mills, contributing to steady expansion in the aquafeed market size.
By Life-Cycle Stage: Innovation Premium in Starter Feeds
Grower formulas represented 38.1% of 2025 sales, mirroring the phase when fish consume 70% of their lifetime intake. Starter feeds are expanding at a 5.6% CAGR during the 2026–2031 forecast period, supported by hatcheries that invest in powders with particle sizes ranging from 50 to 200 microns, blended with fish oil and nucleotides to enhance survival in the first 30 days. Finisher diets focus on energy balance to manage fillet fat levels, while broodstock feeds, though only two percent of tonnage, command USD 4,000-6,000 per metric ton because of krill hydrolysate and squid meal inclusion.
Stage-wise tailoring of functional additives is enabling feed manufacturers to price formulations based on biological value rather than tonnage, improving per-ton margins across the starter, grower, and finisher phases. As producers increasingly adopt phase-feeding strategies to optimize survival, growth efficiency, and harvest quality, value growth in aquafeed is outpacing volume expansion, particularly in intensively farmed species.
Geography Analysis
The Asia-Pacific region generated 69.9% of the 2025 aquafeed market value and is projected to grow at a CAGR of 5.5% through 2031. China’s 30 million metric tons harvest drives local demand while India’s shrimp ponds absorb 850,000 metric tons of crustacean diets. Vietnam relies on exports for 70% of its pangasius and shrimp, making the industry sensitive to European sustainability rules that require soybean traceability. Thailand’s recovery from disease outbreaks is underway, yet lower-density stocking has trimmed feed per hectare by up to 20%. Government price caps in Indonesia stabilize farmer costs but limit mill investment in new extrusion lines. Japan serves as a sandbox for single-cell proteins, and Australia’s land-based salmon farms require high-energy diets, both contributing to premium-price niches that boost the regional aquafeed market share.
Africa and the Middle East are experiencing growth, as Egypt’s tilapia segment consumes 450,000 tons of formulations and Nigeria’s catfish sector increases by 10% annually. Saudi Arabia aims to produce 100,000 metric tons of land-based salmon by 2030 and is attracting multinational mills to build regional blends that will avoid 25% import tariffs. Turkey relies heavily on seabass exports and struggles with currency fluctuations that narrow margins, while South Africa plans electricity upgrades that could triple feed demand in Eastern Cape shellfish zones. Regional government backing is key to sustaining aquafeed market growth in these nascent hubs.
Europe and North America grow at a steadier rate. Norway alone consumes 1.8 million metric tons of feed and pushes formulation innovation by testing 20% insect inclusion and 10% algae oil in salmon diets. Scotland’s newly licensed offshore cages demand pellets that sink 40-60 meters without nutrient loss. United States recirculating salmon farms in Maine and California are adding 20,000 tons of premium demand and paying almost triple tilapia feed prices. Chile rebounds from disease shocks and Spain’s organic seabass segment is climbing 12%, rewarding mills that meet Aquaculture Stewardship Council standards. Together these projects consolidate the developed-world contribution to the aquafeed market size even as Asia keeps the lead.

Regulatory Landscape
Aquafeed manufacturers face tighter requirements on ingredient safety, contaminant limits, and farm-level environmental performance, with rules shaped by both national standards and destination-market access conditions. China strengthened product standardization through GB/T 22919.10-2024 (formula feed for tilapia) and GB/T 22919.11-2024 (formula feed for loach), implemented on October 1, 2024, which pushes mills toward more consistent specifications and quality control for key warm-water species diets.
In export-oriented supply chains, compliance increasingly extends beyond domestic law into traceability and contaminant controls demanded by destination markets. Vietnam maintains national technical regulations for compound aquafeed that monitor maximum levels for contaminants such as Aflatoxin B1, Ethoxyquin, and heavy metals (Pb, Cd, Hg, As), reinforcing testing and supplier qualification requirements. At the multilateral level, the FAO issued the 2024 Guidelines for Sustainable Aquaculture (GSA), providing widely referenced principles for sustainable aquafeed practices, including pathways to reduce reliance on traditional fishmeal via alternative ingredients, while the European Commission in 2026 proposed a Food and Feed Safety Omnibus to simplify requirements for feed additives, hygiene, and official laboratory procedures (as a proposal under discussion).
Competitive Landscape
Regional fragmentation reduces competitive intensity in the aquafeed market. Tongwei Co., Ltd., and Guangdong HAID Group Co., Ltd leverage China’s scale to run plants near 90% capacity and undercut rivals on commodity carp diets by up to USD 80 per ton. Cargill partners with Innovafeed to secure insect protein at USD 1,200 and lock in a 15,000 metric tons annual supply, thereby widening its ingredient cost advantages. BioMar’s hatchery purchase secures 120 million smolt and guarantees starter feed offtake in Chile, raising switching costs for farmers.
Capacity utilization advantages in China enable leading producers to mitigate the impact of disease cycles and weather disruptions, thereby protecting margins compared to salmon-focused feed markets in Europe and the Americas. Vertical integration strategies are increasingly emphasizing early life-cycle control, as starter feeds offer the highest margin per ton and foster long-term customer retention. Alternative protein sources, such as insect meal and gas-fermented single-cell protein, are shifting competition from scale-based pricing to ingredient access and formulation intellectual property. Additionally, traceability and digital compliance costs are becoming structural challenges, favoring well-capitalized multinationals and organized cooperatives over independent mills. These factors are driving the aquafeed industry toward a landscape dominated by fewer, more integrated players with distinct cost structures, rather than competition based solely on volume.
White-space opportunities in Africa and the Middle East invite regional specialists to set up blending lines, saving importers 30-40% on freight and duty. Calysta and Unibio are piloting single-cell protein plants that could price below soybean meal by 2027, potentially disrupting current formulation hierarchies. Blockchain mandates are bifurcating the field between mills that invest in IBM Food Trust modules and small operators that pool resources through cooperatives, a dynamic anticipated to consolidate 10-15% of Southeast Asian capacity into shared platforms. Sensor-based feeders give early adopters an 8-12% efficiency edge and are pushing hardware firms like AKVA Group into service bundles that include formulation advice, deepening client stickiness and supporting future aquafeed market growth.
Aquafeed Industry Leaders
Tongwei Co., Ltd.
Guangdong HAID Group Co., Ltd.
Cargill, Incorporated
BioMar Group A/S
Charoen Pokphand Foods Public Company Limited
- *Disclaimer: Major Players sorted in no particular order


Market Opportunities and Future Outlook
Capacity build-out in emerging and export-driven aquaculture hubs is creating near-term whitespace for local blending, logistics, and species-specific formulations, especially where freight and tariff frictions make imported feed uncompetitive. East Africa is one example, with Tunga Nutrition (K) Limited commissioning a new aquafeed plant in Nairobi in February 2026 and expanding capacity from 24,000 to 45,000 metric tonnes, a signal that downstream demand can support more local production and tailored diets for regional species mixes and farm systems.
In the Americas and Asia, investment activity is pointing toward opportunities in high-performance feeds, supply security, and compliance-oriented product differentiation. Thai Union Feedmill announced a USD 55 million investment in Ecuador in February 2026 to lift aquafeed capacity by 80%, aligning with fast-scaling shrimp value chains that increasingly use functional and health-supporting additives to stabilize production. In China, BioMar announced plans in February 2026 to add a second line at Wuxi, increasing capacity by 50,000 tonnes (commissioning targeted for Q1 2027), reinforcing demand for premium, export-compliant diets and creating room for additive suppliers and alternative-protein sourcing partnerships that reduce fishmeal dependence. With marine-ingredient volatility and rising discharge constraints in several major farming geographies, adoption is also broadening for precision nutrition and delivery technologies (for example, lipid-based microencapsulation platforms such as Jefo Matrix Technology), which improve stability and nutrient utilization and help farms meet tighter effluent and residue requirements without relying on antibiotics.
Recent Industry Developments
- April 2026: Haid Group started construction of a 200,000 tonnes-per-year aquafeed facility in Phu Tho Province, Vietnam, via its subsidiary Yongfu Hailong Agricultural and Livestock Technology Co. Ltd. The project expands Southeast Asian manufacturing reach closer to major grow-out regions and export processors. It also raises competitive pressure on local mills by adding scale for commodity diets and a base for premium formulations tied to export compliance needs.
- October 2025: Skretting (Nutreco N.V.) launched Necto, a functional fish feed using proprietary EDGEOS PhytoComplexes positioned to support fish health, welfare, and resilience. Developed with research partners, the product represents a commercial application of plant-derived complexes in aquafeed. The launch supports a shift in purchasing toward health and performance claims rather than only growth and cost per ton.
- September 2024: Thailand saw a severe Early Mortality Syndrome impact that cut shrimp harvests by about 40%, triggering a sharp, quarter-level reduction in feed demand and forcing operational adjustments at some feed mills. The episode underscored how disease shocks can rapidly disrupt utilization rates and inventory planning across shrimp-focused producers. It also reinforced demand signals for functional additives and biosecurity-aligned nutrition as farms and mills work to reduce volatility in production cycles.


Research Methodology Framework and Report Scope
Market Definition and Coverage
For this study, the aquafeed market covers commercially manufactured feed sold for farmed aquatic species, including fish, shrimp, and mollusks. The scope includes complete feeds and functional formulations delivered in common formats such as pellets, extruded feed, powders, and liquids.
Scope exclusions: Non-commercial, on-farm prepared feeds made from unprocessed raw materials are excluded from this market sizing.
Segmentation Overview
- By Species
- Fish Feed
- Carp
- Salmon
- Tilapia
- Catfish
- Other Fish Feed
- Mollusk Feed
- Crustacean Feed
- Shrimp
- Other Crustacean Feed
- Other Aquafeed
- Fish Feed
- By Ingredient
- Cereals and Grains
- Oilseeds and Pulses
- Fish Meal and Fish Oil
- Novel Proteins (Insect, Algae, SCP)
- Additives
- Others
- By Additive Type
- Amino Acids
- Vitamins and Minerals
- Probiotics
- Enzymes
- Antioxidants
- Others
- By Form
- Pellets
- Extruded Feed
- Powder
- Liquid
- By Life-cycle Stage
- Starter
- Grower
- Finisher
- Broodstock
- By Geography
- North America
- United States
- Canada
- Mexico
- Rest of North America
- Europe
- Spain
- United Kingdom
- France
- Germany
- Italy
- Russia
- Rest of Europe
- Asia-Pacific
- China
- India
- Japan
- Thailand
- Vietnam
- Australia
- Rest of Asia-Pacific
- South America
- Brazil
- Argentina
- Rest of South America
- Middle East
- Turkey
- Saudi Arabia
- United Arab Emirates
- Rest of Middle East
- Africa
- South Africa
- Egypt
- Rest of Africa
- North America
Data Sources, Market Sizing, and Validation
Desk Research
Desk work starts by building the demand pool for aquaculture and feed usage using public data series and technical context. We mainly reference official and non-paywalled sources such as FAO fishery and aquaculture statistics, OECD-FAO outlook tables, UN Comtrade trade codes for key feed ingredients, and government agriculture and fisheries departments that publish aquaculture production updates. Peer reviewed nutrition and aquaculture journals are also used to understand changes in feed formulations and the direction of feed conversion trends.
After that, we layer in company annual reports, investor presentations, and association websites to map feed manufacturing footprints and pricing signals across regions. When needed, paid subscription sources for company financials and shipment-level import and export checks are used to verify ingredient flows and reduce missing data in smaller countries. The sources named here are illustrative only, and many other public references were used during data collection, validation, and clarification.
Primary Interviews and Surveys
Primary work focuses on validating how aquaculture output converts into feed demand and how pricing moves through the year. We speak with feed manufacturers, ingredient suppliers, distributors, and aquaculture operators across the Americas, EMEA, and APAC, so assumptions on feed type mix, farm intensity, and average selling prices can be checked and corrected.
Distribution of primary research fieldwork respondents
| Company type | Respondent position | Region |
|---|---|---|
| Top tier: 37% | CXOs: 13% | APAC: 39% |
| Mid tier: 49% | Functional/Unit leaders: 39% | EMEA: 36% |
| Smaller Players: 14% | Managers: 48% | Americas: 25% |
Market-Sizing & Forecasting
Sizing is built using top-down and bottom-up logic, but the main model is top-down, so it stays consistent across countries. In practice, aquaculture production and species mix are translated into feed consumption using practical feeding rates, and then the value is formed by applying region-specific price bands for main feed forms and nutrition levels. Key inputs that are tracked include farmed species output trends, the direction of feed conversion efficiency, the share of commercial feed versus farm-mixed feeding, ingredient cost pressure (fishmeal and soy protein as common references), and regional intensity shifts in shrimp and salmon farming.
Once the demand pool is calculated, we corroborate totals with selective bottom-up checks, such as rolling up a sampled set of supplier revenues, comparing capacity utilization comments from public disclosures, and running channel checks on price movements when public data is thin. Gaps are handled by using proxy countries with similar farming systems, then adjusting with expert inputs on commercial feed adoption and pricing spreads. For forecasting, scenario analysis is used so demand drivers (aquaculture growth and farm intensification) and cost drivers (ingredient substitution and formulation shifts) can be stress-tested, and then the most likely path is selected based on what industry participants expect over the next few years.
Data Validation & Update Cycle
Outputs are checked through triangulation across production signals, trade indicators for key ingredients, and price reality checks from interviews, which helps reduce overstatement from any single source. When a country or species line item looks unusual, the assumptions are re-opened, the math is rechecked, and follow-up calls are triggered to confirm what changed and why.
Before sign-off, the model goes through multi-step internal review so definitions, conversions, and currency handling are consistent across regions. Reports are refreshed annually, and interim updates are made if a material event changes the outlook, such as a major disease shock, policy shift, or a sharp ingredient price swing. Right before delivery, a fresh pass is completed so the final numbers reflect the latest available public updates.
Mordor Intelligence's Global Aquafeed Market Market Size Measured Against Other Published Estimates
Published aquafeed market values can look far apart even when they discuss the same theme, mainly because the boundary of what counts as aquafeed is not always consistent. The year used as the base, the way prices are averaged, and whether non-commercial feeding is counted explain most of the gap.
By tracking species-level aquaculture output and refreshing conversion and pricing inputs through interview checks, Mordor Intelligence keeps the estimate tied to commercial feed consumption and excludes on-farm mixed feeding that can inflate totals in high smallholder regions.
Benchmark comparison
| Source | Market Size | Gaps in Research Methodology |
|---|---|---|
| Mordor Intelligence | USD 51.30 B (2025) | |
| Regional Consultancy A | USD 62.30 B (2024) | Uses a different base year and appears to apply broader feed inclusion, with limited visibility on how non-commercial feeding and informal supply are treated in the value build. |
| Global Consultancy B | USD 71.28 B (2025) | Looks to include a wider definition and faster price progression, and the public summary does not clearly state how commercial feed only boundaries and regional ASP weighting are validated. |
The spread across the three numbers is mainly explained by what is counted as aquafeed and how pricing is averaged across regions and feed types. A repeatable model that links aquaculture output to feed usage, and then ties value to transparent price bands, gives decision-makers a practical number they can sanity-check and reuse.


Key Questions Answered in the Report
How large is the aquafeed market in 2026 and what growth is anticipated by 2031?
The aquafeed market size reached USD 53.80 billion in 2026 and is forecast to climb to USD 69.40 billion by 2031 at a 5.22% compound annual growth rate.
Which species segment is expanding the fastest?
Shrimp and other crustacean diets are advancing at a 5.4% compound annual growth rate through 2031 on rising vannamei exports from Ecuador and India.
What ingredient trend will shape formulation strategies through 2031?
Novel proteins such as insect meal and single-cell protein are growing at 6% a year as banks and retailers tie credit and shelf access to alternative-protein targets.
How are new regulations affecting traceability demands?
European deforestation rules and the United States Seafood Import Monitoring Program require blockchain-verified sourcing, pushing mills to adopt digital ledgers or risk losing export markets.
Page last updated on:


