Market Overview
| Study Period | 2020 - 2031 |
|---|---|
| Forecast Data Period | 2026 - 2031 |
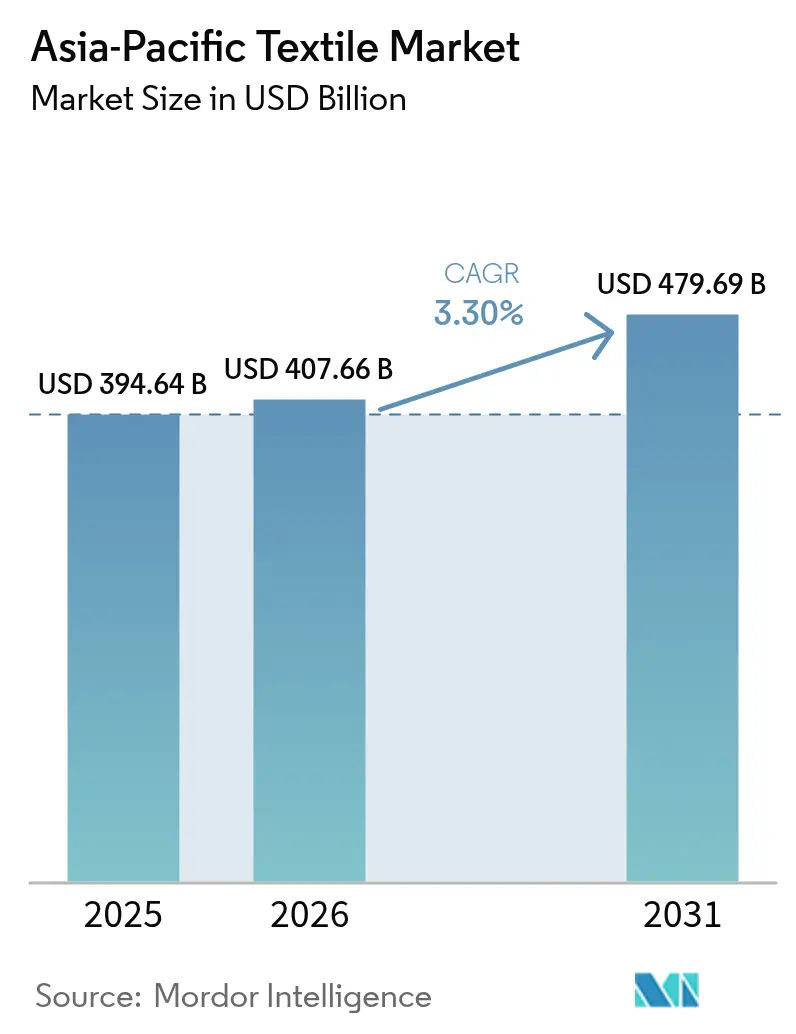
| Base Year Market Size (2025) | USD 394.64 Billion |
| Market Size (2026) | USD 407.66 Billion |
| Market Size (2031) | USD 479.69 Billion |
| Growth Rate (2026 - 2031) | 3.30% CAGR |
| Market Concentration | Low |
Major Players *Disclaimer: Major Players sorted in no particular order Image © Mordor Intelligence. Reuse requires attribution under CC BY 4.0. | |
Asia-Pacific Textile Market Analysis by Mordor Intelligence
The Asia-Pacific Textile Market size is expected to increase from USD 394.64 billion in 2025 to USD 407.66 billion in 2026 and reach USD 479.69 billion by 2031, growing at a CAGR of 3.30% over 2026-2031.
Sourcing patterns are shifting because new European sustainability laws now demand digital traceability and extended producer responsibility from every mill that sells into the bloc. Producers that can verify low emissions and transparent supply chains are winning long-term contracts, while those lacking data infrastructure are conceding orders. At the same time, near-shoring of orders from China to Vietnam, Indonesia, and India is gathering pace as brands diversify geopolitical risk and seek lead-time agility. Rising investment in recycled polyester, zero-liquid-discharge effluent systems, and renewable power is reshaping cost structures, and robotics-enabled micro-factories are shortening replenishment cycles for e-commerce brands.
Key Report Takeaways
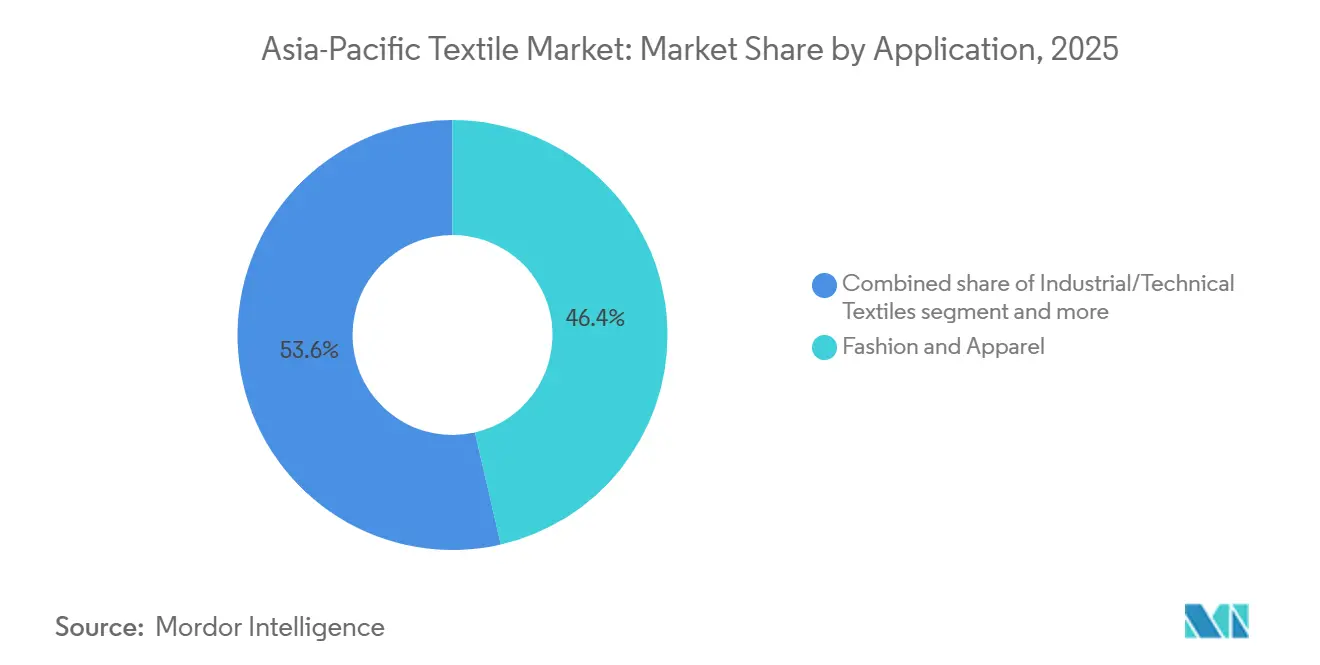
- By application, fashion and apparel generated 46.4% of the Asia-Pacific textile market revenue in 2025, while industrial and technical textiles are advancing at a 4.62% CAGR through 2031.
- By geography, China accounted for 58.17% of the Asia-Pacific textile market share in 2025, whereas ASEAN economies are forecast to expand at a 4.27% CAGR to 2031.
- By raw material, synthetic fibers captured 47.74% of the 2025 volume, and polyester is the fastest-growing sub-segment at a 5.03% CAGR.
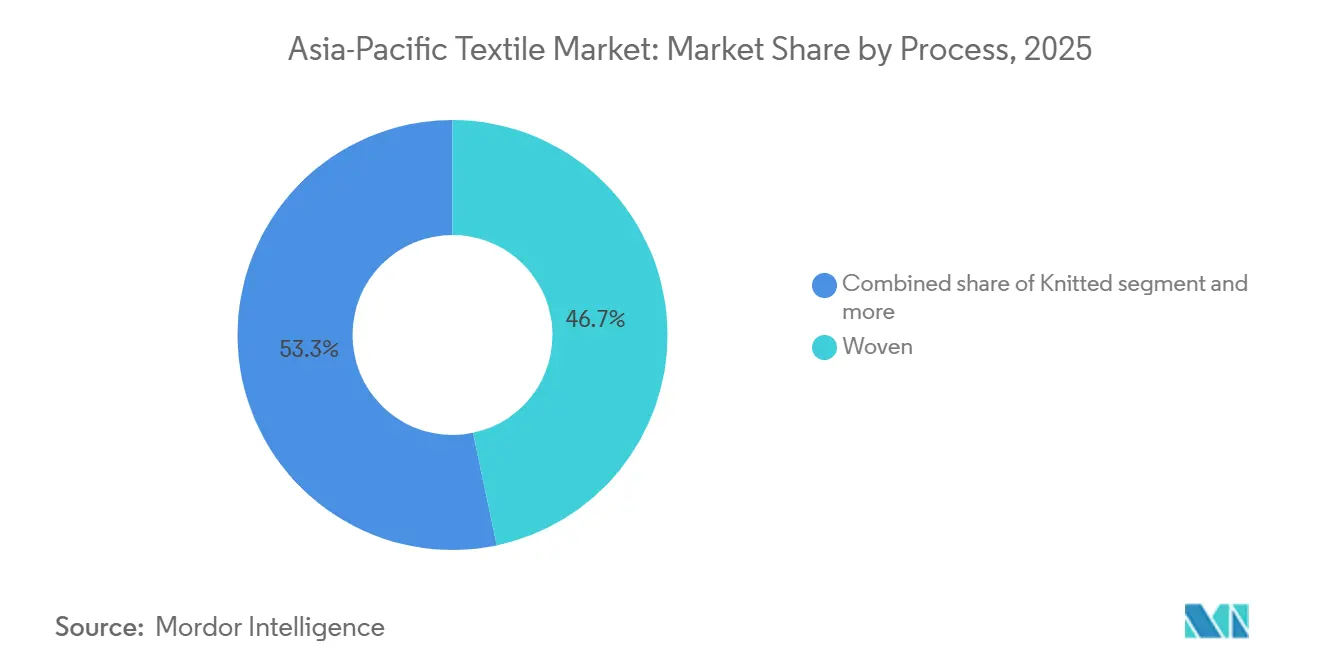
- By process, woven textiles held a 46.7% share in 2025, yet nonwoven output is climbing at a 4.52% CAGR on the back of hygiene and automotive demand.
Note: Market size and forecast figures in this report are generated using Mordor Intelligence’s proprietary estimation framework, updated with the latest available data and insights as of 2026.
Asia-Pacific Textile Market Trends and Insights
Drivers Impact Analysis*
| Drivers | (~) % Impact on CAGR Forecast | Geographic Relevance | Impact Timeline |
|---|---|---|---|
| China-plus-One near-shoring of order books to Vietnam, Indonesia & India | +0.8% | ASEAN (Vietnam, Indonesia, Thailand, Malaysia), India, spill-over to Bangladesh | Medium term (2-4 years) |
| EU digital-product-passport & EPR mandates accelerating compliant sourcing from APAC mills | +0.7% | Global, with concentrated impact on China, India, Bangladesh, Vietnam exporters to EU | Short term (≤ 2 years) |
| Rising disposable incomes fuelling premium & athleisure apparel demand | +0.6% | China, India, ASEAN core (Indonesia, Thailand, Philippines) | Medium term (2-4 years) |
| Scale-up of bio-based and chemically-recycled fibre capacity across the region | +0.5% | China, India, Thailand, Vietnam | Long term (≥ 4 years) |
| Expansion of omni-channel organized fashion retail into Tier-2/3 APAC cities | +0.4% | China, India, with early gains in tier-2 cities (Pune, Surat, Chengdu, Suzhou) | Medium term (2-4 years) |
| AI-driven, robotics-enabled micro-factories enabling ultra-fast replenishment for e-commerce brands | +0.3% | China, Japan, South Korea, with pilot deployments in India | Long term (≥ 4 years) |
| Source: Mordor Intelligence | |||


China-Plus-One Near-Shoring of Order Books
Geopolitical uncertainty and pandemic-era supply disruptions persuaded global brands to diversify sourcing beyond China. Fresh capacity announcements in Vietnam, Indonesia, and India reflect this reallocation. Indonesia’s USD 6 billion state-backed Danantara Textiles project, unveiled in 2025, is designed to anchor a fully integrated value chain.[1]ASEAN Secretariat, “Investment Report 2025,” asean.org Shorter lead times and tariff advantages make these destinations attractive, yet yarn and fabric inputs still originate mainly from China, highlighting an evolving but incomplete decoupling.
EU Digital-Product-Passport & EPR Mandates Accelerating Compliant Sourcing
The Ecodesign for Sustainable Products Regulation that took effect in 2026 requires every textile sold into Europe to carry a digital passport detailing fiber composition, emissions, and recyclability. Asian mills exporting to the bloc must install blockchain traceability and undergo costly third-party audits. India’s Kasturi Cotton initiative embeds QR-coded provenance data, giving compliant spinners an early-mover edge. Producers lacking transparent records are already losing contracts, and the looming 2028 extension of the EU Carbon Border Adjustment Mechanism to textiles will intensify the shift.
Rising Disposable Incomes Fuelling Premium & Athleisure Apparel Demand
An expanding middle class across emerging Asian economies is trading up from basic cotton garments to higher-margin performance wear. Moisture-wicking polyester, stretch denim, and branded athleisure lines now outpace overall apparel growth as consumers seek comfort and functionality. Filatex India’s 2025 launch of a recycled-polyester unit supplying 75 t/day targets this demand, unlocking better gross margins than commodity fabrics. Retailers reward mills that can deliver smaller lots quickly, encouraging investment in versatile knitting and dyeing lines. The premiumization trend underpins steady synthetic-fiber volume gains across the Asia-Pacific textile market.
Scale-Up of Bio-Based and Chemically Recycled Fibre Capacity
Brand circularity pledges and incoming recycled-content rules stimulate rapid investment in chemical recycling. Indorama Ventures and Jiaren formed a 2025 joint venture that targets up to 100,000 t/year of recycled-PET spinning capacity. Although recycled polyester currently trades at a modest premium, mills view compliance certainty as justification for high energy outlays. Thailand and China are also expanding capacities for bio-based polymers, giving the Asia-Pacific textile market an early leadership position in low-carbon fibers.
Restraints Impact Analysis*
| Restraints | (~) % Impact on CAGR Forecast | Geographic Relevance | Impact Timeline |
|---|---|---|---|
| EU Carbon Border Adjustment Mechanism (CBAM) compliance costs for high-emission APAC exporters | -0.6% | China, India, Bangladesh, Vietnam exporters to EU | Medium term (2-4 years) |
| Stricter zero-liquid-discharge wastewater mandates raising capex burden in China, India & Vietnam | -0.5% | China, India, Vietnam, with spillover to Bangladesh | Medium term (2-4 years) |
| Volatile LNG & coal prices squeezing dyeing / spinning gross margins | -0.4% | China, India, Bangladesh, with acute impact on coal-dependent dyeing clusters | Short term (≤ 2 years) |
| Loom-operator labour scarcity amid ageing workforce & rural out-migration | -0.3% | Japan, South Korea, China (coastal provinces), India (Tamil Nadu, Gujarat) | Long term (≥ 4 years) |
| Source: Mordor Intelligence | |||
EU Carbon Border Adjustment Mechanism Compliance Costs
The CBAM entered a transition phase in 2026 and is expected to cover textiles by 2028. Exporters with coal-heavy energy mixes will have to purchase carbon certificates, directly eroding free-on-board margins. Chinese and Bangladeshi mills are studying on-site solar arrays and renewable power purchase agreements, yet many face multi-year approval cycles. The added cost uncertainty is pushing some buyers toward lower-emission ASEAN mills.
Stricter Zero-Liquid-Discharge Wastewater Mandates
Governments in China, India and Vietnam issued 2025 roadmaps that force dyeing units to adopt zero-liquid-discharge systems within three to five years.[2]Ministry of Environment, Forest and Climate Change India, “ZLD Roadmap for Textile Clusters,” moef.gov.in Typical installations cost USD 2 to 4 million and raise operating expenses by 20 to 30%. Many small processors cannot fund upgrades and are exiting the market, accelerating capacity consolidation. Vertically integrated groups amortize the expenditure across larger revenue bases and market ZLD compliance as a competitive advantage.
*Our forecasts treat driver/restraint impacts as directional, not additive. The impact forecasts reflect baseline growth, mix effects, and variable interactions.
Segment Analysis
By Application: Technical Textiles Capture High-Margin Growth
Industrial and technical textiles contributed 4.62% CAGR through 2031, outpacing the Asia-Pacific textile market average, while fashion and apparel held 46.4% revenue share in 2025. Specialty demand for automotive lightweighting materials, medical nonwovens and filtration media underpins the segment. India’s National Technical Textiles Mission approved USD 177 million for 168 R&D projects, emphasizing carbon fiber and aramid applications. These projects anchor domestic substitution of imported high-performance fabrics and expand export potential.
The Asia-Pacific textile industry now sees protective, medical and mobility applications as profit centers because gross margins exceed 25%, versus 12-18% for mass-market apparel. Chinese producers concentrate on geotextiles for infrastructure, while Indian mills prioritize medical disposables. ASEAN capacity remains limited, presenting a clear white-space opportunity. Technical-textile orders are often multi-year and specification heavy, favoring players with testing labs and certified quality systems.


By Raw Material: Polyester Steers Synthetic Upswing
Synthetic fibers represented 47.74% of 2025 volume, and polyester is growing fastest at 5.03% CAGR. Multiple greenfield plants in China, India and Vietnam came online between 2025 and 2026. For instance, Century Synthetic Fiber opened a USD 129 million Vietnam line that adds 60,000 t/year of polyester staple and 15,000 t of fabric. Recycled polyester is a bright spot: Indorama Ventures and Jiaren target 100,000 t/year of chemically recycled PET, supplying brands that require traceable post-consumer content.
Natural fibers such as cotton still command cultural loyalty, but water stress and yield variability limit expansion. Rayon and viscose benefit from eased quality controls in India, whereas nylon and acrylic continue to lose share because they are harder to recycle. Specialty high-performance fibers aramid, carbon, UHMWPE remain niche yet strategic, supported by mission funding under India’s technical-textiles program.
By Process / Technology: Nonwoven Scaling for Hygiene and Auto Uses
Woven fabrics captured 46.7% of 2025 volume, yet nonwoven output is the fastest-growing process at 4.52% CAGR, thanks to diaper, medical and EV interior demand. Indorama Ventures’ USD 100 million high-loft spunbond line in North Carolina uses Reicofil technology with tri-layer lamination to serve hygiene clients. Malaysian producer Oceancash Pacific doubled capacity to 16,000 t/year in 2025, highlighting regional appetite for PPE and sanitary materials.
Spunbond and meltblown dominate because of high output and low cost, while needlepunch serves geotextile and acoustic insulation niches. Knits grow in line with athleisure demand but face margin squeezes from polyester oversupply. Spacer fabrics and 3-D weaves, though small today, attract automotive OEMs seeking weight savings, positioning the Asia-Pacific textile market for an engineering pivot.
Geography Analysis
China still generated 58.17% of regional revenue in 2025, yet its share is edging down as stricter emissions rules and higher wages push brands to diversify orders. Mills invest in rooftop solar and zero-liquid-discharge effluent plants to retain EU clients, while some relocate polyester filament lines to Indonesia to leverage ASEAN trade pacts. The policy drive toward carbon neutrality by 2060 will keep capital requirements high and margin pressure persistent.
ASEAN nations are the fastest-growing bloc at a projected 4.27% CAGR through 2031. Vietnam combines established cut-make-trim clusters with new upstream polyester capacity, boosting self-reliance. Indonesia’s Danantara Textiles mega-project illustrates government-backed ambitions to capture yarn-to-garment value. Thailand leverages chemical expertise for recycled-polyester and biopolymer initiatives. Together, these economies erode China’s preeminence and diversify the Asia-Pacific textile market supply map.
India positions itself as a full-value-chain alternate hub. Seven PM MITRA parks and the Production Linked Incentive scheme attracted USD 3.3 billion in signed memoranda during 2025.[3]Press Information Bureau Government of India, “PM MITRA Mega Integrated Textile Region and Apparel Parks Update,” pib.gov.in Technical textiles receive more than half of proposed investment, signaling a shift from commodity cotton toward high-margin segments. Nevertheless, port congestion and intermittent power supply remain execution hurdles. Mature, high-income markets such as Japan and South Korea focus on smart fabrics and advanced composites, often through consolidations like the Teijin-Asahi Kasei merger taking effect in 2026.
Competitive Landscape
The Asia-Pacific textile market is moderately fragmented; the top 10 groups command roughly 30% of revenue. Competitive intensity rose sharply after Japanese stalwarts Teijin and Asahi Kasei agreed in 2025 to merge their textile businesses into an 80-20 joint venture effective October 2026. The deal pools premium fiber R&D, global procurement and trading networks to counter low-cost ASEAN entrants and absorb the capital load of EU traceability mandates.
Indian conglomerates scale aggressively under government incentives. Arvind earmarked USD 57 million for FY 2026 to raise annual garment output from 40 million to 60 million pieces while widening its advanced-materials range. Vardhman and Raymond pursue similar vertical integration, embedding spinning, weaving and finishing inside single campuses to cut logistics time and secure power-purchase agreements for renewable energy.
Chinese mills respond by exporting capacity. New filament and fabric plants in Vietnam and Indonesia sidestep tariff walls and bring production closer to destination ports. Larger groups integrate blockchain traceability and AI-driven demand planning to retain EU and U.S. accounts, whereas small converters without digital tools struggle to stay on preferred-supplier lists. Nonwoven expansion, chemical recycling and robotics-enabled micro-factories raise capital thresholds, accelerating consolidation across the Asia-Pacific textile market.
Asia-Pacific Textile Industry Leaders
Shenzhou International Group
Weiqiao Textile
Texhong Textile Group
Toray Industries
Arvind Ltd
- *Disclaimer: Major Players sorted in no particular order


Recent Industry Developments
- January 2026: Beaulieu International Group bought Austrian fiber specialist IFG Asota, adding polypropylene, polyamide and bio-based polymers to its synthetic portfolio.
- December 2025: Teijin and Asahi Kasei announced an absorption-type merger of their textile units, effective Oct 2026.
- December 2025: Yanpai Group ordered two ANDRITZ needlepunch lines for Q3 2026 start-up, boosting filtration and industrial-nonwoven capacity.
- November 2025: Indorama Ventures and Jiaren formed a joint venture to create up to 100,000 t/year of chemically recycled PET spinning capacity.


Asia-Pacific Textile Market Report Scope
The textile industry involves sections like research, design, development, manufacturing, and distribution of textiles, fabrics, and clothing. A complete background analysis of the Asia-Pacific Textile Market, including the assessment of the economy and contribution of sectors in the economy, market overview, market size estimation for key segments, and emerging trends in the market segments, market dynamics, and geographical trends, and COVID-19 impact is included in the report.
The Asia-Pacific textile market is segmented by application (clothing, industrial and technical, household, and other applications), by material (cotton, jute, silk, synthetics, and wool), and by geography (China, India, Pakistan, Bangladesh, Australia, and Rest of Asia-Pacific). The report offers market size and forecasts for the Asia-Pacific Textile Market in value (USD) for all the above segments.
By Application
| Fashion & Apparel |
| Industrial/Technical Textiles |
| Household & Home Textiles |
| Medical & Healthcare Textiles |
| Automotive & Transport Textiles |
| Others (Protective, Sports Textiles, etc.) |
By Raw Material
| Natural Fibers | Cotton |
| Wool | |
| Silk | |
| Synthetic Fibers | Polyester |
| Nylon | |
| Rayon / Viscose | |
| Acrylic | |
| Polypropylene | |
| Recycled Fibers | |
| Others (Speciality High-Performance Fibers (Aramid, Carbon, UHMWPE)) |
By Process / Technology
| Woven | |
| Knitted | |
| Non-woven | Spunlaid (Spunbond / Melt-blown) |
| Dry-laid Hydro-entangled | |
| Wet-Laid | |
| Needle-punched | |
| 3-D Weaving & Spacer Fabrics |
By Geography
| China |
| India |
| Bangladesh |
| Australia |
| South Korea |
| Japan |
| ASEAN (Indonesia, Thailand, Philippines, Malaysia, Vietnam) |
| Rest of Asia-Pacific |
| By Application | Fashion & Apparel | |
| Industrial/Technical Textiles | ||
| Household & Home Textiles | ||
| Medical & Healthcare Textiles | ||
| Automotive & Transport Textiles | ||
| Others (Protective, Sports Textiles, etc.) | ||
| By Raw Material | Natural Fibers | Cotton |
| Wool | ||
| Silk | ||
| Synthetic Fibers | Polyester | |
| Nylon | ||
| Rayon / Viscose | ||
| Acrylic | ||
| Polypropylene | ||
| Recycled Fibers | ||
| Others (Speciality High-Performance Fibers (Aramid, Carbon, UHMWPE)) | ||
| By Process / Technology | Woven | |
| Knitted | ||
| Non-woven | Spunlaid (Spunbond / Melt-blown) | |
| Dry-laid Hydro-entangled | ||
| Wet-Laid | ||
| Needle-punched | ||
| 3-D Weaving & Spacer Fabrics | ||
| By Geography | China | |
| India | ||
| Bangladesh | ||
| Australia | ||
| South Korea | ||
| Japan | ||
| ASEAN (Indonesia, Thailand, Philippines, Malaysia, Vietnam) | ||
| Rest of Asia-Pacific | ||


Key Questions Answered in the Report
How large will the Asia-Pacific textile market be by 2031?
It is forecast to reach USD 479.69 billion by 2031, expanding at a 3.30% CAGR from 2026 to 2031.
Which segment is growing fastest within the region?
Industrial and technical textiles are the fastest, advancing at a 4.62% CAGR on demand from automotive, medical and filtration uses.
Why are brands shifting orders away from China?
Stricter environmental rules, higher wages and geopolitical risk are prompting buyers to diversify into Vietnam, Indonesia and India.
How are mills addressing EU sustainability rules?
Leading producers invest in blockchain traceability, zero-liquid-discharge effluent systems and recycled-fiber capacity to comply with the Digital Product Passport and forthcoming CBAM.
What technology trends are reshaping production?
AI scheduling, robotic sewing and chemical recycling plants enable micro-factory models, shorter lead times and circular material flows.
Which raw material shows the strongest volume growth?
Polyester, especially recycled PET, is the fastest-expanding fiber, growing at 5.03% CAGR through 2031.
Page last updated on:


