ANZ Location-based Services Market Size and Share
Market Overview
| Study Period | 2020 - 2031 |
|---|---|
| Forecast Data Period | 2026 - 2031 |
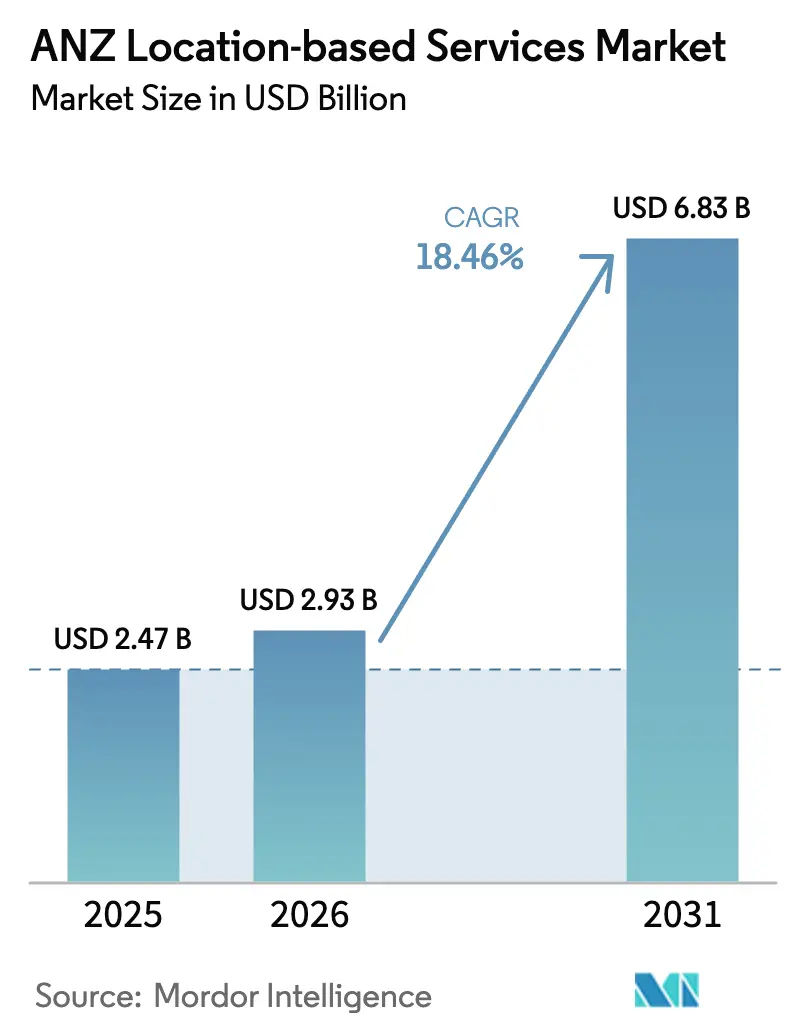
| Base Year Market Size (2025) | USD 2.47 Billion |
| Market Size (2026) | USD 2.93 Billion |
| Market Size (2031) | USD 6.83 Billion |
| Growth Rate (2026 - 2031) | 18.46% CAGR |
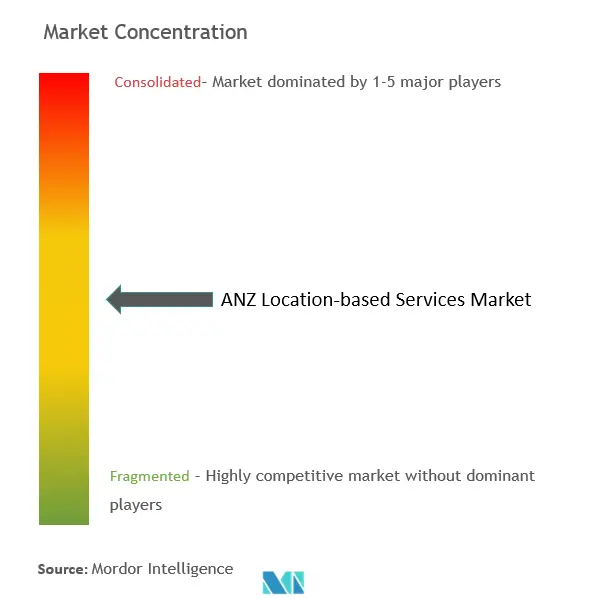
| Market Concentration | Medium |
Major Players *Disclaimer: Major Players sorted in no particular order Image © Mordor Intelligence. Reuse requires attribution under CC BY 4.0. | |
ANZ Location-based Services Market Analysis by Mordor Intelligence
The ANZ Location-based Services market size was valued at USD 2.47 billion in 2025 and estimated to grow from USD 2.93 billion in 2026 to reach USD 6.83 billion by 2031, at a CAGR of 18.46% during the forecast period (2026-2031). Pervasive 5G deployments, government open-data mandates and the mining sector’s appetite for centimeter-level digital twins are combining to accelerate commercial adoption across asset-intensive industries. Growing roll-outs of private-LTE inside airports, hospitals and distribution centers are lowering latency barriers for indoor positioning, while new spectrum allocations in the 3.5 GHz and 6 GHz bands are lifting accuracy ceilings for both ultra-wideband (UWB) and advanced Wi-Fi solutions. Public-sector investment programs such as Digital Twin Victoria and SouthPAN are cementing a shared, high-quality geospatial foundation that private developers can build on. Fleet-telematics growth continues to compound as electronic road-user charging rules broaden, and retailers are experimenting with geomarketing systems that deliver hyper-local offers without breaching emerging privacy codes. These converging forces position the ANZ Location-based Services market as one of the world’s fastest-growing test beds for next-generation positioning technologies.
Key Report Takeaways
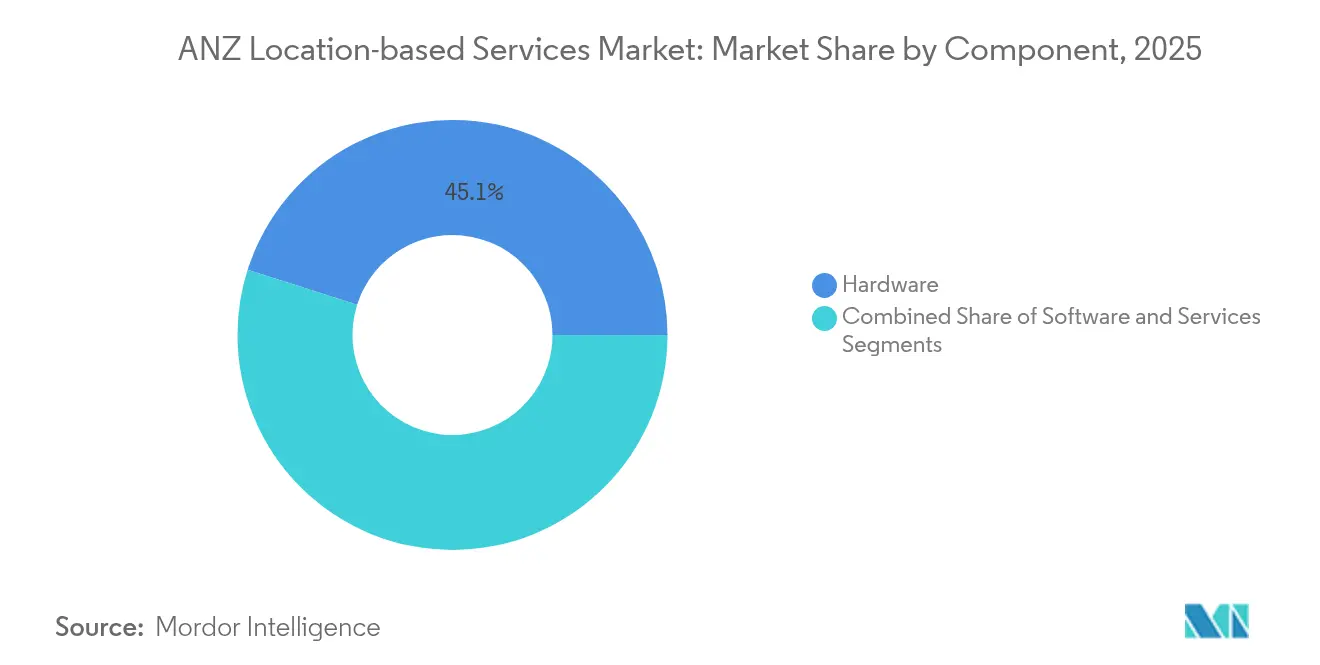
- By component, hardware led with 45.10% of the 2025 ANZ Location-based Services market share, while services is projected to advance at a 23.55% CAGR through 2031.
- By location type, outdoor deployments commanded 59.85% of the 2025 value, whereas indoor positioning is forecast to expand at a 19.45% CAGR to 2031.
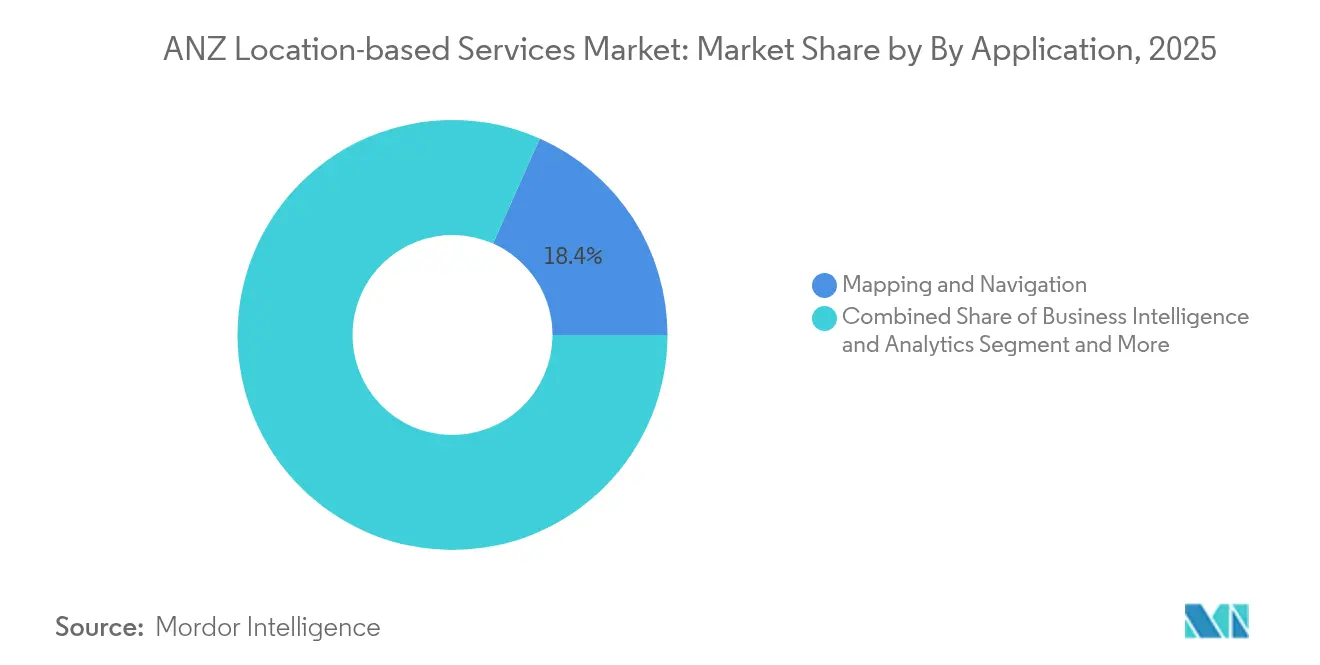
- By application, mapping and navigation accounted for an 18.35% slice of the ANZ Location-based Services market size in 2025, yet location-based advertising is climbing at a 22.18% CAGR over the same horizon.
- By end-user vertical, transportation and logistics held 28.05% of spending in 2025, while hospitality is pacing ahead at a 20.39% CAGR through 2031.
Note: Market size and forecast figures in this report are generated using Mordor Intelligence’s proprietary estimation framework, updated with the latest available data and insights as of 2026.
ANZ Location-based Services Market Trends and Insights
Drivers Impact Analysis*
| Driver | (~) % Impact on CAGR Forecast | Geographic Relevance | Impact Timeline |
|---|---|---|---|
| Pervasive 5G and private-LTE roll-outs boosting indoor precision | +3.2% | ANZ core markets, urban centers | Medium term (2-4 years) |
| Expansion of fleet-telematics across ANZ logistics | +2.8% | Australia dominant, NZ emerging | Short term (≤ 2 years) |
| Retail push for hyper-local customer engagement / geomarketing | +2.1% | Major metropolitan areas | Short term (≤ 2 years) |
| Government open-data geospatial initiatives | +1.9% | National programs, state-level implementation | Long term (≥ 4 years) |
| Mining and agri-digital twins requiring sub-meter accuracy | +1.6% | Rural Australia, specialized zones | Medium term (2-4 years) |
| Smart-hospital way-finding and asset-tracking pilots | +1.4% | Urban healthcare networks | Long term (≥ 4 years) |
| Source: Mordor Intelligence | |||
Pervasive 5G and private-LTE roll-outs boosting indoor precision
New Zealand’s decision to grant each operator 80 MHz of 3.5 GHz spectrum creates the density needed for centimeter-level positioning in warehouses and terminals; Spark’s private 5G at Auckland Airport already supports drone-based inventory audits every night instead of quarterly manual counts [1]Geospatial Council of Australia, “Geospatial sector set to deliver USD 689 billion economic impact to Australia by 2034, GCA report finds,” geospatialcouncil.org.au . Australia’s allocation of 6 GHz for indoor Wi-Fi further complements UWB tags, giving factories an RF toolkit that fuses bandwidth and accuracy. Integrators report that combining UWB with 5G reduces indoor location error by 70% compared with legacy Wi-Fi alone. Vendors now package 5G small-cells with RTLS middleware, shrinking deployment time from months to days. As more enterprises shift from proof-of-concept to production roll-outs, capital outlays move from pilot budgets into mainstream IT planning.
Expansion of fleet-telematics across ANZ logistics
Fuel-price volatility and a chronic driver shortage are persuading fleet owners to digitize route planning, maintenance and compliance. EROAD’s FY25 interim revenue climbed to NZD 95.9 million, up 8%, driven by demand for light-vehicle road-user-charging modules that automate tax collection. Transurban’s automated-truck study on Melbourne’s CityLink showed that real-time road geometry reduces lane-keeping errors by 42%, illustrating location data’s safety dividend. With 91% of New Zealand’s light-vehicle RUC still processed manually, the addressable pool for telematics remains sizeable, reinforcing double-digit growth prospects for the ANZ Location-based Services market.
Retail push for hyper-local customer engagement / geomarketing
Telstra Retail’s in-store analytics platform reaches 95% accuracy in counting footfalls using existing CCTV plus AI at the edge, translating into a 7% lift in conversion rates within six months of roll-out. Beacon-triggered offers now deliver redemption rates three times higher than generic SMS promotions, nudging merchants to redirect spend from above-the-line channels. Privacy-enhancing computation such as differential privacy helps chains comply with Consumer Data Right rules while still refining cohort targeting. As cost-per-visit metrics beat traditional display benchmarks, retailers are tying location data into loyalty apps, setting the stage for sustained demand inside the ANZ Location-based Services market.
Government open-data geospatial initiatives
The Geocoded National Address File (G-NAF) provides 15 million standardized addresses free of charge, saving start-ups an estimated AUD 3 million in first-year data acquisition costs. New Zealand’s SouthPAN will cut GNSS error from 5 m to under 20 cm for mass-market devices, unlocking applications such as lane-level navigation and variable-rate fertilizer spreaders. By embedding data-sharing obligations into legislation, Canberra and Wellington are lowering entry barriers for smaller developers, broadening the competitive field inside the ANZ Location-based Services market.
Restraint Impact Analysis*
| Restraint | (~) % Impact on CAGR Forecast | Geographic Relevance | Impact Timeline |
|---|---|---|---|
| Heightened privacy legislation (Consumer Data Right, NZ Privacy Act) | -2.4% | National implementation, varying enforcement | Short term (≤ 2 years) |
| GNSS multipath errors in dense urban canyons | -1.8% | Major metropolitan areas | Medium term (2-4 years) |
| Fragmented spectrum policy for indoor UWB/BLE | -1.3% | Regulatory jurisdiction boundaries | Long term (≥ 4 years) |
| Skills shortage in geo-AI model development | -1.1% | Technology hubs, specialized industries | Medium term (2-4 years) |
| Source: Mordor Intelligence | |||
Heightened privacy legislation (Consumer Data Right, NZ Privacy Act)
Explicit consent, data-holder accreditation and mandatory deletion protocols are adding as much as 12 weeks to project timelines for start-ups, raising cash-burn rates. The ACCC’s 2024 inquiry found that 84% of Australians want granular control over location sharing, prompting firms to embed new UX flows that slow onboarding [2]Australian Competition and Consumer Commission, “Digital Platform Services Inquiry – March 2024 Interim Report,” accc.gov.au. Compliance spending now averages 4% of annual revenue among mid-size location SaaS providers. Larger incumbents are weathering the cost, but smaller entrants may exit or pivot, trimming new-entrant momentum within the ANZ Location-based Services market.
GNSS multipath errors in dense urban canyons
Satellite Navigation research shows that smartphone accuracy degrades from 1.5 m in open sky to roughly 2.5 m on Sydney’s George Street because of signal reflection. Although 3D-mapping-aided GNSS can filter out non-line-of-sight signals, the technique needs high-resolution city models that remain incomplete for Brisbane and Perth. Assisted-GNSS PPP-B2b cuts time-to-first-fix dramatically, yet rollout depends on a patchwork of ground reference stations that few private actors are willing to fund alone. For turn-by-turn apps, a 1 m error may be tolerable, but for autonomous shuttles or asset-theft insurance the shortfall forces continued investment in complementary sensors. This technical ceiling restrains high-value urban applications inside the ANZ Location-based Services market.
*Our forecasts treat driver/restraint impacts as directional, not additive. The impact forecasts reflect baseline growth, mix effects, and variable interactions.
Segment Analysis
By Component: Hardware Foundations, Services Momentum
Hardware accounted for 45.10% of 2025 revenue as enterprises raced to install 5G-ready small cells, UWB anchors and dense BLE beacons essential for sub-meter precision. Industrial buyers gravitated toward multimode gateways able to triangulate across Wi-Fi RTT, UWB and angle-of-arrival BLE, thereby prolonging asset lifecycles amid evolving standards. Demand for semiconductors optimized for low-power positioning—such as Qorvo’s channel-sounding chips—helped fabless suppliers secure long-term design wins in healthcare and warehousing. In contrast, cloud-native software stacks delivered by Mapbox, Esri and GapMaps lowered entry barriers for analytic functions, letting non-GIS specialists consume advanced geofencing and isochrone APIs without heavy upfront licensing.
The services line is accelerating at a 23.55% CAGR as enterprises outsource design, calibration and life-cycle management. Managed-RTLS subscriptions include hardware swaps, firmware updates and machine-learning model retraining, converting one-off capex into predictable opex. movement’s solar-powered livestock tags exemplify this pivot: ranchers pay a software-as-a-service fee that bundles connectivity, analytics and battery replacement, reducing total cost of ownership by 30% in large cattle stations. As compliance frameworks grow more intricate, consulting around Consumer Data Right audits and Spectrum-Emissions compliance is inflating the addressable pool for specialist integrators. The resulting mix positions services to overtake hardware spending midway through the forecast period, reinforcing a value-chain shift inside the ANZ Location-based Services market.


By Location Type: Indoor Catch-Up Against Outdoor Dominance
Outdoor positioning remained the mainstay with 59.85% of spending in 2025, buoyed by well-entrenched agriculture, mining and freight telematics use cases. SouthPAN’s augmentation layer promises centimeter-grade accuracy across 10 million km² of land and sea, widening adoption in variable-rate agriculture and haul-road automation. Yet the momentum is tilting indoors; UWB tag shipments into ANZ doubled during 2024, driven by hospital asset tracking and pick-to-light warehouse systems.
Indoor projects are projected to log a 19.45% CAGR through 2031, reflecting private-5G network growth and regulators’ moves to harmonize 6 GHz unlicensed spectrum. In the first operational year at Sydney’s Royal Prince Alfred Hospital, a Bluetooth-Angle-of-Arrival RTLS shaved 18 minutes off average asset location time, releasing 1,500 clinical hours back to patient care. Spark New Zealand’s end-to-end indoor stack pairs 5G core slicing with a location middleware broker that standardizes coordinates across beacons, cameras and RFID. This multifactor approach is reducing infrastructure duplication, making ROIs attractive even in mid-sized facilities and bolstering the ANZ Location-based Services market.
By Application: Advertising Surges Past Traditional Navigation
Mapping and navigation still held an 18.35% share of the ANZ Location-based Services market size in 2025, powered by daily consumer reliance and ongoing traveler demand for multimodal routing. Continuous data-collection programs such as Apple’s Look Around drive map freshness, while HERE Technologies’ Omdia-leading platform provides automakers with advanced lane topology and HD map layers. However, the locus of growth is shifting toward rich-media ad experiences delivered through proximity triggers.
Location-based advertising is on track for a 22.18% CAGR, reflecting larger retail digital budgets chasing in-store conversion. Retailers stitch camera vision, Wi-Fi sniffers and point-of-sale records to feed models that predict dwell time and product affinity in real time. A national home-improvement chain saw basket size jump 9% within six months of adding UWB-triggered aisle offers. Meanwhile, business-intelligence dashboards that fuse location and supply-chain data are closing decision loops in hours rather than days. Entertainment apps tap geofilters and AR lenses to drive user-generated content, although privacy opt-outs among younger demographics compel on-device processing. The net effect is a diversified revenue base that powers future waves of investment into the broader ANZ Location-based Services market.
By End-user Vertical: Hospitality’s Rapid Climb
Transportation and logistics commanded 28.05% of 2025 expenditure as regulators tighten electronic logging and tolling requirements. The segment’s dependence on accurate, tamper-proof odometer data fortifies demand for calibrated GNSS modules and advanced dead-reckoning sensors deployed on trucks and inland shipping barges. Mining firms augment haul-trucks with UWB to prevent collisions in low-visibility pits, amplifying outdoor revenues.
Hospitality is emerging as the fastest mover, rising at a 20.39% CAGR as hotels and theme parks implement crowd-flow analytics, way-finding and asset-tracking to improve guest satisfaction. A Gold Coast resort deploying a BLE/UWB overlay cut queue times for ride bookings by 25%, directly lifting Net Promoter Score. Government agencies employ digital twins to model flood evacuation routes, and BFSI institutions integrate geofencing into credit-card fraud detection. Manufacturers adopt indoor RTLS for just-in-sequence assembly, seeking to trim work-in-process stocks by double digits. The wide dispersion of use cases illustrates why the ANZ Location-based Services industry is diversifying beyond its traditional transport epicenter.
Geography Analysis
Australia accounted for roughly three-quarters of 2025 revenue, supported by a population five times New Zealand’s and deep mining, logistics and retail sectors. State programs such as Digital Twin Victoria channel AUD 37.4 million (USD 24.8 million) into unified 3D city models that feed construction permitting and environmental modeling workflows. The Consumer Data Right furthers nationwide data availability while mandating explicit consent, enabling innovation without sacrificing trust. Urban corridors such as the Eastern Seaboard serve as early adopters for indoor precision, whereas the Pilbara leans on satellite-connected sensors for asset situational awareness.
New Zealand represents 25.70% of today’s spend but posts a projected 20.88% CAGR, the fastest in the region, powered by progressive data-sharing statutes encapsulated in the Customer and Product Data Act 2025. SouthPAN’s centimeter-grade augmentation, co-funded with Australia, turbo-charges rural use cases in dairy and forestry while reinforcing resilience in disaster response. Spark’s private-network blueprint at Auckland Airport demonstrates a willingness to leapfrog legacy Wi-Fi, offering a replicable template for ports and stadiums. One New Zealand’s Starlink-to-mobile roadmap promises near-continuous coverage for remote tourism venues and national-park rangers, potentially opening green-field service categories once outside cellular reach.
Cross-Tasman policy dialogs aim to align spectrum in the 6 GHz band and harmonize privacy consent frameworks, encouraging multi-country platform deployments. Analysts expect regulatory convergence to spur a wave of API-first start-ups able to sell into both markets without major localization overhead. As satellite augmentation, private 5G and dense urban Wi-Fi converge, the geography-specific constraints that once segmented market niches are dissolving, allowing the ANZ Location-based Services market to operate more like a single economic zone.
Competitive Landscape
The ANZ Location-based Services market is moderately fragmented, with platform giants, telcos and focused niche players jockeying for share. Google, Apple and Microsoft wield cross-device ecosystems that funnel billions of daily location pings into their maps, ad networks and cloud AI pipelines. HERE Technologies tops independent ranking tables for automotive-grade mapping, supplying multiple OEM navigation stacks and fleet OEMs. Telstra, Optus and Spark integrate satellite direct-to-device and 5G private slices into vertical packages spanning agriculture, healthcare and mining.
Differentiation increasingly hinges on data provenance, edge-AI throughput and multi-modal fusion of GNSS, cellular and sensor inputs. Patent filings for semantic robotic-cloud systems and reality-mapping pipelines point to an arms race around environmental context extraction. Smaller outfits such as BlueCats, Ubisense and Hexagon leverage domain know-how in facilities or process industries to defend margins despite scale disadvantages. Telco incumbents bundle connectivity with managed-service SLAs that guarantee positioning error thresholds, monetizing existing mobile network assets.
Strategic alliances remain the primary path to fill capability gaps. Trimble, Vantage NSW and AGCO formed a consortium to mesh precision agriculture hardware with autonomous tractors across Australia’s broadacre farms. NEXTDC’s partnership with Google’s Australia Connect subsea-cable project adds backbone capacity, supporting low-latency map-tile serving for downstream developers. As platform-level APIs commoditize basic geocoding, value migrates to vertical-specific data layers, computer-vision cleaning and privacy-preserving analytics, leaving room for specialized providers to thrive within the broader ANZ Location-based Services market.
ANZ Location-based Services Industry Leaders
Google LLC
Microsoft Corporation
Apple Inc.
Huawei Technologies Co. Ltd
Cisco Systems, Inc.
- *Disclaimer: Major Players sorted in no particular order

Recent Industry Developments
- May 2025: Telstra announced satellite-to-mobile messaging trials with SpaceX Starlink, exchanging 55,000 SMS in fringe-coverage areas.
- May 2025: Spark New Zealand and Air New Zealand activated the country’s first private 5G network at Auckland Airport to power drone-based inventory counts.
- April 2025: Apple expanded its Maps image-collection program across additional Australian regions to enhance Look Around coverage.
- January 2025: Telstra formalized its partnership with SpaceX to introduce satellite-to-mobile services for regional customers.


ANZ Location-based Services Market Report Scope
Location-based services (LBSs) are computer or mobile applications that provide information based on the device's location and the user, primarily through mobile portable devices, such as smartphones and mobile networks. The precision of the location services primarily depends on the hardware and software used in the mobile communication system, along with the positioning server.
The ANZ location-based services market is segmented by location (indoor and outdoor), service type (managed and professional), and end-user (transportation and logistics, manufacturing, retail and consumer goods, healthcare, automotive, and other end-user).
The market sizes and forecasts are provided in terms of value (USD) for all the above segments.
| Hardware |
| Software |
| Services |
| Indoor |
| Outdoor |
| Mapping and Navigation |
| Business Intelligence and Analytics |
| Location-based Advertising |
| Social Networking and Entertainment |
| Other Applications |
| Transportation and Logistics |
| IT and Telecom |
| Healthcare |
| Government |
| BFSI |
| Hospitality |
| Manufacturing |
| Other End-users |
| By Component | Hardware |
| Software | |
| Services | |
| By Location Type | Indoor |
| Outdoor | |
| By Application | Mapping and Navigation |
| Business Intelligence and Analytics | |
| Location-based Advertising | |
| Social Networking and Entertainment | |
| Other Applications | |
| By End-user Vertical | Transportation and Logistics |
| IT and Telecom | |
| Healthcare | |
| Government | |
| BFSI | |
| Hospitality | |
| Manufacturing | |
| Other End-users |


Key Questions Answered in the Report
What is the current value of the ANZ Location-based Services market?
The ANZ Location-based Services market size reached USD 2.93 billion in 2026 and is projected to rise to USD 6.83 billion by 2031.
Which segment is growing fastest within the ANZ Location-based Services market?
Location-based advertising is expanding at a 22.18% CAGR, making it the fastest-growing application segment.
How quickly is indoor positioning adoption growing?
Indoor deployments are forecast to grow at a 19.45% CAGR through 2031, driven by 5G private networks and UWB roll-outs.
Why is New Zealand expected to outpace Australia in growth?
Progressive data-sharing laws, SouthPAN’s accuracy upgrades and early private-5G pilots position New Zealand for a 20.88% CAGR to 2031.
Page last updated on:


