ANZ Geospatial Analytics Market Size and Share
Market Overview
| Study Period | 2020 - 2031 |
|---|---|
| Forecast Data Period | 2026 - 2031 |
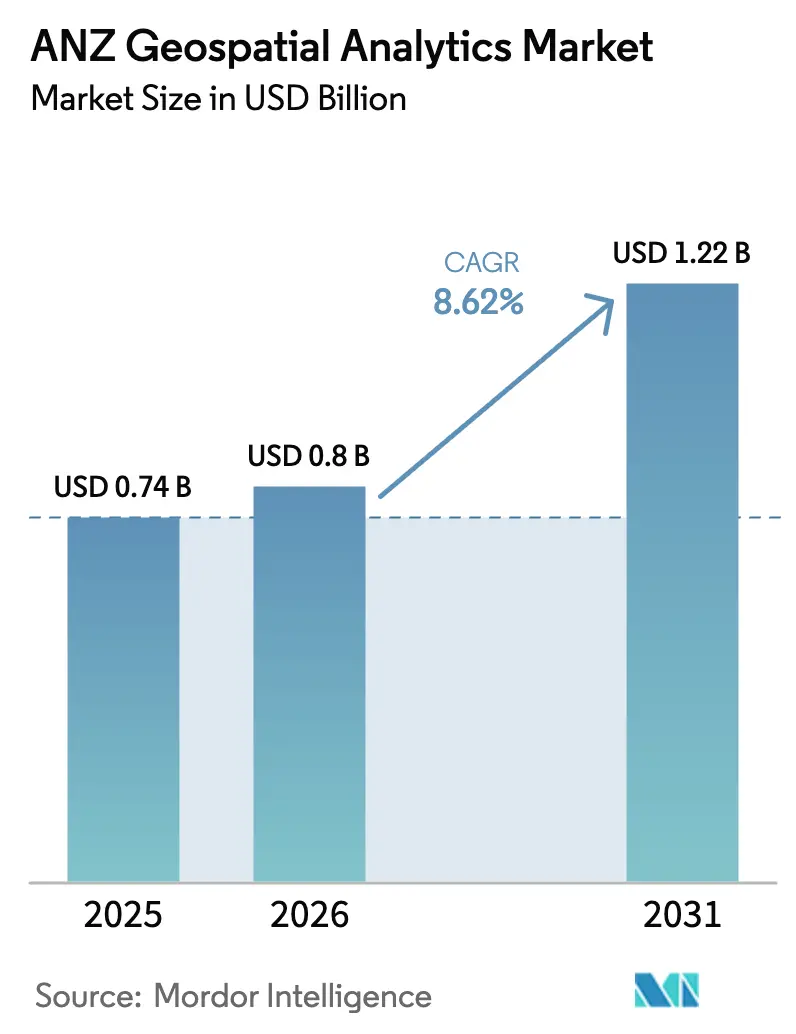
| Base Year Market Size (2025) | USD 0.74 Billion |
| Market Size (2026) | USD 0.8 Billion |
| Market Size (2031) | USD 1.22 Billion |
| Growth Rate (2026 - 2031) | 8.62% CAGR |
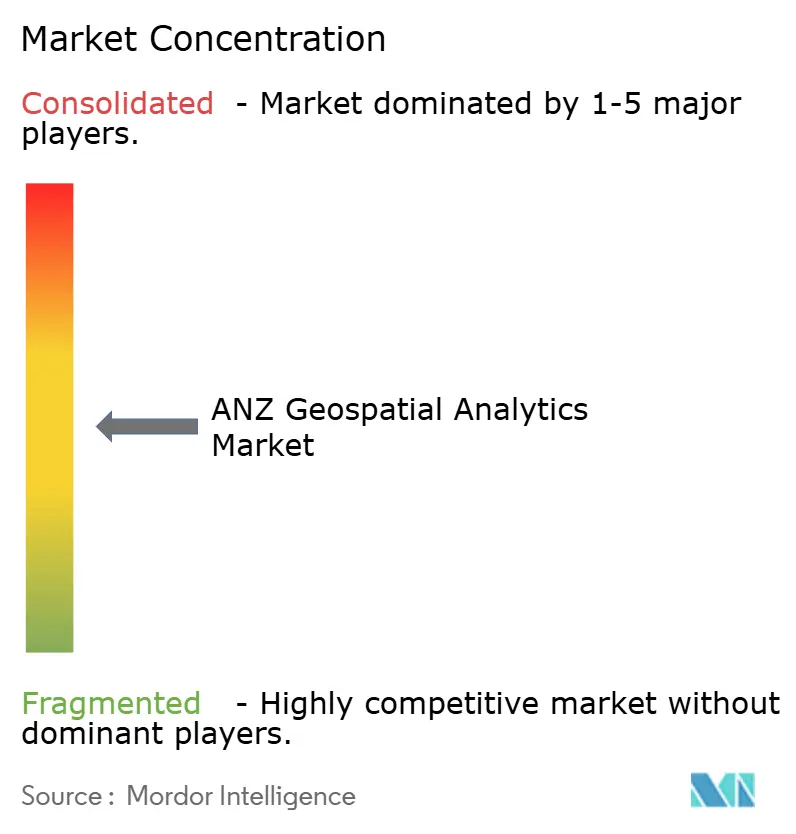
| Market Concentration | Medium |
Major Players *Disclaimer: Major Players sorted in no particular order Image © Mordor Intelligence. Reuse requires attribution under CC BY 4.0. | |
ANZ Geospatial Analytics Market Analysis by Mordor Intelligence
The ANZ Geospatial Analytics Market size is expected to grow from USD 0.74 billion in 2025 to USD 0.8 billion in 2026 and is forecast to reach USD 1.22 billion by 2031 at 8.62% CAGR over 2026-2031.
Escalating smart-city programs, accelerating cloud adoption, and sustained government investment in spatial data infrastructure combine to propel the ANZ geospatial analytics market. The sector benefits from Australia’s targeted USD 689 billion economic impact by 2034, an objective that amplifies spending on digital twins and precision agriculture solutions. Demand also intensifies as mining giants deploy AI-powered digital twins that cut water use and energy consumption, while farmers embrace drone-based field intelligence to improve yields and comply with new reporting mandates. Competitive dynamics remain fluid as global platform leaders scale managed services and local specialists address niche regulatory and indigenous-data needs. Headwinds persist, however, in the form of mounting platform licensing costs and a critical talent shortage that threatens project timelines and solution quality.
Key Report Takeaways
- By end-user vertical, agriculture captured 23.40% of the ANZ geospatial analytics market share in 2025, whereas mining and natural resources is projected to advance at a 13.65% CAGR through 2031.
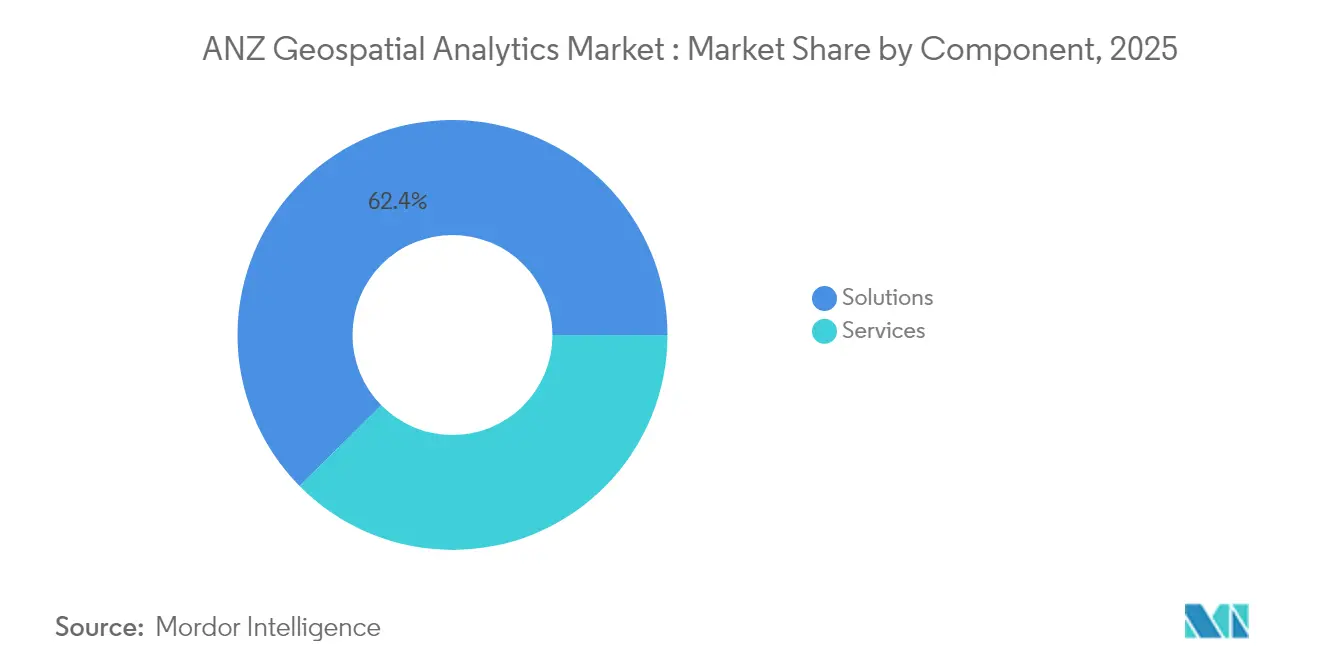
- By component, solutions held 62.40% revenue share in 2025, while services are forecast to record the highest growth at 16.9% CAGR between 2026 and 2031.
- By deployment model, on-premise installations accounted for 47.10% of the ANZ geospatial analytics market size in 2025, yet cloud solutions are expanding at a 21% CAGR to 2031.
- By analytics technique, descriptive analytics commanded 45.00% share of the 2025 base, whereas prescriptive analytics is set to surge at a 23.8% CAGR over the forecast window.
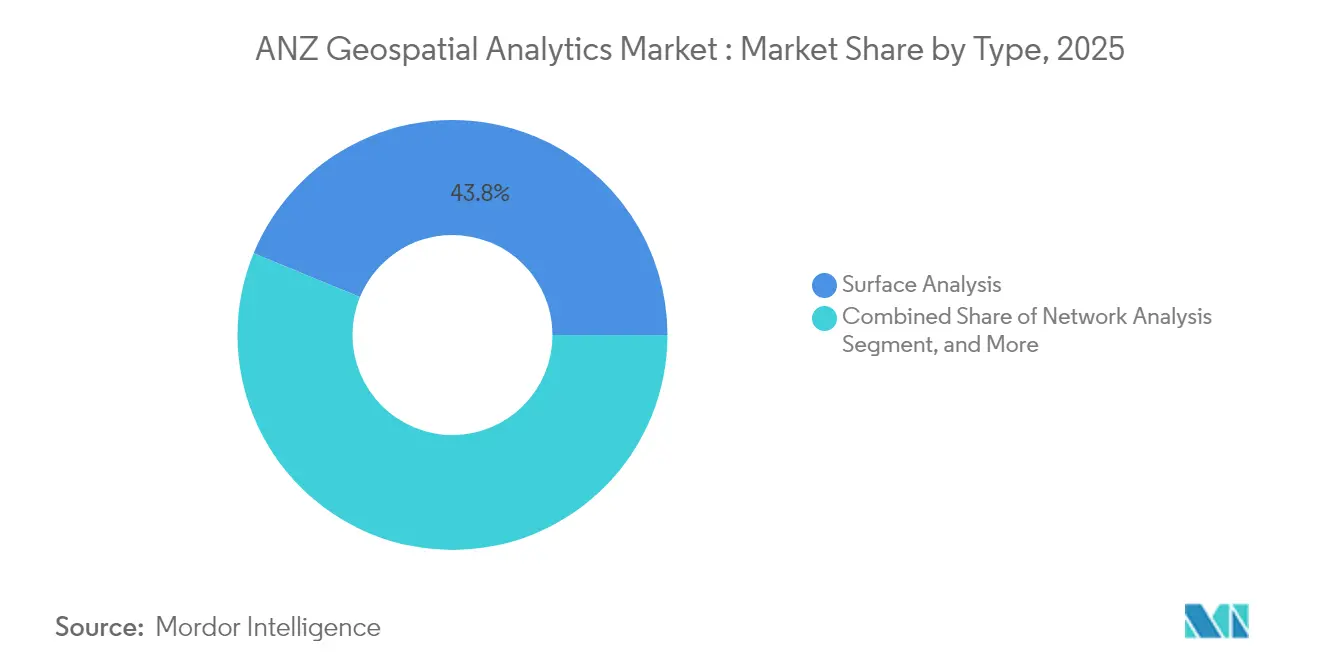
- By type, surface analysis led with 43.80% contribution in 2025, and geovisualization is poised for an 17.6% CAGR through 2031.
- By geography, Australia dominated with roughly 74.60% of 2025 revenue, whereas New Zealand is projected to grow the fastest at 11.35% CAGR through 2031.
Note: Market size and forecast figures in this report are generated using Mordor Intelligence’s proprietary estimation framework, updated with the latest available data and insights as of 2026.
ANZ Geospatial Analytics Market Trends and Insights
Drivers Impact Analysis*
| Driver | (~) % Impact on CAGR Forecast | Geographic Relevance | Impact Timeline |
|---|---|---|---|
| Growing demand from smart-city and digital-twin programs | +2.1% | Australia & New Zealand major cities | Medium term (2-4 years) |
| AI/ML infusion into mainstream GIS workflows | +1.8% | Australia mining and agriculture hubs | Short term (≤ 2 years) |
| Post-COVID infrastructure stimulus | +1.5% | Nationwide | Short term (≤ 2 years) |
| Mandatory spatial-data reporting in mining and agriculture | +1.2% | Predominantly Australia | Medium term (2-4 years) |
| Precision-ag “paddock-level” decision support | +0.9% | Rural ANZ | Long term (≥ 4 years) |
| Carbon-credit verification via Earth-observation data | +0.7% | Region-wide | Long term (≥ 4 years) |
| Source: Mordor Intelligence | |||
AI/ML Infusion Accelerates Mainstream GIS Adoption
Artificial intelligence and machine learning now underpin core GIS workflows across the ANZ geospatial analytics market, reducing manual processing times and enabling real-time decision support. BHP’s digital twins conserve more than 3 gigaliters of water and 118 GWh of energy, highlighting tangible sustainability outcomes[1]BHP, “Artificial Intelligence is unearthing a smarter future,” bhp.com. GeoAI revenue is forecast to quadruple globally between 2024 and 2029, an outlook that encourages platform vendors to embed pre-trained models and no-code AI pipelines. Universities bolster this trend; the University of Sydney’s soil-moisture tool merges satellite imagery with sensor feeds at 80 m² resolution to fine-tune irrigation scheduling. Natural-language GIS copilots are appearing, letting planners pose queries such as “Highlight parcels with flood risk above
Smart-City and Digital-Twin Programs Drive Infrastructure Investment
State-level programs in Victoria and New South Wales allocate more than USD 77 million to create immersive 4D models for transport planning and hazard management. Wellington’s Digital Twin layers traffic counts, air-traffic patterns, and IoT sensor data so officials can visualize the effect of proposed bridges before construction. Private developers also gain; Lendlease reports potential 20% cost savings and 100-fold speed-to-market improvements when digital twins guide scheduling decisions.
Post-COVID Infrastructure Stimulus Fuels Geospatial Capital Expenditure
Australia’s 2025-26 Budget earmarks USD 17.1 billion for road and rail upgrades and USD 1.85 billion to complete fiber rollout, fortifying the backbone for cloud-based spatial tools. Construction firms—96% of which are SMEs—tap the ANZ geospatial analytics market to monitor supply chains, fulfill safety mandates, and verify as-built conditions in real time. New Zealand mirrors the surge with SouthPAN delivering sub-meter GNSS accuracy that unlocks autonomous machinery and precision navigation. Global suppliers respond: HERE and AWS ink a USD 1 billion deal to accelerate AI mapping that supports software-defined vehicles and smart-road projects.
Mandatory Spatial-Data Reporting Transforms Compliance Workflows
Mining codes now require high-frequency drill-hole and blast-movement submissions, prompting firms to automate rock-type classification using machine-learning algorithms that raise ore-recovery rates by up to 5%. Carbon-credit verification adds another layer, with 250,000 soil credits issued in 2023 yet scrutinized for accuracy variance, pushing demand for finer Earth-observation analytics consultancies embed ISO and ESG standards directly into reporting dashboards, giving regulators instant access to auditable datasets. As a result, the ANZ geospatial analytics market gains a recurring compliance revenue stream that buffers cyclic spending in exploration and agriculture.
Restraints Impact Analysis*
| Restraint | (~) % Impact on CAGR Forecast | Geographic Relevance | Impact Timeline |
|---|---|---|---|
| High platform and data licensing costs | -1.4% | Region-wide, hardest on SMEs | Short term (≤ 2 years) |
| Fragmented spatial-data standards between AU and NZ | -0.8% | Cross-border projects | Medium term (2-4 years) |
| Shortfall of geospatial data-science talent | -1.1% | Major metros, specialist hubs | Long term (≥ 4 years) |
| Public backlash over location-privacy breaches | -0.6% | Consumer apps and e-gov services | Medium term (2-4 years) |
| Source: Mordor Intelligence | |||
High Platform and Data Licensing Costs Constrain SME Adoption
Enterprise-grade GIS suites command initial license fees exceeding USD 11,500 plus annual subscriptions above USD 3,800, a hurdle for small contractors and councils [2]Esri, “Data Hosting Service Pricing Changes,” esri.com. Cloud hosting adds variable storage and bandwidth surcharges that make budgeting unpredictable, often stalling proof-of-concept pilots. Competitive responses include Euclideon’s subscription-based 3D data hub that bundles free viewers to lower entry frictio. Yet until price transparency improves, many SMEs postpone full digital-twin rollouts, tempering near-term expansion of the ANZ geospatial analytics market.
Shortfall of Geospatial Data-Science Talent Threatens Growth
Seventy percent of Australian executives cite expertise gaps, and a 1,400-professional shortfall looms for 2025 [3]Esri Australia, “Overcoming Australia’s geospatial skills deficit,” esriaustralia.com.au . AI adoption widens the gulf by introducing roles—GeoAI architect, 3D spatial engineer—that universities have yet to formalize. Parallel demand from the broader AI economy could create 200,000 jobs by 2030, further diluting the geospatial talent pool. Surveying disciplines feel the squeeze as experienced professionals retire faster than graduates enter the field, leading to project backlogs and longer time-to-value across the ANZ geospatial analytics market.
*Our forecasts treat driver/restraint impacts as directional, not additive. The impact forecasts reflect baseline growth, mix effects, and variable interactions.
Segment Analysis
By Component: Solutions Dominance Challenged by Services Growth
Solutions generated the largest slice of the ANZ geospatial analytics market in 2025 at 62.40%, buoyed by entrenched platform investments that underpin day-to-day mapping, asset tracking, and regulatory reporting. Managed services, however, are climbing at 16.9% CAGR because organizations favor predictable OPEX over perpetual licenses and recognize that outsourcing bridges the talent shortfall. Esri Australia’s cloud-hosted managed GIS exemplifies the model, offering SOC2-aligned security plus local help-desk support that frees internal teams from routine patching and scalability chores.
Service vendors now bundle continuous optimization, DevOps pipelines, and training, transforming from project contractors into strategic partners that shepherd digital-twin roadmaps. This dynamic shifts competitive advantage toward firms with multidisciplinary benches data scientists, UX designers, and domain consultants who knit disparate datasets into cohesive decision-support engines. As a result, the ANZ geospatial analytics market sees accelerating migration from solution ownership toward subscription-based ecosystems, a trend reinforced by Trimble’s 75% software revenue mix and USD 2.26 billion in annualized recurring revenue.


By Deployment Model: Cloud Acceleration Challenges On-Premise Dominance
On-premise installations retained 47.10% revenue in 2025 because mining, defense, and utilities prioritize sovereign control over sensitive geodata. Yet the cloud segment’s 21% CAGR underscores growing confidence in hyperscale resilience and cost elasticity. ArcGIS Online’s 99.9% uptime pledge, paired with multicloud portability, appeals to agencies seeking cross-jurisdiction collaboration without building redundant data centers.
Hybrid deployments bridge risk and agility, letting organizations containerize workloads that burst to the cloud for AI training or terabyte-scale rendering while retaining crown-jewel layers on site. Government fiber rollouts and SouthPAN accuracy upgrades further erode latency constraints, making it feasible to stream high-resolution elevation models or live drone feeds over public networks. Consequently, the ANZ geospatial analytics market observes an architectural pivot: cloud-native micro-services handle ingest, analytics, and visualization pipelines, whereas legacy on-prem clusters become staging areas or data-sovereignty vaults.
By Analytics Technique: Prescriptive Analytics Leads Innovation
Descriptive dashboards still anchor 45.00% of 2025 revenues, but prescriptive analytics is rocketing ahead at 23.8% CAGR as stakeholders expect systems to recommend—not just reveal—action. Transportation geotechnics now employs neural-network classifiers that automatically flag slope-stability hazards and propose remediation grading parameters. Predictive models remain vital, powering yield forecasts and pavement lifespan planning; yet prescriptive engines close the loop by ranking interventions based on budget and ESG priorities.
The shift narrows skill-set requirements: analysts no longer need to code complex geoprocessing chains because guided notebooks serve optimized workflows tuned by reinforcement learning. Vendors embed continuous-learning loops that self-adjust blast designs, irrigation schedules, or evacuation routes as sensor feedback arrives. This convergence drives recurring subscriptions and solidifies the ANZ geospatial analytics market as a decision-automation platform rather than a map-making toolbox.
By Type: Surface Analysis Leads While Geovisualization Gains Momentum
Surface analysis captured the lion’s share—43.80%—owing to critical roles in terrain modeling, flood-risk mapping, and mine-site pit optimization. Nationwide LiDAR programs feed ever-denser digital elevation models, improving volumetric calculations and environmental impact assessments, thereby sustaining spend in this mature segment.
Geovisualization, expanding at 17.6% CAGR, is fueled by digital-twin mandates that demand immersive 3D storytelling. Aerometrex’s 3D Adelaide and Esri-Google photorealistic tiles illustrate how city planners, asset owners, and citizens embrace intuitive point-and-click scene manipulation to test zoning proposals or visualize shading impacts. In turn, network analysis and other specialized techniques embed within broader twin platforms to deliver end-to-end situational awareness.
By End-user Vertical: Agriculture Leadership Challenged by Mining Growth
Agriculture remained the top-spending vertical with 23.40% share thanks to widespread adoption of variable-rate seeding, drone spraying, and regulatory soil-data reporting. Crop-yield prediction portals ingest multispectral imagery, IoT-sensor data, and climate models to recommend seed densities, fertilizer mixes, and harvest dates across 1.8 million land parcels.
Mining is the break-out segment, growing at 13.65% CAGR as Rio Tinto and BHP expand autonomous drilling, blast optimization, and environmental compliance dashboards that hinge on high-precision spatial analytics. Government and defense sustain steady allocations to disaster resilience and maritime domain awareness, whereas utilities and telecoms leverage the ANZ geospatial analytics market to streamline asset lifecycle management and 5G rollout.
Geography Analysis
Australia generated roughly three-quarters of total 2025 revenue, a dominance rooted in mature spatial-data frameworks and headline programs such as Digital Twin Victoria and the NSW statewide twin, both of which inject more than USD 77 million into 3D data pipelines. The ANZ geospatial analytics market size attributable to Australia therefore eclipses USD 0.55 billion, underlining how a single-country policy push can accelerate adoption across agriculture, mining, and urban planning portfolios.
New Zealand contributes roughly 25% of 2025 spending yet is on track to post the region’s fastest growth, with 11.35% CAGR driven by the SouthPAN GNSS augmentation and a USD 28.6 million maritime-navigation data upgrade. Wellington’s citywide digital twin showcases how smaller jurisdictions leapfrog legacy constraints, integrating real-time parking data and drone-captured orthomosaics to optimize transport corridors. New legislation—the Customer and Product Data Act 2025—further catalyzes the ANZ geospatial analytics market by mandating open, interoperable geodata interfaces that cut project onboarding times.
Cross-border projects nonetheless face interoperability frictions because cadastral, elevation, and land-use schemas remain misaligned between the two nations. ANZLIC works to harmonize standards, but until formal convergence arrives, integrators expend additional effort to re-project, translate, and validate datasets, marginally lifting the total cost of ownership across the ANZ geospatial analytics market.
Competitive Landscape
The ANZ geospatial analytics industry is moderately fragmented; the top five vendors hold an estimated 45-50% combined revenue, leaving ample headroom for regional specialists. Esri Australia tops the leaderboard with an end-to-end ArcGIS stack that spans desktop, server, SaaS, and managed-service formats, complemented by a landmark agreement with Google Maps Platform for photorealistic 3D tiles that enhance urban-planning workflows. Hexagon, Trimble, and Bentley chase share in mining, surveying, and infrastructure design niches, often pursuing co-innovation alliances—such as Hexagon’s AI blast-movement partnership—that fuse domain know-how with advanced analytics.
Local consultancies such as NGIS and Pointerra differentiate through agile delivery and sector-specific IP, including indigenous-data sovereignty solutions that encrypt culturally sensitive layers while enabling analytics at scale. These firms thrive on government procurement frameworks that reward home-grown capability and on-shore data hosting.
M&A momentum intensifies as global information-services players expand risk-assessment portfolios; Moody’s acquisition of Cape Analytics underscores appetite for AI-based property intelligence, while VIAVI’s purchase of Inertial Labs reflects a pivot toward integrated sensor-analytics stacks. Such moves foreshadow deeper consolidation that will reshape competitive contours of the ANZ geospatial analytics market over the next five years.
ANZ Geospatial Analytics Industry Leaders
NGIS Australia Pty Ltd (NGIS)
Alteryx
Hexagon AB
Esri Australia
Lynker Analytics Ltd
- *Disclaimer: Major Players sorted in no particular order

Recent Industry Developments
- July 2025: Esri announced collaboration with Google Maps Platform to integrate photorealistic 3D tiles into ArcGIS, enabling detailed urban-planning models across 2,500 cities.
- February 2025: NTT DATA, PASCO, and Canon Electronics launched a joint venture to build a high-frequency 3D Earth-observation constellation with first satellite slated for 2027.
- December 2024: VIAVI Solutions acquired Inertial Labs for up to USD 325 million, adding sensor-fusion analytics to its aerospace portfolio.
- December 2024: Ricardo purchased 85% of E3 Advisory for USD 66.5 million to capitalize on Australia’s USD 230 billion infrastructure boom.


ANZ Geospatial Analytics Market Report Scope
Geospatial analytics is the process of acquiring, manipulating, and displaying imagery and data from the geographic information system (GIS), such as satellite photos and global positioning system (GPS) data. The specific identifiers of a street address and a zip code are used in geospatial data analytics. They are used to create geographic models and data visualizations for more accurate trends modeling and forecasting.
The ANZ geospatial analytics market is segmented by type (surface analysis, network analysis, and geovisualization), by end-user vertical ( agriculture, utility and communication, defense and intelligence, government, mining and natural resources, automotive and transportation, healthcare, real estate and construction, and other end-user verticals), and by country (Australia and New Zealand). The market sizes and forecasts are provided in terms of value USD for all the above segments.
| Solutions |
| Services |
| On-premise |
| Cloud |
| Hybrid |
| Descriptive |
| Predictive |
| Prescriptive |
| Surface Analysis |
| Network Analysis |
| Geovisualization |
| Agriculture |
| Utility and Communication |
| Defense and Intelligence |
| Government |
| Mining and Natural Resources |
| Automotive and Transportation |
| Healthcare |
| Real-Estate and Construction |
| Other Verticals |
| Australia |
| New Zealand |
| By Component | Solutions |
| Services | |
| By Deployment Model | On-premise |
| Cloud | |
| Hybrid | |
| By Analytics Technique | Descriptive |
| Predictive | |
| Prescriptive | |
| By Type | Surface Analysis |
| Network Analysis | |
| Geovisualization | |
| By End-user Vertical | Agriculture |
| Utility and Communication | |
| Defense and Intelligence | |
| Government | |
| Mining and Natural Resources | |
| Automotive and Transportation | |
| Healthcare | |
| Real-Estate and Construction | |
| Other Verticals | |
| By Country | Australia |
| New Zealand |


Key Questions Answered in the Report
What is the current value of the ANZ geospatial analytics market?
The ANZ geospatial analytics market size is USD 0.8 billion in 2026.
How fast is spending on cloud-based geospatial solutions growing in ANZ?
Cloud deployment revenue is expanding at a 21% CAGR between 2026 and 2031.
Which vertical invests the most in geospatial analytics across ANZ?
Agriculture leads with 23.40% share of 2025 revenue, thanks to widespread precision-farming adoption.
Why are digital twins important for ANZ infrastructure projects?
State-funded digital-twin programs allow planners to test scenarios virtually, cutting construction costs by up to 20% and accelerating approvals.
Page last updated on:


