Antimony Market Size and Share
Market Overview
| Study Period | 2021 - 2031 |
|---|---|
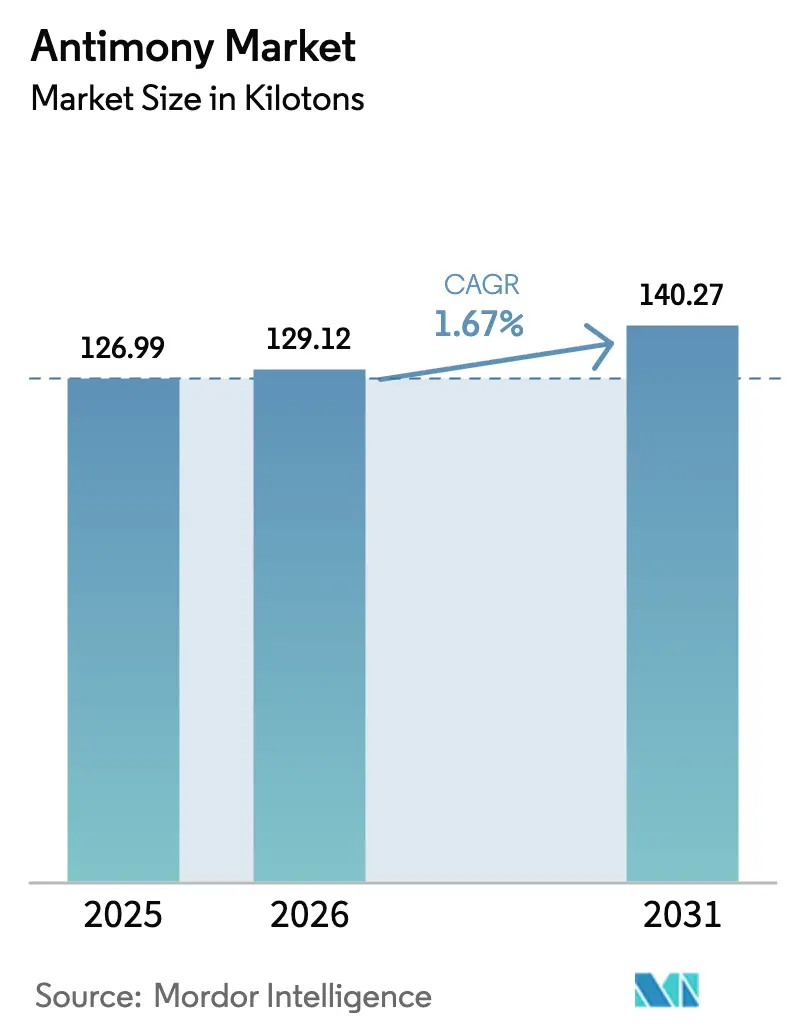
| Market Volume (2026) | 129.12 kilotons |
| Market Volume (2031) | 140.27 kilotons |
| Growth Rate (2026 - 2031) | 1.67% CAGR |
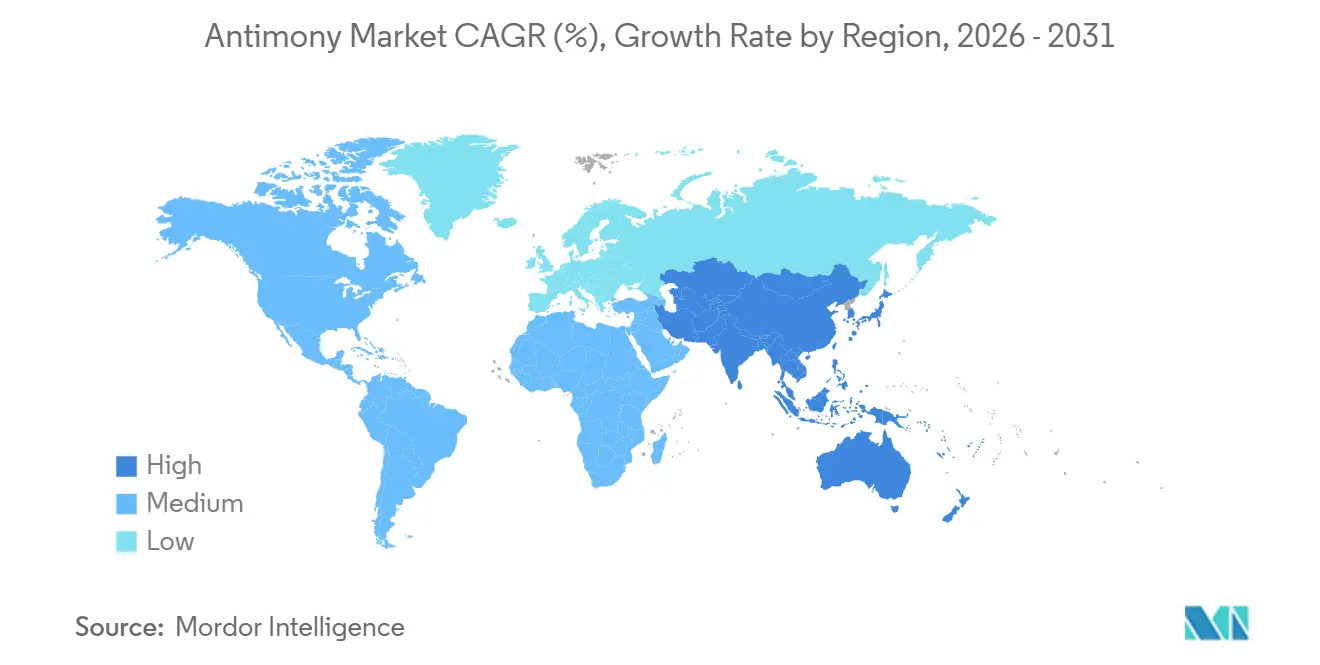
| Fastest Growing Market | Asia Pacific |
| Largest Market | Asia Pacific |
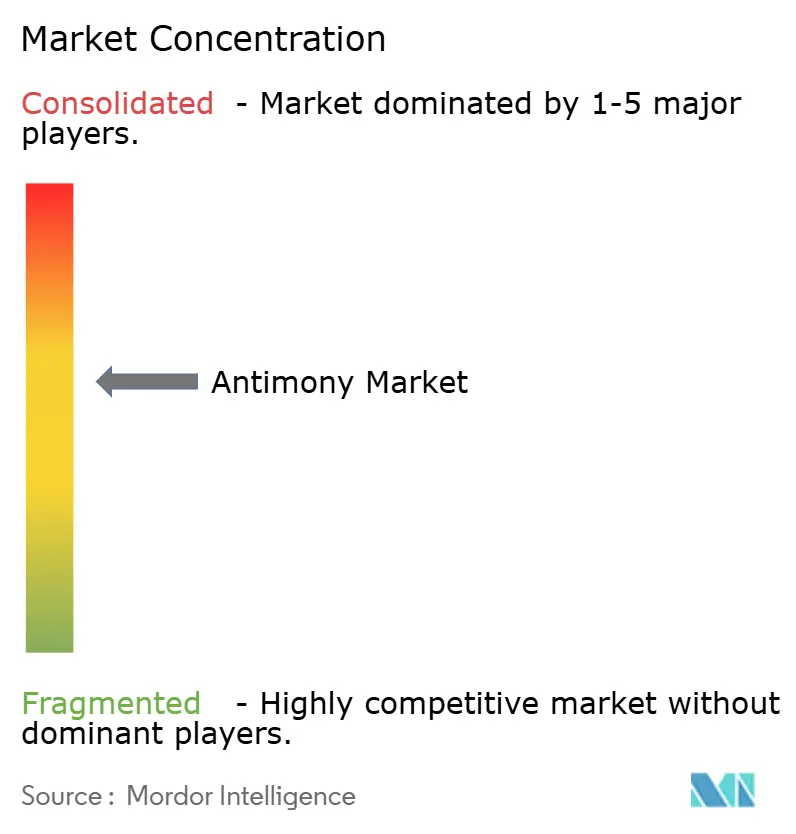
| Market Concentration | Medium |
Major Players *Disclaimer: Major Players sorted in no particular order Image © Mordor Intelligence. Reuse requires attribution under CC BY 4.0. | |
Antimony Market Analysis by Mordor Intelligence
The Antimony Market size was valued at 126.99 kilotons in 2025 and is estimated to grow from 129.12 kilotons in 2026 to reach 140.27 kilotons by 2031, at a CAGR of 1.67% during the forecast period (2026-2031). A rapid price escalation exposed structural reliance on Chinese supply. Strategic demand continues to pivot toward energy storage, semiconductor doping, and defense electronics, where antimony’s metallurgical and electronic properties have few substitutes. Western miners, refiners, and governments are scaling new capacity in Idaho, Montana, and Australia to counter China’s December 2024 export ban, a move that doubled benchmark prices and spurred vertically integrated projects. Meanwhile, regulatory scrutiny over toxicology in Europe and North America is accelerating a gradual shift to halogen-free flame retardants, tempering volume growth but pushing value toward higher purity and specialty grades. Competitive differentiation is shifting away from cost and toward purity, provenance, and security of supply, especially for semiconductor-grade material.
Key Report Takeaways
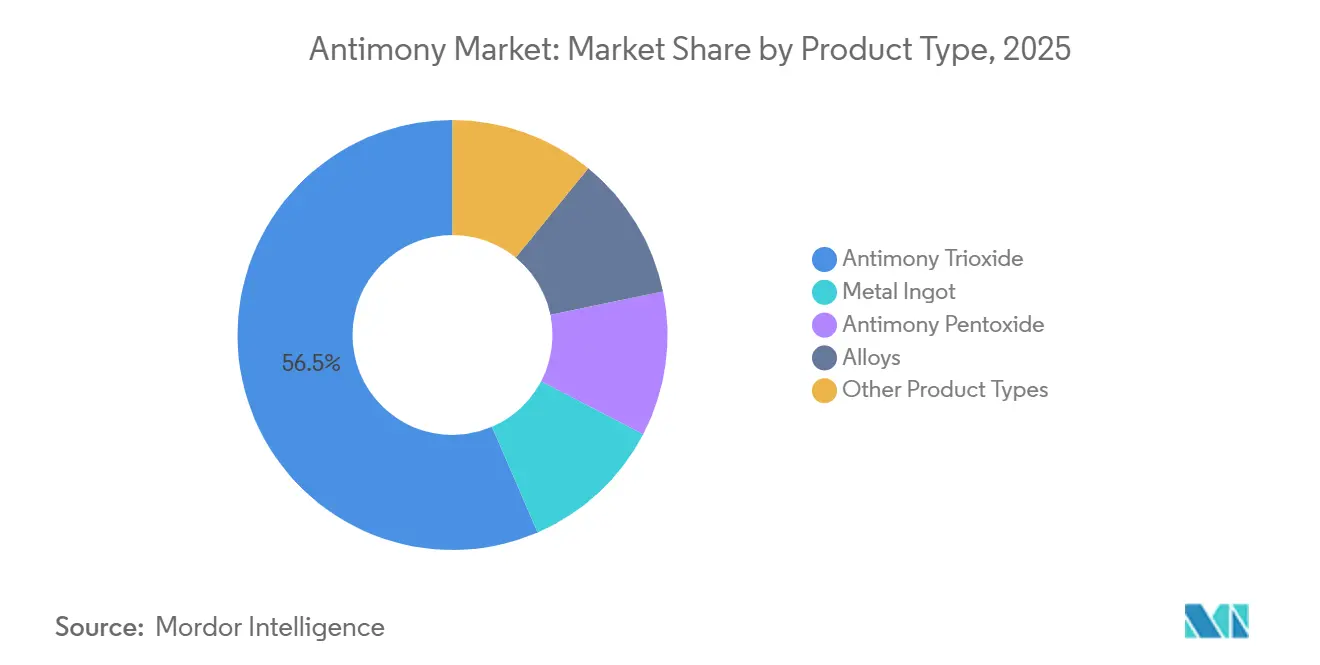
- By product type, antimony trioxide led with 56.48% share in 2025, while antimony pentoxide is projected to grow at a 2.5% CAGR to 2031.
- By application, flame retardants accounted for 55.02% of the Antimony market size in 2025, and ceramics and glass are advancing at a 3.3% CAGR through 2031.
- By ore type, stibnite dominated with a 96.21% share in 2025 and is advancing at a 1.75% CAGR through 2031.
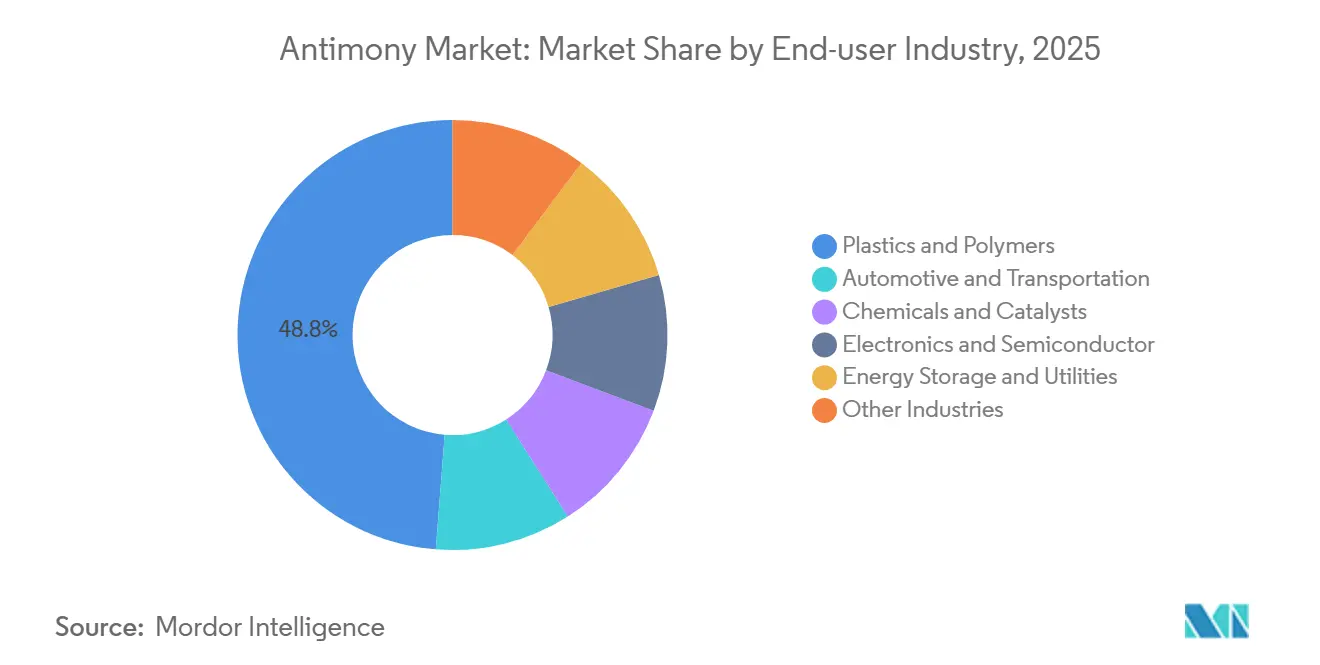
- By end-user industry, plastics and polymers held 48.76% of the Antimony market share in 2025, while energy storage and utilities are projected to post a 3.26% CAGR through 2031.
- By geography, Asia-Pacific captured 86.67% share in 2025 and is expanding at a 3.12% CAGR to 2031.
Note: Market size and forecast figures in this report are generated using Mordor Intelligence’s proprietary estimation framework, updated with the latest available data and insights as of January 2026.
Global Antimony Market Trends and Insights
Drivers Impact Analysis*
| Drivers | (~) % Impact on CAGR Forecast | Geographic Relevance | Impact Timeline |
|---|---|---|---|
| Grid-scale lead-acid and liquid-metal battery expansion in Asia-Pacific | +0.5% | Asia-Pacific core, spillover to North America | Medium term (2-4 years) |
| PET resin boom boosting Sb-catalyst use | +0.3% | Global, concentrated in Asia-Pacific and Middle East | Short term (≤ 2 years) |
| China export controls driving non-China supply-chain investment | +0.4% | North America, Europe, Australia | Medium term (2-4 years) |
| Antimony alloying in next-gen calcium/sodium liquid-metal batteries | +0.2% | North America, Europe | Long term (≥ 4 years) |
| Semiconductor-grade Sb for 5G and quantum devices | +0.1% | Global, led by North America, Asia-Pacific | Long term (≥ 4 years) |
| Source: Mordor Intelligence | |||
Grid-Scale Lead-Acid and Liquid-Metal Battery Expansion in Asia-Pacific
Utility-scale storage is increasingly shaping the Antimony market. In February 2024, Ambri secured Series D financing and is set to deliver liquid-metal batteries, reliant on antimony-lead cathodes, to Xcel Energy and Vistra. While lead-acid batteries continue to dominate telecom backups throughout Southeast Asia, they incorporate antimony in their grid alloys to enhance deep-cycle durability. China's vast fleet of internal-combustion vehicles, even as electrification gains momentum, bolsters baseline demand, anchoring the Antimony market firmly in the automotive sector. Although the rise of calcium-tin alloys might reduce antimony usage in batteries, grid-scale liquid-metal systems counteract this by consuming significant amounts of high-purity antimony per module. This dynamic not only boosts aggregate volumes in the medium term but also enhances the value of supply adhering to stringent purity standards.
PET Resin Boom Boosting Sb-Catalyst Use
Antimony trioxide serves as the primary polymerization catalyst for over 90% of polyethylene terephthalate (PET) production. New PET facilities in Saudi Arabia and Vietnam are set to begin operations before 2027. Teijin's recent patent on ternary catalyst mixtures underscores the industry's push to reduce residual antimony while maintaining kinetic benefits. However, regulators are keeping a close watch. The European Chemicals Agency is currently reevaluating the permissible migration limits for food-contact packaging. This scrutiny introduces compliance costs, potentially steering the industry towards titanium-based systems for premium products. While low capital expenditure and established expertise currently uphold antimony's dominance as a catalyst, downstream producers are actively exploring alternatives to mitigate regulatory risks. This cautious approach tempers the growth outlook for the antimony market beyond the immediate two-year horizon.
China Export Controls Driving Non-China Supply-Chain Investment
In August 2024, Beijing introduced a licensing regime, followed by a ban on U.S. exports in December 2024. These moves led to a dramatic quadrupling of prices in Rotterdam within just ten months. The upheaval spurred a surge of investments in North America and Australia. In January 2025, Perpetua Resources clinched a Defense Production Act agreement and a Final Record of Decision for its Stibnite project. The United States Antimony Corporation resumed smelting operations in Mexico and kicked off mining activities in Montana in 2025. Meanwhile, Korea Zinc sought national core-technology status, a move that curtails foreign ownership and solidifies state backing for its diaphragm-electrolysis process. While these initiatives contribute relatively modest physical capacity, their geopolitical weight far overshadows this output, reshaping procurement strategies across defense, semiconductor, and energy-storage sectors.
Antimony Alloying in Next-Gen Calcium/Sodium Liquid-Metal Batteries
Calcium-antimony and sodium-antimony batteries, targeting a lifespan of 20 years and costs below USD 100 per kWh, are positioning antimony to transition from mere commodity status to that of a strategic energy material. While Ambri's immediate deployments will only tap into a modest tonnage, ongoing negotiations for a pipeline could see demand surge significantly in the coming years. Perpetua is channeling volumes from Stibnite directly into Ambri's cathodes, crafting a vertically integrated supply chain that sidesteps Chinese dominance. Although the technology grapples with thermal-management expenses, a shift in policy incentives favoring long-duration storage could propel the Antimony market into a demand surge reminiscent of the 1980s flame-retardant boom.
Restraints Impact Analysis*
| Restraints | (~) % Impact on CAGR Forecast | Geographic Relevance | Impact Timeline |
|---|---|---|---|
| Volatile Chinese export quotas and price spikes | -0.3% | Global, acute in North America and Europe | Short term (≤ 2 years) |
| Shift toward halogen-free flame retardants in EU and NA | -0.2% | Europe, North America | Medium term (2-4 years) |
| REACH/TSCA toxicology compliance costs | -0.2% | Europe, North America, spillover to Asia-Pacific | Medium term (2-4 years) |
| Source: Mordor Intelligence | |||
Volatile Chinese Export Quotas and Price Spikes
Benchmark Rotterdam prices surged significantly from December 2023 to February 2025. This sharp rise has squeezed margins for compounders and battery makers, who find it challenging to pass on these costs. In Europe and North America, small and mid-sized processors are feeling the brunt of this cash-flow strain, with some even pausing production until prices stabilize. Korea Zinc's annual supply remains limited, accounting for a small fraction of the global mined output. This limited supply leaves Western buyers vulnerable to policy shifts in Beijing. As projects like Stibnite gear up, the ongoing volatility is projected to impact the forecasted CAGR.
Shift Toward Halogen-Free Flame Retardants in EU and NA
Regulatory bodies on both sides of the Atlantic are tightening rules on halogenated systems synergized with antimony trioxide. The European Chemicals Agency’s ongoing review could restrict antimony-containing formulations in consumer electronics and textiles[1]European Chemicals Agency, “Strategy on flame retardants,” echa.europa.eu . U.S. TSCA evaluations encourage pre-emptive reformulation, especially in children’s products. While antimony trioxide enjoys a strong cost advantage—halogen-free systems need double or triple loadings to match performance—the compliance burden and brand-image risk are accelerating substitution. The Antimony market will thus see slower growth in North America and Europe, even as Asia-Pacific demand rises.
*Our forecasts treat driver/restraint impacts as directional, not additive. The impact forecasts reflect baseline growth, mix effects, and variable interactions.
Segment Analysis
By Product Type: Trioxide Dominance Faces Pentoxide Specialty Gains
Antimony trioxide held 56.48% of the 2025 volume, reflecting its entrenched roles in PET catalysis and flame retardancy. However, its growth trajectory faces constraints due to Europe's shift towards halogen-free alternatives. Antimony pentoxide is expanding at a 2.5% CAGR as specialty glass and photovoltaic manufacturers seek its superior decolorizing and fining capabilities. Metal ingots, boasting a premium purity from Korea Zinc, cater to the high-purity demands of the military and semiconductor sectors. While lead-acid battery alloys are seeing reduced antimony loadings due to the rise of calcium-tin formulations, grid-scale batteries are helping to offset this decline. Additionally, niche products like antimony trisulfide, favored in pyrotechnics, command high margins but contribute negligible tonnage, highlighting the diverse dynamics within the antimony market.
While pentoxide's ascent bolsters specialty revenues, trioxide's dominance remains unchallenged outside Europe and North America. Teijin's advancements in ternary catalysts could extend trioxide's reign in the PET sector by curbing migration without compromising kinetics. Even a slight success in this endeavor could insulate a significant portion of global antimony demand from imminent substitutions. Thus, the antimony market is characterized by a volume-heavy, regulation-sensitive trioxide foundation, complemented by the rapid growth of pentoxide and a niche high-purity ingot segment that drives significant profits.


By Application: Flame Retardants Lead, Ceramics Accelerate
Flame retardants consumed 55.02% of the 2025 volume, but that dominance is losing momentum in the West. Ceramics and glass are growing at a 3.3% CAGR thanks to photovoltaic glass fining and antimony-doped monocrystalline silicon. Catalyst demand in PET polymerization remains substantial but is sensitive to regulatory pressure. Specialty electronic uses, measured in kilograms, carry high margins and strategic significance. This application mix indicates a transition toward fewer but higher value streams, creating a cushion for aggregate revenues even if flame-retardant tonnage erodes in mature economies.
Ceramic demand provides a hedge against regulatory headwinds, particularly as solar-glass producers secure antimony pentoxide to improve clarity and bubble removal. Batteries offer another hedge: although per-unit antimony intensity is falling in automotive starters, grid-scale projects require kilogram-level loadings per module. Therefore, the Antimony market maintains diversified demand drivers that temper downside risk from any single application class.
By Ore Type: Stibnite Monopoly Reflects Geological Scarcity
Stibnite contributed 96.21% of raw material feedstock in 2025. The segment grows at a 1.75% CAGR as no alternative primary ore matches its antimony content. By 2031, Perpetua’s Idaho project is set to introduce additional supply, slightly diversifying the origin within the same ore family. While secondary production from lead-zinc smelting contributes a small share to the supply, it boasts higher purity and lower environmental costs. This makes it an appealing option for integrated refiners, such as Korea Zinc. However, depletion at China's Xikuangshan and policy instabilities in Myanmar highlight a significant geological bottleneck. Although recycling end-of-life batteries could bolster supply, the current pyrometallurgical flowsheet's tendency to lose tin to slag limits the usability of the recovered antimony. Without significant advancements in hydrometallurgy, the antimony market remains closely tied to stibnite geology.
By End-User Industry: Plastics Dominate, Energy Storage Surges
Plastics captured 48.76% of end-use in 2025, anchored in flame-retardant formulations for wire harnesses and appliance housings. The segment’s forward growth is modest as EU and U.S. regulations encourage halogen-free alternatives. Energy storage and utilities were the fastest-growing at a 3.26% CAGR. Ambri’s pipeline and resilient telecom backup demand underscore this sector’s upside potential. Automotive and transportation sectors utilized lead-acid batteries and bearing alloys. Chemicals and catalysts are at risk of substitution. While the semiconductor and defense sectors consumed minimal quantities, they significantly influenced price premiums for 5N-purity material. Consequently, the Antimony market is divided between high-volume plastics, which grapple with regulatory challenges, and the rapidly expanding energy storage sector, presenting a strategic advantage.
Geography Analysis
Asia-Pacific held 86.67% of global volume in 2025 and is expanding at a 3.12% CAGR. In 2024, China refined antimony but operated at only one-third of its installed capacity, grappling with ore scarcity and compliance costs. Rising demand in India's plastics and two-wheeler sectors, coupled with Vietnam's PET surge, solidifies Asia-Pacific's central role in the Antimony market. Despite domestic refining, Japan remains a net importer, predominantly sourcing from China and Vietnam[2]USGS National Minerals Information Center, “Japan—2020–2021,” pubs.usgs.gov. Meanwhile, South Korea's Korea Zinc increased its output and plans a modest rise, with a portion of the production targeted for Western markets.
North America is gearing up for a supply expansion. Projects like Perpetua’s Stibnite and operations by United States Antimony in Mexico and Montana are poised to meet a significant portion of domestic needs in the coming years. This demand is driven by sectors like defense electronics, grid-scale storage, and semiconductor fabs, especially with the reshoring push under the CHIPS and Science Act. While Europe relies heavily on imports, tightening regulations on flame retardants are prompting processors like Belgium’s Campine to pivot towards recycling. In the Middle East-Africa/South America region, Bolivia and Morocco are key players in diversifying the supply, but their combined output offers only limited relief.
Despite Western diversification efforts, the Asia-Pacific market share is expected to decline slightly in the coming years, as Chinese smelters continue to benefit from economies of scale in refining. Yet, driven by political motivations for resilient supply chains, a larger portion of the Antimony market volumes is anticipated to flow through non-Chinese channels, even if the absolute tonnage doesn't keep pace with regional demand growth.

Competitive Landscape
The antimony market is moderately consolidated. Technology differentiation is sharpening. Korea Zinc’s diaphragm-electrolysis delivers 5N purity metal suitable for quantum devices and radar systems, fetching prices multiples above flame-retardant grades. Recycling specialists are experimenting with hydrometallurgical flowsheets to recover antimony from spent lead-acid batteries without losing tin, a development that could unlock secondary supply and lessen exposure to Chinese concentrates. Price volatility has compressed margins for downstream compounders, forcing producers to compete on security and purity rather than cost.
Antimony Industry Leaders
Xikuangshan Shanxing Antimony Industry Co., Ltd.
Hunan Province Anhua Huayu Antimony Industry Co., Ltd.
Hunan Gold Co., Ltd.
Campine NV
United States Antimony Corporation
- *Disclaimer: Major Players sorted in no particular order

Recent Industry Developments
- April 2025: Mandalay Resources and Alkane Resources have announced a merger that will create a stronger mining company focused on gold and antimony. With Mandalay already producing antimony at its Costerfield mine, the deal gives the combined company more financial strength and resources to expand production.
- November 2024: United States Antimony Corporation has expanded its mining presence in Alaska by acquiring 24 additional claims covering 3,840 acres near Stibnite Creek. This acquisition increases the company's total claims in Alaska to 93, spanning 14,880 acres, primarily associated with antimony and other critical minerals.


Research Methodology Framework and Report Scope
Market Definitions and Key Coverage
Our study defines the antimony market as the worldwide production and trade of primary-refined metal together with immediately saleable derivatives, chiefly antimony trioxide, pentoxide, master alloys, and ingots, consumed in flame-retardants, lead-acid batteries, catalysts, ceramics, electronics, and allied industries. Volume is tracked from mine output through refinery gate to the first point of commercial sale, which gives Mordor analysts an auditable chain of custody.
Scope Exclusions: finished downstream goods such as complete batteries, PET resin, or plastic parts that merely contain antimony are left outside the baseline.
Segmentation Overview
- By Product Type
- Metal Ingot
- Antimony Trioxide
- Antimony Pentoxide
- Alloys
- Other Product Types (Granules, Single Crystals, etc.)
- By Ore type
- Stibnite
- Others
- By Application
- Flame Retardants
- Batteries
- Ceramics and Glass
- Catalyst
- Other Applications (Semiconductor, Defense, etc.)
- By End-user Industry
- Plastics and Polymers
- Automotive and Transportation
- Chemicals and Catalysts
- Electronics and Semiconductor
- Energy Storage and Utilities
- Other Industries
- By Geography
- Asia-Pacifc
- China
- India
- Japan
- South Korea
- ASEAN Countries
- Rest of Asia-Pacific
- North America
- United States
- Canada
- Mexico
- Europe
- Germany
- United Kingdom
- France
- Italy
- Spain
- Rest of Europe
- South America
- Brazil
- Argentina
- Chile
- Rest of South America
- Middle-East and Africa
- Saudi Arabia
- United Arab Emirates
- South Africa
- Rest of Middle-East and Africa
- Asia-Pacifc
Detailed Research Methodology and Data Validation
Primary Research
Mordor analysts next conduct structured interviews with smelter operators, battery alloy formulators, commodity traders, and regional safety-regulation experts across Asia-Pacific, Europe, and North America. These conversations validate yield assumptions, price spreads, and substitution trends that secondary data alone cannot reveal, allowing us to close information gaps before final modeling.
Desk Research
We start by mining authoritative public sources such as the United States Geological Survey, UN Comtrade shipment codes, China Non-Ferrous Metals Industry Association releases, European Chemicals Agency notifications, and peer-reviewed journals covering flame-retardant chemistry. Company filings, investor decks, and reputable press are screened to size refinery capacities and follow policy shocks like China's September 2024 quota curb. Paid assets including D&B Hoovers and Dow Jones Factiva help us cross-check ownership, utilization, and trade flows. A great many other references support the background work, even though they are not listed here.
Market-Sizing & Forecasting
A single top-down production and trade reconstruction converts reported mine output, concentrate grades, refinery recovery, and net exports into an annual consumption pool, which is then cross-checked through selective bottom-up roll-ups of sampled smelter capacity and average selling price. Key variables like Chinese export quotas, lead-acid battery manufacturing runs, flame-retardant penetration in building codes, recycling rates, and antimony metal price dispersion feed the base year. Forecasts through 2030 rely on multivariate regression blended with scenario analysis so volume growth aligns with construction activity, automotive battery demand, and regulatory phase-outs of halogenated systems.
Data Validation & Update Cycle
Outputs pass three layers of analyst review, variance tests against independent indicators, and re-contact of sources when anomalies exceed preset thresholds. We refresh every twelve months and issue interim updates after material policy or supply-chain shocks; a final sense check is performed just before client delivery.
Why Mordor's Antimony Baseline Commands Reliability
Published estimates often clash because firms pick different functional scopes, pricing anchors, and refresh cadences. Recognizing this, we tie our baseline to traceable volume metrics and adjust for quota shocks and secondary supply that others overlook.
Key gap drivers include: 1) some studies translate metal flows to revenue using one flat average selling price, 2) others report only flame-retardant demand, and 3) refresh cycles that miss 2024-25 policy swings.
Benchmark comparison
| Market Size | Anonymized source | Primary gap driver |
|---|---|---|
| 98.15 kt (2025) | Mordor Intelligence | |
| USD 2.31 B (2024) | Global Consultancy A | Uses uniform ASPs; does not reconcile Chinese quota volatility or recycled supply volumes |
| USD 1.08 B (2024) | Industry Journal B | Focuses on flame-retardant application only, omitting battery and catalyst demand captured by us |
These comparisons show that when scope, variables, and cadence differ, numbers scatter widely. By grounding every step in transparent volume accounting and routinely updated field intelligence, Mordor Intelligence delivers a dependable starting point for strategic decisions.


Key Questions Answered in the Report
What is the forecast Antimony market CAGR from 2026 to 2031?
The Antimony market is projected to expand at a 1.67% CAGR over the 2026-2031 period.
How great will global demand be by 2031?
Volume is expected to reach 140.27 kilotons, up from 129.12 kilotons in 2026.
Which region controls the majority of supply and demand?
Asia-Pacific accounts for 86.67% of global volume thanks to China’s dominant refining capacity.
What product type leads consumption today?
Antimony trioxide dominates with a 56.48% share of the 2025 volume, mainly for PET catalysts and flame retardants.
Which end-user segment is growing fastest?
Energy storage and utilities are advancing at a 3.26% CAGR, driven by liquid-metal and lead-acid battery deployments.
Page last updated on:


