
Anticoagulants Market Size and Share
Market Overview
| Study Period | 2020 - 2031 |
|---|---|
| Market Size (2026) | USD 37.56 Billion |
| Market Size (2031) | USD 51.13 Billion |
| Growth Rate (2026 - 2031) | 6.36 % |
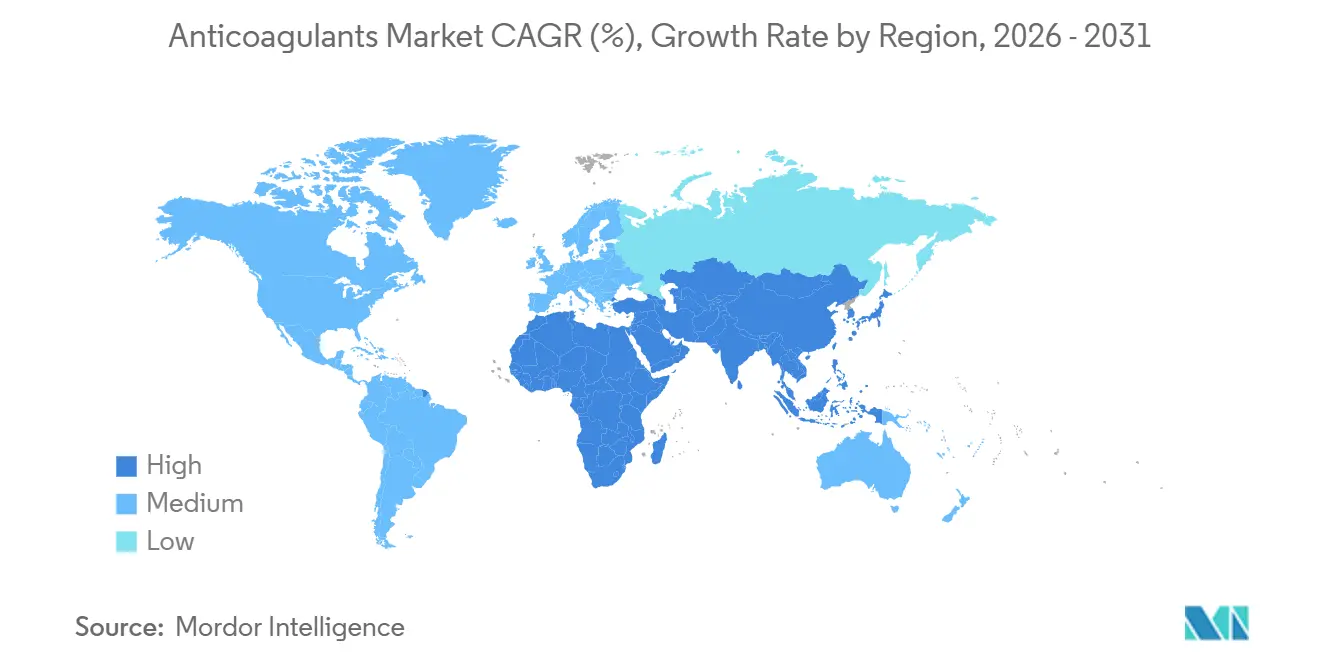
| Fastest Growing Market | Asia Pacific |
| Largest Market | North America |
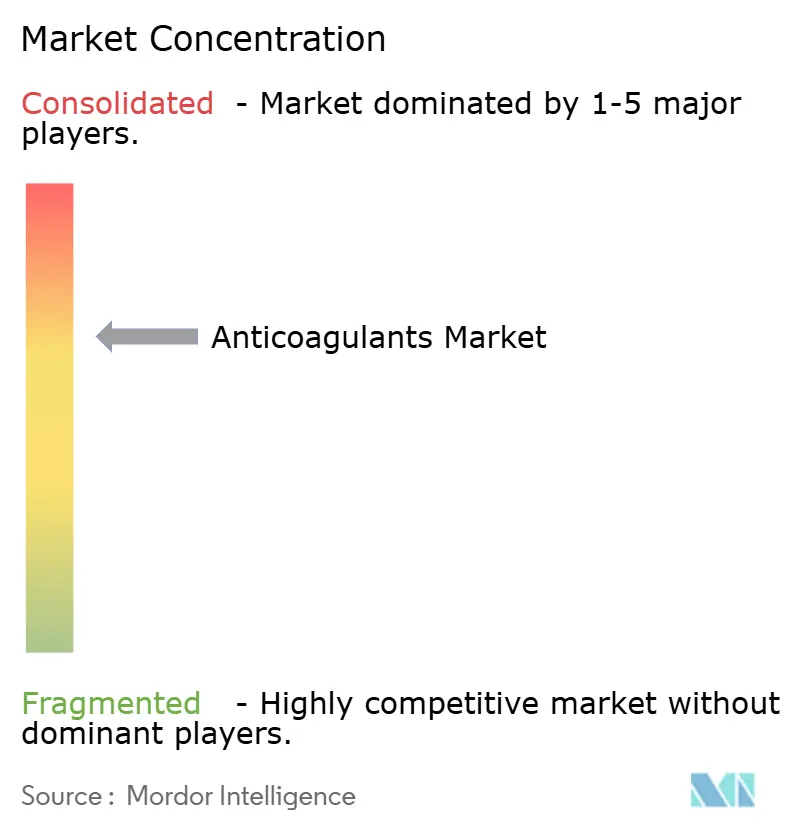
| Market Concentration | Medium |
Major Players *Disclaimer: Major Players sorted in no particular order Image © Mordor Intelligence. Reuse requires attribution under CC BY 4.0. | |
Anticoagulants Market Analysis by Mordor Intelligence
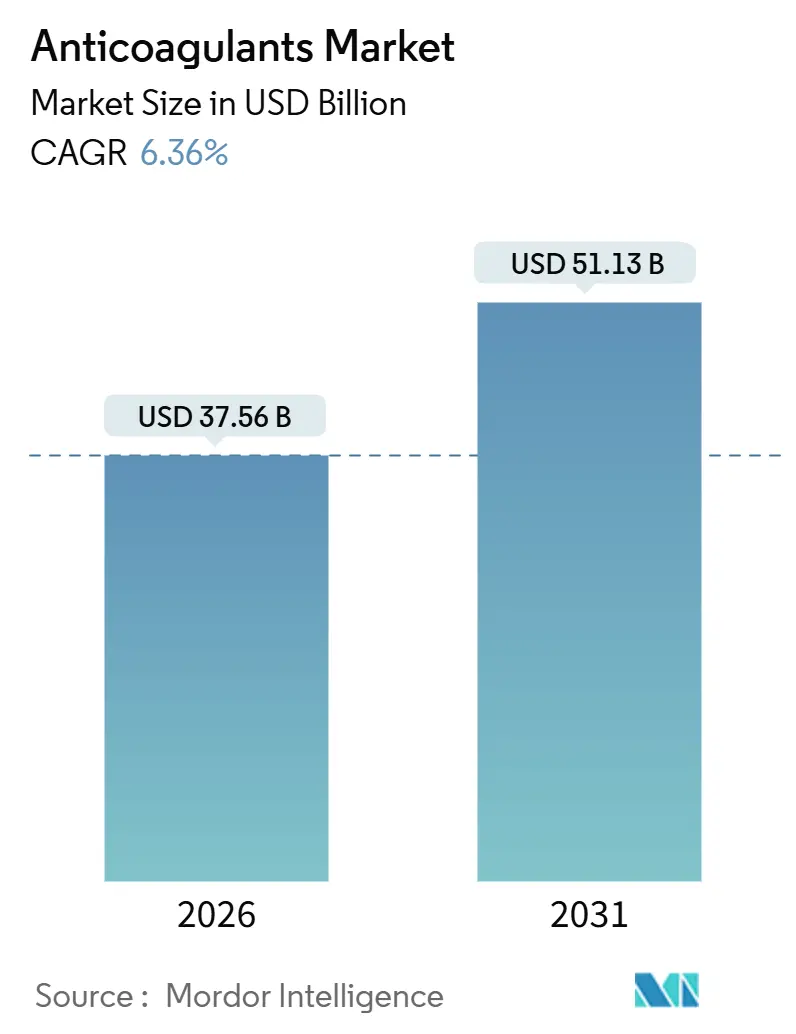
The Anticoagulants Market size is estimated at USD 37.56 billion in 2026, and is expected to reach USD 51.13 billion by 2031, at a CAGR of 6.36% during the forecast period (2026-2031).
Rising cardiovascular disease prevalence, rapid uptake of novel oral anticoagulants, and expanded post-acute thromboprophylaxis protocols are steering demand. Payers now favor oral regimens that avoid laboratory monitoring, while oncology guidelines treat cancer-associated thrombosis as a core disease modifier rather than a complication. Competitive activity remains intense as generic apixaban and rivaroxaban compress margins, prompting originator sponsors to differentiate through adherence programs and outcome-based contracts. Momentum is further reinforced by regulatory fast-tracks that shorten evidence timelines for pipeline agents targeting safer coagulation pathways.
Key Report Takeaways
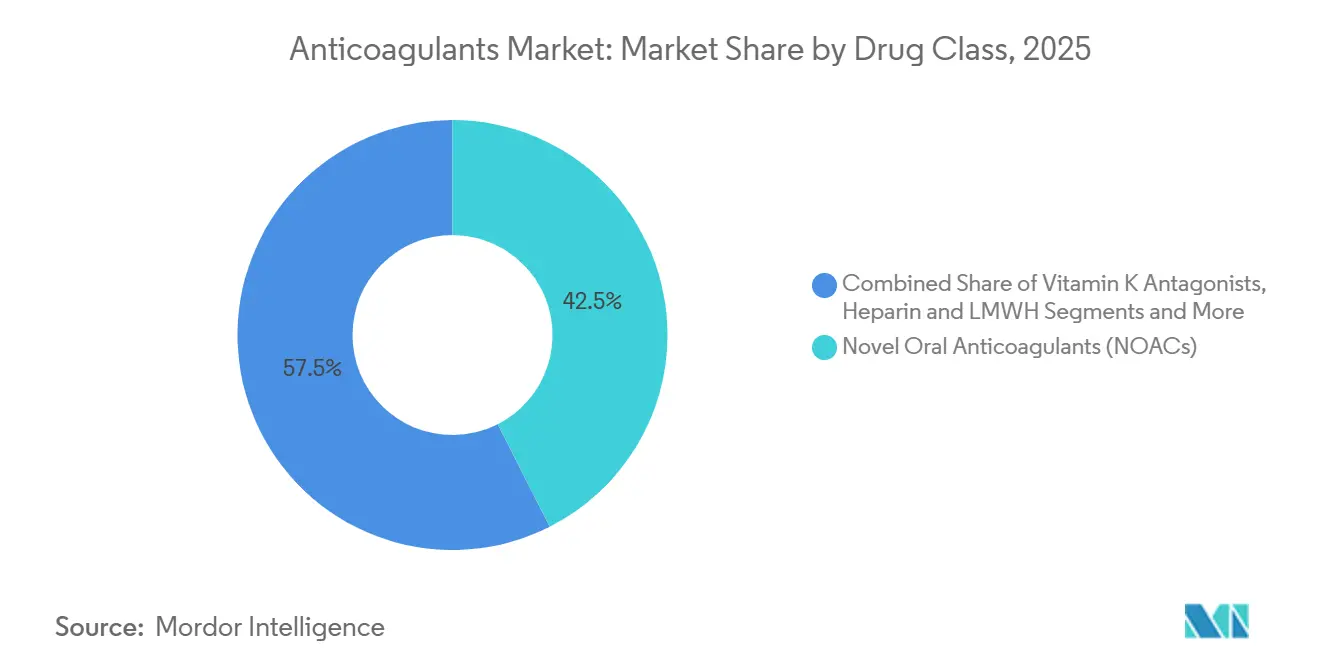
- By drug class, Novel Oral Anticoagulants commanded 42.53% of anticoagulants market share in 2025, while Factor XIa inhibitors post the highest growth at an 8.33% CAGR through 2031.
- By route of administration, oral formulations held 59.37% of revenue in 2025, yet implantable and long-acting systems are advancing at a 9.67% CAGR.
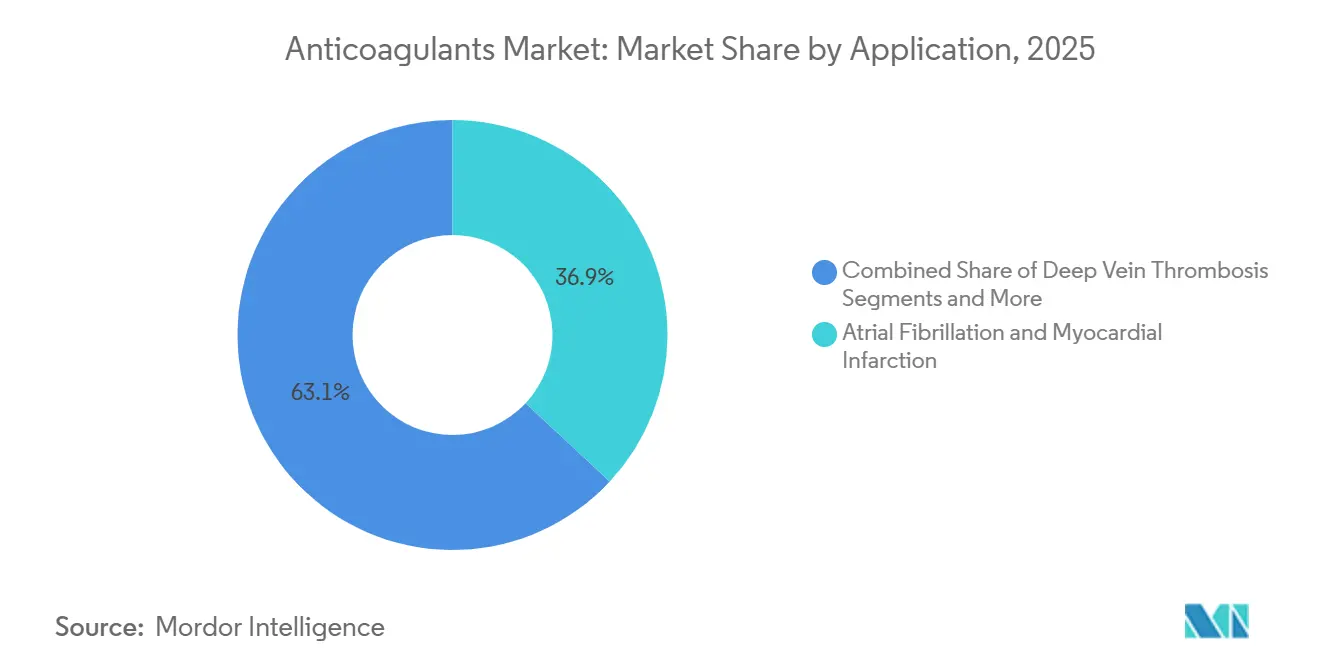
- By application, atrial fibrillation and myocardial infarction represented 36.93% of revenue in 2025; cancer-associated thrombosis is forecast to expand at a 9.22% CAGR to 2031.
- By distribution channel, hospital pharmacies captured 53.67% share in 2025, whereas online pharmacies are growing fastest at a 10.46% CAGR.
- By geography, North America led with 32.65% of the anticoagulants market size in 2025; Asia-Pacific is projected to grow at an 8.37% CAGR through 2031.
Note: Market size and forecast figures in this report are generated using Mordor Intelligence’s proprietary estimation framework, updated with the latest available data and insights as of January 2026.
Market Trends and Insights
Drivers Impact Analysis of Anticoagulants Market*
| Driver | (~) % Impact on CAGR Forecast | Geographic Relevance | Impact Timeline |
|---|---|---|---|
| Growing prevalence of cardiovascular diseases & atrial fibrillation | +1.2% | Global, highest in North America, Europe, urban Asia-Pacific | Long term (≥ 4 years) |
| Rapid adoption of NOACs over warfarin | +1.5% | North America, Europe, Japan; emerging China & India | Medium term (2-4 years) |
| Rising geriatric population globally | +0.9% | Global, concentrated in Japan, Germany, Italy, coastal China | Long term (≥ 4 years) |
| Favorable clinical guidelines for VTE prophylaxis | +0.8% | North America, Europe, Australia; gradual Latin America & MEA | Medium term (2-4 years) |
| AI-driven personalized anticoagulation dosing tools | +0.6% | North America, select EU, pilot Singapore | Short term (≤ 2 years) |
| Extended outpatient thromboprophylaxis post-COVID-19 | +0.7% | Global, fastest in North America & Western Europe | Short term (≤ 2 years) |
| Source: Mordor Intelligence | |||
Growing Prevalence of Cardiovascular Diseases & Atrial Fibrillation
Global atrial fibrillation cases reached 59.7 million in 2024 and continue to climb as populations age and metabolic syndrome spreads in middle-income nations. Updated 2024 European guidelines lowered oral anticoagulation thresholds, enlarging the eligible pool by about 15%.[1]European Society of Cardiology, “2024 ESC Guidelines for the Management of Atrial Fibrillation,” European Society of Cardiology, escardio.org U.S. stroke data show AF-related events carry 30-day mortality above 25%, steering payers toward preventive therapy.[2]Centers for Disease Control and Prevention, “Atrial Fibrillation Fact Sheet,” Centers for Disease Control and Prevention, cdc.gov Added pressure comes from rising heart failure with preserved ejection fraction, a condition that typically coexists with AF. Growing use of wearables with AF detection algorithms further boosts diagnosis rates. Together, these factors sustain long-term demand that outlasts the current forecast window.
Rapid Adoption of NOACs Over Warfarin
Direct oral agents account for more than 70% of new U.S. prescriptions as of 2025, driven by reduced monitoring burdens and superior safety profile.[3]American Heart Association, “Effectiveness and Safety of Oral Anticoagulants in Patients With Atrial Fibrillation and Frailty,” American Heart Association Journals, ahajournals.org Combined global sales of apixaban, rivaroxaban, edoxaban, and dabigatran exceeded USD 15 billion in 2024, even before widespread generic entry. Scientific bodies report roughly 50% lower intracranial hemorrhage rates versus warfarin, reinforcing clinician confidence. Warfarin use is now largely limited to mechanical heart valves, severe renal impairment, or antiphospholipid syndrome. Imminent generic launches are expected to drive price parity in cost-sensitive regions, accelerating the switch.
Favorable Clinical Guidelines for VTE Prophylaxis
The American Society of Hematology doubled recommended therapy duration for provoked deep vein thrombosis in its 2024 update. International experts endorsed extended prophylaxis for medically ill patients after discharge, citing a 40% relative reduction in recurrent VTE events without excess bleeding. Regulators now accept real-world evidence for label expansions in orthopedic surgery, expanding acute and extended indications. Together, these policy shifts lengthen treatment duration and widen eligible patient cohorts, amplifying volume growth.
AI-Driven Personalized Anticoagulation Dosing Tools
FDA-cleared software integrates genetic markers and clinical variables to personalize warfarin dosing, cutting time outside therapeutic range by 20%. Academic centers using AI-guided care report a 15% drop in emergency visits for anticoagulation-related bleeding. Pilot programs extend algorithmic support to NOAC dose adjustment around elective procedures. Broader rollout depends on reimbursement codes and interoperability standards now under discussion at Medicare and European counterparts.
Restraints Impact Analysis of Anticoagulants Market*
| Restraint | (~) % Impact on CAGR Forecast | Geographic Relevance | Impact Timeline |
|---|---|---|---|
| Patent expiries & generic erosion of key NOACs | -1.1% | North America, Europe; delayed in Japan & emerging markets | Medium term (2-4 years) |
| Bleeding-risk concerns limiting adoption | -0.7% | Global; heightened in Asia-Pacific due to lower body weight | Long term (≥ 4 years) |
| Porcine-heparin supply-chain vulnerability | -0.5% | Global; acute in North America & Europe reliant on Chinese API | Short term (≤ 2 years) |
| Regulatory uncertainty for RNAi / gene-silencing agents | -0.4% | North America, Europe | Medium term (2-4 years) |
| Source: Mordor Intelligence | |||
Patent Expiries & Generic Erosion of Key NOACs
Apixaban lost exclusivity in several EU states in 2024, trimming branded revenue by about 30% within 12 months. Rivaroxaban experienced similar pressure as generics gained a 25% volume foothold, leading to a 12% revenue drop for Bayer in Europe. U.S. patent cliffs in 2026 will extend these pricing pressures. Manufacturers respond by investing in patient-support apps and real-world evidence to defend brand value. While margins shrink, lower prices broaden access in lower-income markets, moderating the negative impact on overall growth.
Bleeding-Risk Concerns Limiting Adoption
Registry data show major bleeding rates of 2–3% per patient-year for NOACs. In 2024, the FDA added a boxed warning to dabigatran for older patients with renal impairment, prompting hospital systems to embed prescribing hard stops. Limited access to reversal agents such as idarucizumab and andexanet alfa, the latter costing more than USD 50,000 per dose, curbs use in frail populations. Wider availability of affordable reversal therapies will be needed to unlock full penetration of high-risk subgroups.
*Our forecasts treat driver/restraint impacts as directional, not additive. The impact forecasts reflect baseline growth, mix effects, and variable interactions.
Anticoagulants Market Segment Analysis
By Drug Class:
Factor XIa Inhibitors Lead Innovation WaveFactor XIa inhibitors are poised for an 8.33% CAGR between 2026 and 2031, the fastest among classes, as drug makers seek to uncouple efficacy from bleeding risk. Bayer’s asundexian did not meet the primary endpoint for non-inferiority versus apixaban in 2024, yet mechanistic validation kept competitors engaged. Bristol-Myers Squibb and Janssen push milvexian through late-stage trials, and Anthos Therapeutics’ monthly abelacimab continues to show encouraging safety. Novel Oral Anticoagulants retained 42.53% of 2025 revenue, but rising volumes will not fully offset erosion from generic entry. Meanwhile, heparins remain acute-care staples, and vitamin K antagonists settle into niche roles. This bifurcation yields a price-competitive high-volume NOAC segment and a premium high-growth Factor XIa segment set to redefine therapeutic ceilings.
Second-generation biologics such as antisense oligonucleotides target infrequent dosing, offering potential differentiation once safety is established. However, regulatory clarity on long-term gene-silencing is still evolving. The anticoagulants market overall must balance established blockbuster categories with emergent therapies likely to command premium pricing if they deliver superior safety.



By Route of Administration:
Implantable Systems Target Adherence GapsOral agents captured 59.37% of 2025 revenue due to patient preference and fixed dosing convenience. Yet, implantable and long-acting delivery solutions are expanding at a 9.67% CAGR as companies pursue depot technologies that alleviate daily pill fatigue. The FDA cleared a 7-day extended-release subcutaneous Factor Xa formulation in 2024 for post-surgical prophylaxis, reducing nursing burden and early discharge risks.
Research into biodegradable microspheres and biomarker-responsive ports aims to tackle the 30% discontinuation rate observed within the first year of oral therapy. Regulatory pathways for combination drug-device products remain complex, requiring parallel submissions to different FDA centers, which slows commercialization. Despite these hurdles, innovators view implantables as strategic hedges in a landscape where traditional tablets face generic commoditization.
By Application:
Cancer-Associated Thrombosis Emerges as Growth EngineAtrial fibrillation and myocardial infarction together held 36.93% of 2025 revenue, but growth is slowing as penetration saturates developed markets. Cancer-associated thrombosis, by contrast, is forecast to grow at a 9.22% CAGR, propelled by 2024 oncology guidelines that endorse NOACs as first-line therapy for most patients. Real-world CANVAS registry data reinforce comparable efficacy and lower non-major bleeding versus enoxaparin in cancer cohorts.
Standard prophylaxis in orthopedic and trauma populations continues to underpin steady VTE demand, while mechanical heart valve indications remain small yet stable. Shifting application mix toward oncology favors oral agents with minimal drug-drug interaction and dosing schedules aligned to chemotherapy cycles, supporting long-term momentum for the anticoagulants market.
By Distribution Channel:
Online Pharmacies Capitalize on DigitizationHospital pharmacies accounted for 53.67% of revenue in 2025, reflecting entrenched inpatient use of heparins and initial NOAC dispensing. Online pharmacies, however, are registering the highest growth at a 10.46% CAGR as regulators in the United States, EU, and parts of Asia-Pacific grant digital dispensing licenses. Updated 2024 Digital Pharmacy Accreditation standards included anticoagulation counseling, catalyzing payer acceptance.
Retail outlets remain integral for refills yet face attrition as mail-order platforms offer synchronized refills and lower co-pays. Specialty anticoagulation clinics continue to manage high-risk patients requiring frequent adjustments. Overall, distribution is fragmenting by patient acuity, with online channels increasingly favored for stable, tech-savvy users.
Geography Analysis
North America Anticoagulants Market
North America generated 32.65% of 2025 revenue, anchored by broad NOAC coverage under Medicare Part D and private value-based contracts tied to adherence metrics. Canada’s 2024 formulary expansion boosted volumes, while Mexico negotiated bulk deals with generic makers to reach cost parity with warfarin. Growth will gradually moderate as penetration nears saturation, yet profitability remains highest due to favorable pricing dynamics.
Europe Anticoagulants Market
Europe followed, with Germany, the United Kingdom, France, Italy, and Spain accounting for more than 60% of regional revenue. EU approval of generic apixaban and rivaroxaban in 2024 drove price cuts of 40-50% in substitution-mandated markets. The U.K. designated NOACs as first-line therapy, prompting an 18% prescription increase despite cheaper generics. Geopolitical tensions disrupted supply in Eastern Europe, forcing reliance on local warfarin and heparin production.
APAC Anticoagulants Market
Asia-Pacific is the fastest-growing region, set for an 8.37% CAGR, driven by broad reimbursement wins. China added edoxaban to the national reimbursement list in 2025, slashing patient out-of-pocket costs by 70%. Japan granted priority review to a reduced-dose apixaban formulation tailored to body-weight profiles, addressing previous bleeding concerns. India’s generic launches at 60% lower price points are unlocking demand in tier-2 and tier-3 cities. Australia’s expanded subsidies lifted prescription volumes 22% in early 2025.
MEA and South America Anticoagulants Market
The Middle East & Africa and South America remain nascent, constrained by affordability and regulatory fragmentation. Pilot reimbursement programs in Gulf Cooperation Council states and Brazil indicate early but promising expansion opportunities beyond 2031. Collectively, these diverse trajectories reinforce a global anticoagulants market that balances mature high-value regions with rapidly scaling emerging economies.

Regulatory Landscape
Regulatory oversight for anticoagulants is intensifying across approvals, post-market surveillance, and prescribing safety controls. In Europe, regulators continued to widen access to generic DOACs through centralized and national procedures, including EMA marketing authorization for generic rivaroxaban (Rivaroxaban Koanaa) in 2025 and Ireland’s HPRA authorization for a generic rivaroxaban product (Rivaroxaban Ascend) in August 2025, reinforcing substitution-driven competition across multiple markets.
Pharmacovigilance requirements also tightened in the EU, with Implementing Regulation (EU) 2025/1466 ending the EudraVigilance pilot and updating signal-detection expectations for marketing authorization holders, followed by 2026 PRAC activity and ongoing product-information updates via CHMP. In the United Kingdom, anticoagulants are managed as high-risk medicines, and NHS decision aids and local prescribing specifications increasingly codify risk scoring (for example, CHA2DS2-VASc and HAS-BLED/ORBIT) prior to DOAC initiation, shaping real-world use through governance and audit frameworks rather than label language alone.
Value Chain Analysis
The anticoagulants value chain spans discovery and clinical development, API and intermediate sourcing, finished-dose manufacturing (oral solids, injectables, and combination drug-device formats), quality and release testing, and multi-channel distribution (hospital, retail, specialty clinics, and online pharmacies). NOACs concentrate value in formulation, brand services, and market access, while heparins and LMWHs add upstream exposure to biologic raw materials and specialized purification, which increases sensitivity to supply disruption and quality variability.
Risk management increasingly centers on supply continuity, compliance, and channel execution. FDA monitoring of drug shortages, alongside broader government attention to supply-chain resilience, reinforces the need for diversified API and CMO footprints and tighter inventory planning for high-acuity injectables. On the innovation side, partnerships that connect drug sponsors to device ecosystems are becoming more visible in defined subpopulations, illustrated by Cadrenal Therapeutics’ 2025 collaboration with Abbott to support the TECH-LVAD pivotal trial of tecarfarin in HeartMate 3 LVAD patients, linking clinical evidence generation with established implant and hospital pathways.
Competitive Landscape
The top five companies, in terms of global 2025 revenue, include Pfizer-Bristol-Myers Squibb, Bayer, Boehringer Ingelheim, Daiichi Sankyo, and Johnson & Johnson, signaling moderate concentration. Generic incursions following patent cliffs are dispersing share, prompting incumbents to pivot toward ecosystem plays such as adherence apps and pharmacogenetic services. Bayer’s 2024 patent filing for a rivaroxaban-Factor XIa fixed-dose combination highlights industry efforts to extend lifecycles through polypharmacy innovation.
Emerging disruptors include antisense and monoclonal antibody developers that promise once-monthly or quarterly dosing. Ionis Pharmaceuticals’ fesomersen achieved favorable Phase II results with no bleeding signal, positioning the agent for preventive cardiovascular therapy in high-risk cohorts. Machine-learning tools that personalize dosing and predict bleeding risk are quickly becoming differentiators as payers scrutinize real-world outcomes. The anticoagulants industry therefore transitions from an oligopoly dominated by patent-protected blockbusters to a tiered ecosystem where generics, branded NOACs, and next-generation biologics coexist.
Future competition will likely hinge on demonstrating superior safety in vulnerable populations, integrating digital adherence solutions, and expanding into under-served indications such as pediatric VTE, peripheral artery disease, and left ventricular thrombus. Companies mastering both clinical and digital value propositions stand to secure enduring advantage in the expanding anticoagulants market.
Anticoagulants Industry Leaders
Johnson & Johnson
Boehringer Ingelheim GmbH
Bristol-Myers Squibb Company
Daiichi Sankyo Company
Sanofi
- *Disclaimer: Major Players sorted in no particular order
Anticoagulants Market Companies Covered in this Report
- Alexion Pharmaceuticals Inc.
- Anthos Therapeutics
- Aspen Pharma Holdings Ltd.
- Astellas Pharma
- Bayer
- Boehringer Ingelheim
- Bristol-Myers Squibb
- Daiichi Sankyo Co. Ltd.
- Dr. Reddy’s Laboratories
- Roche
- Ionis Pharmaceuticals
- Johnson & Johnson
- Leo Pharma
- Merck
- Mitsubishi Tanabe Pharma
- Nektar Therapeutics
- Novartis
- Pfizer
- Sanofi

Market Opportunities and Future Outlook
Clinical whitespace is most visible where bleeding risk, adherence, and complex comorbidity constrain current DOAC use. Factor XIa programs are a focal point for differentiation on safety, supported by Bayer’s disclosure of OCEANIC-STROKE Phase III results in February 2026, showing a 26% reduction in ischemic stroke with no increase in ISTH major bleeding versus placebo, and by subsequent FDA Priority Review in May 2026 for asundexian in secondary stroke prevention. Together, these milestones keep attention on next-generation mechanisms that expand treatable cohorts beyond conventional AF and VTE pathways.
Access and supply-chain shifts create parallel opportunities in generics and essential injectables. Regulatory authorizations for generic rivaroxaban across major markets (including FDA approval of first generic rivaroxaban tablets in 2025 and EMA/HPRA actions in 2025) are accelerating price transparency and channel competition, while manufacturers respond with new affordability routes and differentiated services. On the parenteral side, capacity investments that secure heparin inputs are becoming more strategic, exemplified by Laboratorios Farmaceuticos ROVI completing its Escuzar plant expansion in Spain in 2024, including a sodium heparin production facility authorized for commercial activity, supporting more localized sourcing for heparin-derived supply chains.
Recent Industry Developments in Anticoagulants Market
- April 2026: Bristol-Myers Squibb and Pfizer announced an arrangement with the Mark Cuban Cost Plus Drug Company to make Eliquis (apixaban) available via CostPlusDrugs.com starting April 27, 2026. The arrangement adds a direct-to-patient cash-pay access route alongside traditional pharmacy benefit channels. It increases price transparency and intensifies competitive pressure as generic erosion expands across the DOAC class.
- November 2025: Regeneron reported positive Phase 2 data for two Factor XI antibodies in knee-replacement patients, targeting clot prevention without clinically relevant bleeding. The readout supports continued investment in non-traditional coagulation targets aimed at decoupling efficacy from bleeding liability. It also raises the bar for differentiation versus established oral Factor Xa agents as pipelines advance.
- July 2024: Laboratorios Farmaceuticos ROVI completed its new Escuzar plant expansion in Spain, including a sodium heparin production facility authorized for commercial activity. This strengthens upstream control for heparin-based anticoagulant supply and reduces dependence on external sourcing for a critical input. Expanded manufacturing capabilities also support more consistent hospital supply for acute-care anticoagulation protocols.


Anticoagulants Market Report Scope and Research Methodology
Market Definition and Coverage
For this report, the anticoagulants market is defined as the global revenue earned from prescription therapies used to prevent or treat blood clots in routine clinical care, across hospital and outpatient settings.
Scope exclusions: This sizing excludes antiplatelet drugs, thrombolytics, and non-therapeutic laboratory or diagnostic consumables that are not sold as anticoagulant therapies.
Segments Covered in This Report
- By Drug Class
- Novel Oral Anticoagulants (NOACs)
- Heparin & Low-Molecular-Weight Heparin (LMWH)
- Vitamin K Antagonists
- Factor XIa Inhibitors
- Parenteral Direct Thrombin Inhibitors
- By Route of Administration
- Oral Anticoagulants
- Injectable Anticoagulants
- Implantable / Long-acting Delivery Systems
- By Application
- Atrial Fibrillation & Myocardial Infarction
- Deep Vein Thrombosis
- Pulmonary Embolism
- Cancer-Associated Thrombosis
- Mechanical Heart Valves & Other Cardiac Uses
- By Distribution Channel
- Hospital Pharmacies
- Retail Pharmacies
- Online Pharmacies
- Specialty Clinics
- By Geography
- North America
- United States
- Canada
- Mexico
- Europe
- Germany
- United Kingdom
- France
- Italy
- Spain
- Rest of Europe
- Asia-Pacific
- China
- Japan
- India
- South Korea
- Australia
- Rest of Asia-Pacific
- Middle East & Africa
- GCC
- South Africa
- Rest of Middle East & Africa
- South America
- Brazil
- Argentina
- Rest of South America
- North America
Data Sources, Market Sizing, and Validation
Desk Research
Desk research was used to frame the demand pool and to set realistic boundaries around usage and pricing, before assumptions were stress-tested through interviews. We leaned on public health and utilization signals, such as disease burden tables and care pathway notes, to understand where anticoagulant use is structurally high and where it is still under-penetrated.
Sources included public datasets and references such as the World Health Organization, the US CDC, the US FDA drug labeling database, OECD health statistics, and peer-reviewed journals on atrial fibrillation and venous thromboembolism treatment patterns. We also reviewed annual reports and investor materials, association websites, and reputable press for changes in prescribing, patent timing, and major safety or guideline updates. Where needed, a paid subscription focused on company financials and a patent database was used to cross-check product lifecycle signals, and an import and export shipment-level database was used selectively to sanity-check supply flow in markets that rely on external manufacturing. The examples above are not exhaustive, and many other sources were also referenced for collection, validation, and clarification.
Primary Interviews and Surveys
Primary work focused on confirming what drives real-world volume and net pricing, since list prices alone can mislead in a heavily rebated prescription category. We spoke with manufacturers, distributors, hospital and retail pharmacy stakeholders, and clinicians to validate class-level adoption shifts, switching behavior, and how tendering or reimbursement rules affect realized value across regions. Feedback was then used to close gaps from public sources and to triangulate the final model outputs before locking assumptions.
Distribution of primary research fieldwork respondents
| Company type | Respondent position | Region |
|---|---|---|
| Top tier: 26% | CXOs: 14% | APAC: 45% |
| Mid tier: 59% | Functional/Unit leaders: 42% | EMEA: 34% |
| Smaller Players: 15% | Managers: 44% | Americas: 21% |
Market-Sizing & Forecasting
Sizing started with a top-down build that reconstructs treated patient demand by major clot-related indications and maps it to typical therapy duration and class-level prescribing splits. Those volumes were then converted to value using a practical net price logic, where public price points are adjusted with interview-led views on rebates, channel mix, and the speed of generic erosion after key patent events.
To keep the totals grounded, we also ran selective bottom-up approximations, such as sampling a set of leading products by geography and checking implied sales against company disclosures and channel checks, then adjusting the totals where the two views did not align. Inputs that matter most in this market included prevalence of atrial fibrillation and venous thromboembolism, anticoagulant penetration within eligible cohorts, duration of therapy in acute versus chronic use, mix shift toward direct oral anticoagulants versus older classes, and net price changes tied to reimbursement and tendering.
Forecasting relied mainly on scenario analysis, since policy shifts, generic entry timing, and class switching can move the curve more than pure time-series trends. Scenarios were anchored by consensus expectations gathered in interviews, and then reconciled with observable signals like guideline changes, safety updates, and regional access expansion. Where country detail was thin, assumptions were bridged using comparable markets with similar access rules and then re-checked with regional experts.
Data Validation & Update Cycle
Validation was done through multiple checks so that one noisy input does not steer the outcome. We compared modeled totals against independent signals such as prescription mix direction, major product revenue bands, and indication-level treatment volumes, and then reviewed outliers before sign-off.
If large variances appeared, the team re-contacted sources to confirm whether the driver was a true market shift, for example a tender reset or a safety-driven switch, or simply a timing mismatch in pricing and currency conversion. Reports are refreshed annually, with interim updates when material events occur, and a final pre-delivery pass is completed so clients receive the latest updated view.
Mordor Intelligence's Anticoagulants Market Size Versus Other Published Estimates
Published numbers for anticoagulants do not always match because firms pick different year anchors, different currency conversion timing, and different ways to handle net price erosion after generics and tender resets. In a drug class where rebates and channel mix matter, small differences in net price logic can also change the total.
When our model is refreshed, exchange rates and price progression assumptions are re-checked against the most recent company commentary and regional reimbursement signals, and that refresh-led discipline is a key reason the 2026 baseline from Mordor Intelligence can land away from estimates anchored to earlier base years or list-price leaning ASPs.
Benchmark comparison
| Source | Market Size | Gaps in Research Methodology |
|---|---|---|
| Mordor Intelligence | USD 37.56 B (2026) | |
| Global Consultancy A | USD 37.35 B (2025) | Uses a 2025 base year and a longer forecast window, which can reflect a different currency timing and an earlier stage of mix shift and generic impact when compared with a 2026 anchoring. |
| Regional Consultancy B | USD 30.70 B (2021) | Anchored to 2021, which can understate the market if later-year adoption of newer oral agents and post-2021 net price changes are not fully rolled forward with consistent rebate and tender adjustments. |
The spread in the table is mostly explained by base-year selection and how net pricing is treated over time, rather than by disagreement that demand is growing. By tying value to treated demand signals and then re-validating pricing and currency assumptions at refresh, the final number stays traceable to inputs that can be checked and repeated.


Key Questions Answered in the Report
How large is the anticoagulants market in 2026?
The anticoagulants market size stands at USD 37.56 billion in 2026.
What is the forecast CAGR for anticoagulant sales through 2031?
What is the forecast CAGR for the anticoagulants market through 2031?
Which drug class is growing fastest?
Factor XIa inhibitors are forecast to expand at an 8.33% CAGR between 2026 and 2031.
Why are online pharmacies gaining share?
Digital dispensing licenses and lower co-pays are pushing chronic patients toward online platforms, driving a 10.46% CAGR.
Which region will contribute most to future growth?
Asia-Pacific is projected to grow at an 8.37% CAGR due to reimbursement expansions in China, Japan, and India.
How will generic entry affect branded NOAC revenue?
Patent expiries for apixaban and rivaroxaban will compress margins but broaden access, tempering overall market growth without reversing it.
Page last updated on:


 Your data is secure and never sold or shared.


