
Antibody Production Market Size and Share
Market Overview
| Study Period | 2020 - 2031 |
|---|---|
| Market Size (2026) | USD 21.46 Billion |
| Market Size (2031) | USD 37.73 Billion |
| Growth Rate (2026 - 2031) | 11.93 % |
| Fastest Growing Market | Asia-Pacific |
| Largest Market | North America |
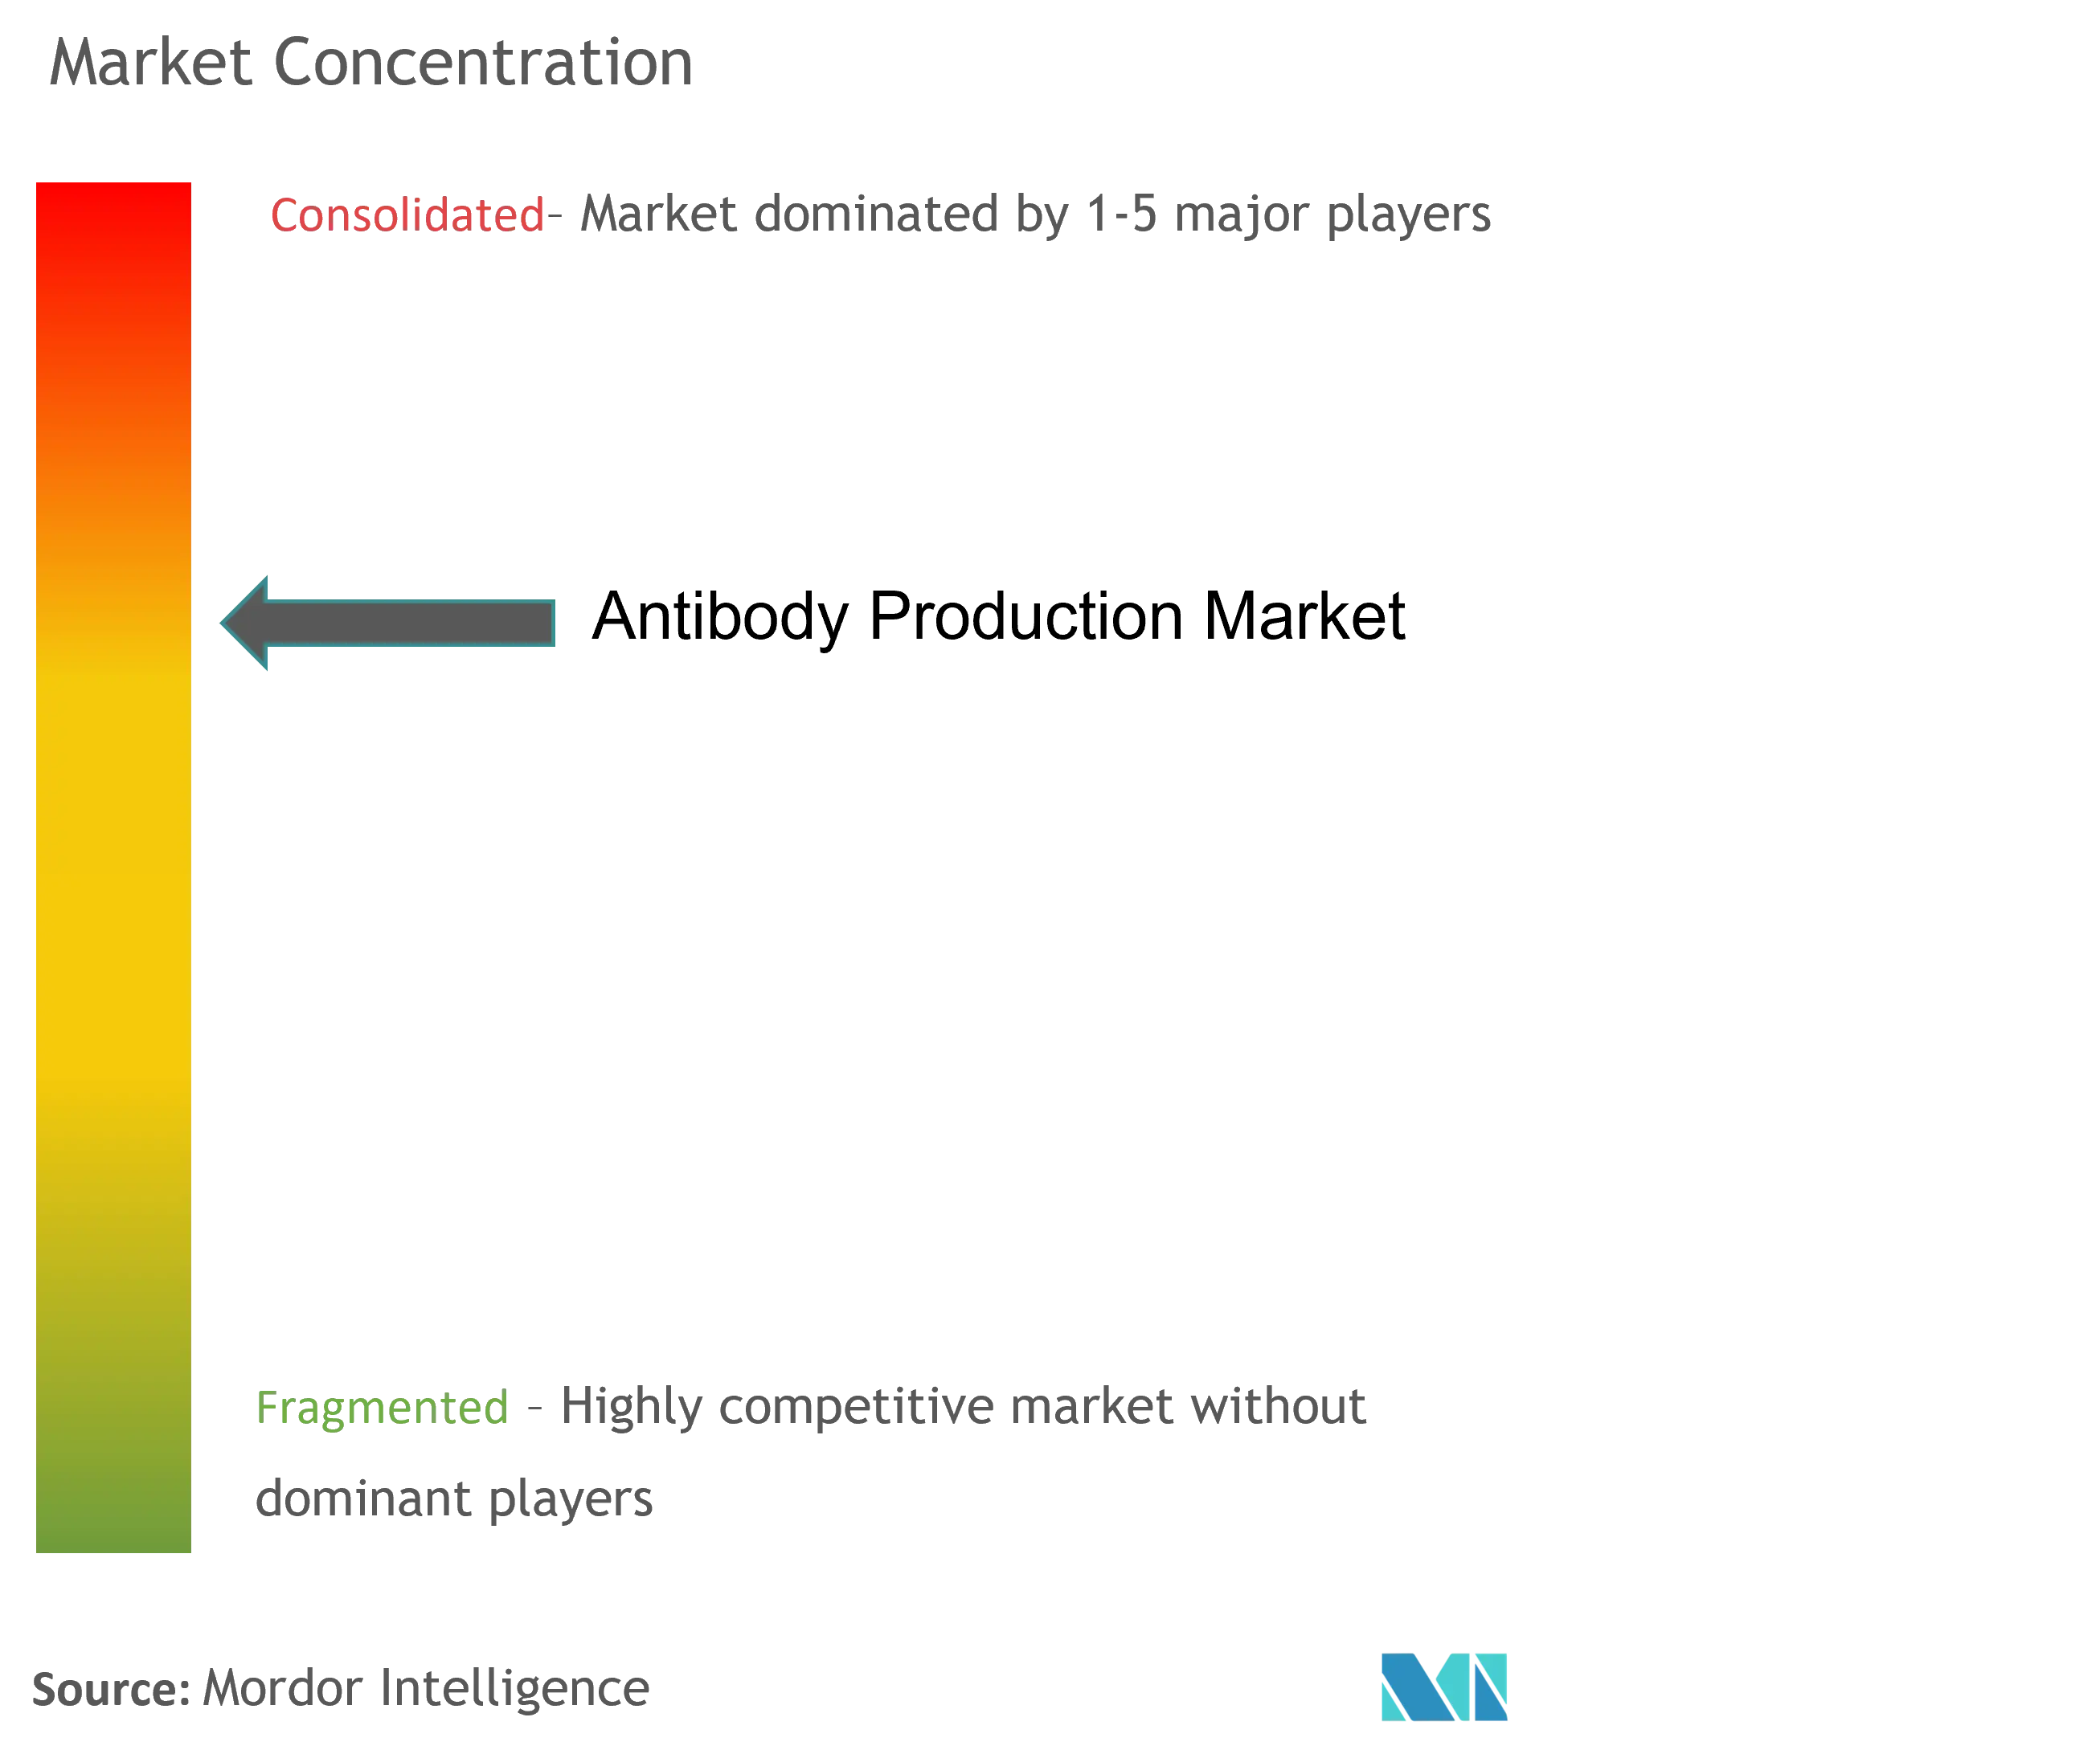
| Market Concentration | Medium |
Major Players *Disclaimer: Major Players sorted in no particular order Image © Mordor Intelligence. Reuse requires attribution under CC BY 4.0. | |
Antibody Production Market Analysis by Mordor Intelligence
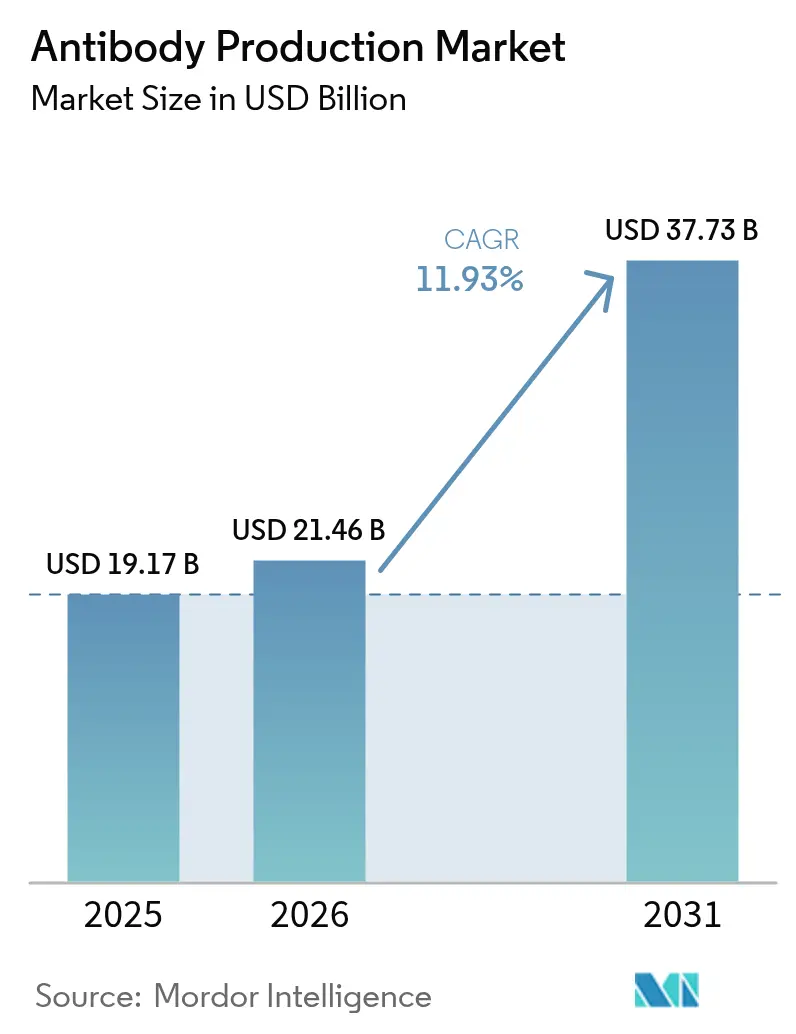
The Antibody Production Market size is expected to grow from USD 19.17 billion in 2025 to USD 21.46 billion in 2026 and is forecast to reach USD 37.73 billion by 2031 at 11.93% CAGR over 2026-2031.
Rising adoption of targeted biologics, the rapid uptake of bispecific formats, and wider diagnostic use cases are expanding demand across therapeutics, research, and clinical laboratories. Continuous investments in single-use bioreactors are pushing production flexibility, while artificial-intelligence tools are shortening cell-line development cycles and improving batch consistency. Regulatory agencies are supporting innovation through expedited pathways for biosimilars and novel antibody constructs, enabling smaller firms and contract manufacturers to scale rapidly. Competitive dynamics are intensifying as full-service suppliers acquire specialist capabilities and contract development and manufacturing organizations (CDMOs) differentiate through proprietary bispecific platforms.
Key Report Takeaways
- By product, consumables led with 61.92% of antibody production market share in 2025; instrument-bioreactors are forecast to grow at an 11.7% CAGR through 2031.
- By process, upstream operations accounted for 57.62% share of the antibody production market size in 2025, while downstream purification is expanding at an 11.43% CAGR to 2031.
- By antibody type, monoclonal IgG held 70.02% of the antibody production market share in 2025; bispecific antibodies register the fastest 11.78% CAGR between 2026-2031.
- By end user, pharmaceutical and biotechnology companies commanded 62.61% share of the antibody production market size in 2025; CDMOs record the highest projected 12.42% CAGR through 2031.
- By geography, North America maintained a 39.45% share in 2025, whereas Asia-Pacific is on track for a 12.75% CAGR to 2031.
Note: Market size and forecast figures in this report are generated using Mordor Intelligence’s proprietary estimation framework, updated with the latest available data and insights as of 2026.
Market Trends and Insights
Drivers Impact Analysis of Antibody Production Market*
| Driver | (~) % Impact on CAGR Forecast | Geographic Relevance | Peak Impact |
|---|---|---|---|
| Accelerated clinical pipelines for ADCs | ~+3.2% | North America & Asia-Pacific (US, China) | Medium term (3-4 yrs) |
| Rapid scale-up of single-use bioreactor capacity | ~+2.8% | Global, concentrated in North America & Europe | Short term (≤ 2 yrs) |
| Regulatory fast-tracking of biosimilar mAbs | ~+2.4% | Global, pronounced in EU, US, China | Medium term (3-4 yrs) |
| AI-enabled cell-line development reducing titer variability | ~+2.1% | Europe with spill-over to North America & Asia-Pacific | Medium term (3-4 yrs) |
| Outsourcing surge to CDMOs | ~+1.9% | Global, strong in US, China, India | Medium term (3-4 yrs) |
| Rising approvals of bispecific antibodies | ~+2.0% | North America & Europe, emerging in Asia | Medium term (3-4 yrs) |
| Adoption of continuous bioprocessing platforms | ~+1.6% | Global, early adopters in US & EU | Long term (≥ 5 yrs) |
| Source: Mordor Intelligence | |||
Accelerated Clinical Pipelines for Antibody–Drug Conjugates (ADCs) in the United States & China
More than 600 ADC candidates are in clinical trials, and at least 10 new approvals are expected by 2027, underscoring sustained momentum in oncology-focused pipelines. The January 2025 FDA approval of AstraZeneca and Daiichi Sankyo’s Datroway reduced disease-progression risk in HR-positive, HER2-negative breast cancer by 37% compared with chemotherapy AstraZeneca[1]Source: Samsung Biologics, “Optimized facilities for flexible, agile manufacturing,” samsungbiologics.com. Expansion of capacity is following suit; AstraZeneca committed USD 1.5 billion for an end-to-end ADC facility in Singapore that comes online in 2029 AstraZeneca. Similar large-scale investments in China support accelerated timelines under National Medical Products Administration priorities. These moves raise demand for high-potency conjugation suites, viral-vector containment, and advanced analytics. As regulatory agencies refine guidance for complex conjugates, manufacturers adopting modular cleanroom designs and high-throughput purification systems are positioned to capture emerging clinical needs.
Rapid Scale-up of Single-Use Bioreactor Capacity
Single-use bioreactors (SUBs) lower cross-contamination risk and enable faster changeovers, key for multi-product facilities. Samsung Biologics’ Plant 5, will add flexible SUB volumes while shortening build time by 30% compared with earlier stainless-steel facilities Samsung Biologics [2]Source: AstraZeneca, “Datroway approved in the US for HR-positive, HER2-negative breast cancer,” astrazeneca.com. Continuous processing integration with SUBs is delivering 25-30% productivity gains and shrinking facility footprints by 40% Pharma Focus America. Sensor miniaturization, single-use probes, and closed-loop control now permit real-time quality adjustments, driving wider adoption beyond clinical lots into commercial, high-titer programs. The trajectory supports strong demand for gamma-sterilized reactor bags, drive units, and disposable ancillary flow-paths, reinforcing supplier growth.
Regulatory Fast-Tracking of Biosimilar mAbs
The FDA’s interchangeability designation for Celltrion’s Yuflyma sets a new precedent that allows pharmacy substitution without physician sign-off FiercePharma. Parallel reforms in China have cut biosimilar approval timelines in half, resulting in 51 domestic launches by late 2024, 31 of which are antibody-based . Accelerated pathways intensify price competition and stimulate capacity additions, especially in Asia, where Henlius shipped 5.5 million trastuzumab biosimilar units to 47 countries by mid-2024 Henlius. Manufacturers are optimizing Protein A reuse, adopting multi-column chromatography, and deploying larger single-pass ultrafiltration systems to stay cost-competitive while maintaining comparability.
AI-Enabled Cell-Line Development Reducing Titer Variability in Europe
European groups have embraced machine-learning models that identify media nutrients influencing charge variants, tightening control over glycosylation for complex bispecifics. Explainable-AI studies highlighted the critical role of Fe, Zn, Cu, and Mn in modulating post-translational profiles Springer. Adoption of such tools is trimming development timelines by up to 30% while lifting early-stage titer predictability. The European Medicines Agency responded by updating validation guidelines to include AI-driven design-of-experiments ISPE. Suppliers of vector engineering services, high-throughput micro-bioreactors, and multi-omic analytics benefit as producers shift toward data-rich development strategies.
Restraints Impact Analysis of Antibody Production Market*
| Restraint | (~) % Impact on CAGR Forecast | Geographic Relevance | Peak Impact | |
|---|---|---|---|---|
| High up-front CAPEX for GMP-grade biomanufacturing facilities | ~-1.5% | Global, stronger drag in emerging markets | Long term (≥ 5 yrs) | |
| Intellectual-property barriers for novel bispecific formats | ~-1.2% | Japan with global spill-over for bispecific innovators | Medium term (3-4 yrs) | |
| Quality-by-Design (QbD) Compliance Complexity for Small & Mid-size Biotechs | ~-1.0% | Global, especially US & EU | Medium term (3-4 yrs) | |
| Chronic Supply Shortages of Recombinant Protein-free Media Components | ~-0.7% | Global, accentuated in APAC during demand peaks | Short term (≤ 2 yrs) | |
| Source: Mordor Intelligence | ||||
High Up‐front CAPEX for GMP-Grade Biomanufacturing Facilities
Constructing a state-of-the-art antibody plant can exceed USD 200 million, with cleanrooms and specialized utilities accounting for 60% of expenditure BioProcess International. Capital recovery stretches across 3-5 years when permitting, validation, and licensure are included. Emerging-market entrants face steeper financing hurdles and interest-rate volatility, curbing greenfield projects. Modular prefabricated facilities can cut construction time by 30-50%, yet the higher cost of imported modules offsets some savings Pharma Focus Asia. Consequently, demand for CDMO capacity rises as innovators defer ownership in favor of fee-for-service models, marginally slowing facility-linked revenue expansion.
Intellectual-Property Barriers for Novel Bispecific Formats in Japan
Japan’s patent office demands extensive in vitro data to support wide bispecific claims, raising the bar for inventive-step recognition. This strict regime has delayed local approvals relative to the US and EU, constraining patient access to cutting-edge modalities. Cross-licensing among incumbents compounds complexity, forcing smaller firms to negotiate unfavorable terms or design around dense patent thickets. Bristol-Myers Squibb’s filings illustrate a layered approach combining composition, process, and formulation coverage to shield assets in the Japanese market. Developers are responding with structurally distinct bispecific architectures, yet iterative engineering cycles lengthen commercialization timelines, dampening near-term uptake.
*Our forecasts treat driver/restraint impacts as directional, not additive. The impact forecasts reflect baseline growth, mix effects, and variable interactions.
Antibody Production Market Segment Analysis
By Product:
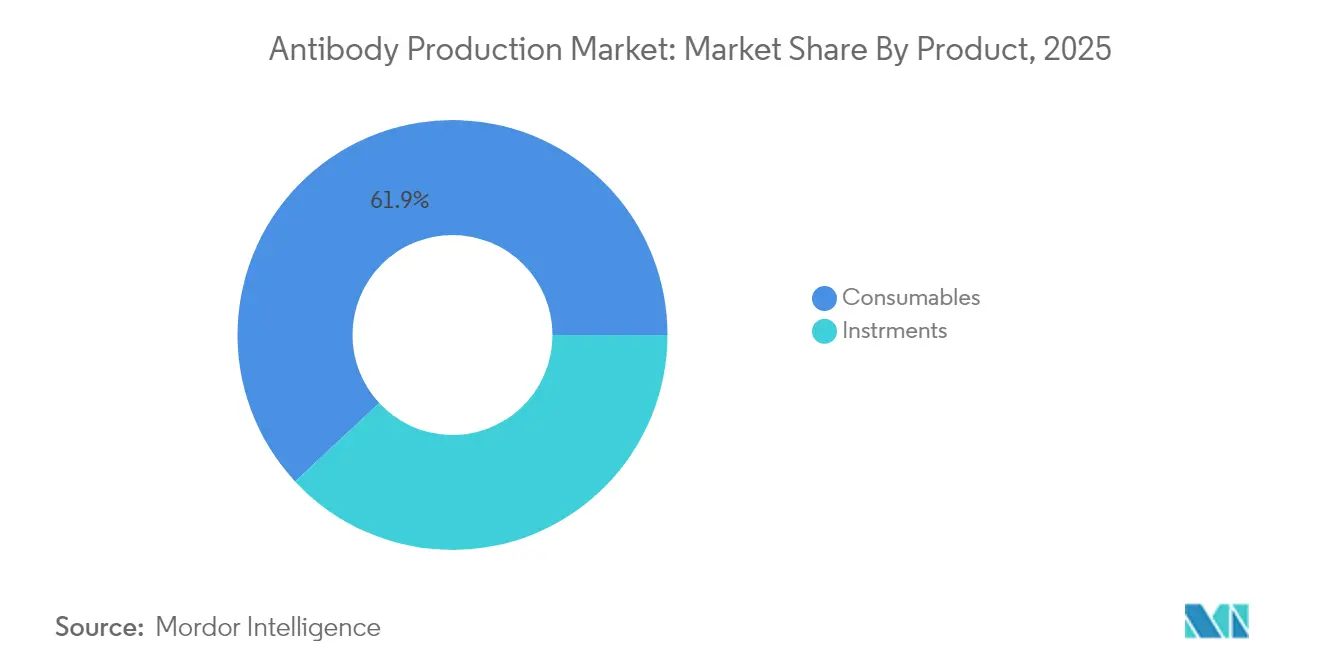
Single-Use Bioreactors Transform Manufacturing EconomicsConsumables commanded 61.92% of antibody production market share in 2025, reflecting the constant demand for media, resins, buffers, and filters that support every production batch. High recurring volumes create predictable cashflows for suppliers but add operational expense for manufacturers working to improve cost-of-goods. Instrument-bioreactors are the fastest-growing category, forecast to advance at an 11.7% CAGR as single-use designs displace stainless-steel systems and enable multi-product agility. Integrated sensors, disposable flow-paths, and gamma-ready plastics mitigate cross-contamination risk and shorten changeovers, aligning with facilities that host diverse bispecific and ADC programs.
Upstream scale-out strategies rely on parallel SUB trains paired with continuous capture, reducing facility footprint while supporting titers beyond 10 g/L. Consumable advances, including smart tubing assemblies with embedded RFID tags, streamline material traceability and aid compliance. As resin lifecycles extend through novel alkaline-tolerant chemistries, operators reduce buffer volumes and lower waste, strengthening environmental metrics that are increasingly tracked within ESG reporting.



By Process:
Downstream Innovations Address Purification BottlenecksUpstream operations held 57.62% of the antibody production market size in 2025, underlining how cell-line productivity and bioreactor performance drive overall economics. Titer improvements emanate from engineered CHO hosts delivering >10 g/L yields and optimized fed-batch strategies that mitigate nutrient depletion. These gains shift the bottleneck to downstream purification, which is therefore growing faster at an 11.43% CAGR through 2031. Multi-modal chromatography resins tailored for bispecific antibodies improve resolution and loading capacities, while next-generation depth filtration couples with flocculation reagents to clarify high-density harvests from 2,000 L SUBs.
Process intensification incorporates continuous viral inactivation and single-pass tangential-flow filtration, creating straight-through purification trains that cut processing time by 30%. Buffer-management skids equipped with inline dilution curb water consumption and floor-space needs. Manufacturers pursuing operational excellence are integrating real-time mass-balance models and PAT-enabled feedback control, yielding consistent glycosylation profiles—a critical parameter for regulatory comparability. The convergence of upstream and downstream intensification unlocks cost savings and accelerates batch release, reinforcing competitiveness in the antibody production market.
By Antibody Type:
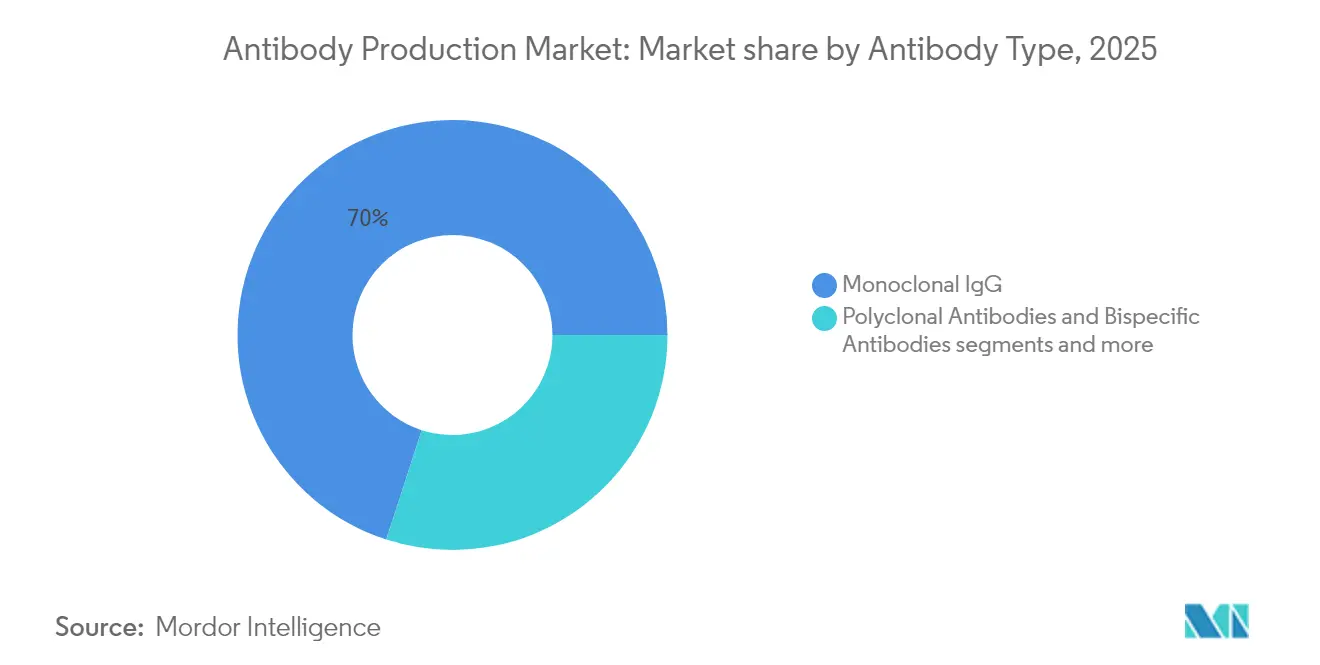
Bispecific Platforms Drive Innovation PipelineMonoclonal IgG antibodies retained 70.02% of antibody production market share in 2025 due to established targets, well-validated processes, and broad clinical experience. Scale economies and robust supply chains support attractive margins for top sellers. In parallel, bispecific antibodies are expanding at a 11.78% CAGR and are expected to reach USD 18.64 billion by 2031, reflecting their capacity to engage dual targets for heightened efficacy Biointron. Manufacturing complexity centers on correct light-chain pairing and heterodimer assembly, prompting innovations such as Knobs-into-Holes and common-light-chain frameworks.
Proprietary platforms including Roche’s Columvi, approved for diffuse large B-cell lymphoma in 2025, demonstrate a 41% mortality-risk reduction versus standard care FiercePharma. Advances in dual-affinity retargeting and Beat® technologies seek to simplify purification by enabling single-step capture. Sustained R&D intensity fuels demand for analytical assays that quantify target affinity and effector function early in development. Fragment-based constructs and antibody-drug conjugates introduce additional diversity, yet each format leverages shared upstream and downstream infrastructure, reinforcing the cohesive growth of the antibody production market.
By End User:
CDMOs Capture Growing Outsourcing TrendPharmaceutical and biotechnology firms held 62.61% of the antibody production market size in 2025, stewarding extensive pipelines and global commercial supply. Still, capacity rationalization and risk mitigation motivate large sponsors to outsource select programs. CDMOs therefore post a leading 12.42% CAGR, buoyed by demand for flexible capacity and specialized know-how. WuXi Biologics reported RMB 18.7 billion revenue in 2024, with a USD 18.5 billion backlog underpinned by 151 new projects predominately originating from the US WuXi Biologics.
Leading service providers leverage proprietary technologies such as WuXiBody™ to resolve bispecific assembly challenges, while Lonza expands conjugation suites to capture the surging ADC wave Lonza. Diagnostic laboratories occupy a smaller but stable niche, applying antibodies for companion tests and research assays that inform precision-medicine decisions. Academia and government institutes remain vital for early-stage innovation, often partnering with CDMOs to translate discoveries into GMP batches. The outsourcing paradigm intensifies competition, driving CDMOs to invest in digital twins, process intensification, and end-to-end project orchestration
By Method:
In Vitro Platforms Enhance ReproducibilityIndustrial producers largely rely on in vitro expression systems because they deliver controlled environments, minimized variability, and scalable outputs. Phage-display libraries encompassing billions of variants expedite candidate selection against challenging epitopes, while ribosome display adds a cell-free route that accelerates soluble expression screening. The antibody production market benefits as these platforms streamline early discovery pipelines and feed high-quality sequences into process development. Improvements in vector design, codon optimization, and host-cell engineering further boost expression stability, reducing late-stage attrition.
In vivo methods remain necessary for broad-spectrum polyclonal applications, yet ethical and regulatory pressures limit future expansion. Humanized mice and transgenic strains capable of producing fully human antibodies satisfy some of the demand while aligning with 3Rs (replacement, reduction, refinement) principles. Integration of machine learning to predict solubility and aggregation risk from sequence data shortens candidate triage timelines, reinforcing efficiency gains across antibody production industry workflows. As computational and wet-lab techniques converge, the market anticipates higher success rates and faster transitions from discovery to clinical manufacture.
Geography Analysis
North America Antibody Production Market
North America dominated the antibody production market with a 39.45% share in 2025, supported by strong capital markets, a dense cluster of biopharmaceutical companies, and advanced regulatory frameworks. The FDA’s continued refinement of accelerated pathways fosters innovation in bispecifics and biosimilars, sustaining market expansion. Artificial-intelligence integration into production analytics is becoming mainstream, enabling real-time release strategies that cut inventory costs.
APAC Antibody Production Market
Asia-Pacific delivers the fastest 12.75% CAGR, propelled by expanding manufacturing ecosystems in China and India and supportive government policies. Biocon’s US approval for Jobevne underscores India’s rising quality credentials GaBIOnline. Regional CDMOs ramp continuous processing and modular plant builds to satisfy domestic and export needs. Japan’s cautious stance on intellectual-property protection for bispecific formats slows local launches but encourages inventive structural workarounds.
Europe Antibody Production Market
Europe retains significant weight through its mature biosimilar landscape, with 64 approvals reflecting early regulatory leadership. Emphasis on sustainability drives uptake of continuous manufacturing and solvent-reduction initiatives. The European Shortages Monitoring Platform and revised GMP guidelines for AI signal regulatory vigilance toward supply security and digital oversight ISPE.
Regulatory Landscape
Global antibody production operates under harmonized biologics expectations that center on viral safety, process control, and comparability. A key recent anchor is the ICH Q5A(R2) update on viral safety evaluation, implemented across major regions from 2024, reinforcing risk-based viral testing and validation expectations for products derived from human or animal cell lines and shaping upstream cell banking and downstream viral clearance strategies.
In the United States, FDA actions are also shifting development and CMC planning. FDA announced in April 2025 a plan to phase out animal testing requirements for monoclonal antibodies and other drugs, and in December 2025 issued draft guidance on streamlined nonclinical safety studies for monoclonal antibodies. Post-approval manufacturing changes for licensed biologics continue to be governed by FD&C Act Section 506A and 21 CFR 601.12, keeping change management, comparability packages, and notification categories as ongoing compliance drivers for scale-ups, site transfers, and single-use platform changes. In Europe, EMA guidance on development, characterization, and specification for monoclonal antibodies and related products similarly emphasizes platform validation and viral safety adherence.
Competitive Landscape
The antibody production market is moderately concentrated, with Thermo Fisher Scientific, Merck KGaA, and Danaher anchoring top-tier share through integrated portfolios of reagents, instruments, and services. Strategic M&A intensifies competitive pressure; Pfizer’s acquisition of Seagen adds a differentiated ADC pipeline and manufacturing know-how, reshaping capability distribution BioPharma APAC. Integrated suppliers capitalize on cross-selling opportunities, bundling single-use hardware with chromatography consumables and digital control systems.
Specialist innovators pursue white-space opportunities in bispecifics, multispecifics, and Fc engineering. F-star Therapeutics leverages its mAb²™ platform to generate tetravalent bispecifics, while Zymeworks advances Azymetric constructs that retain natural IgG architecture . These players partner with CDMOs to offset capital intensity, exchanging technology access for manufacturing slots. Intellectual-property breadth and depth increasingly define negotiating leverage, prompting robust patent filings that encompass process, formulation, and device configurations.
Technology leadership has become a decisive success factor. Companies embed predictive analytics into real-time control loops, elevating batch yields and lowering deviations. Continuous bioprocessing platforms, AI-guided cell-line selection, and high-throughput screening equip firms to deliver faster, lower-cost products. The evolving competitive landscape rewards agility, technological differentiation, and global regulatory fluency, ensuring sustained momentum in the antibody production market.
Antibody Production Industry Leaders
Sartorius AG
Danaher Corporation
Merck KGaA
Eppendorf AG
Thermo Fisher Scientific
- *Disclaimer: Major Players sorted in no particular order
Antibody Production Market Companies Covered in this Report
- Thermo Fisher Scientific
- Merck KGaA (MilliporeSigma)
- Danaher Corp. (Cytiva & Pall)
- Sartorius Stedim Biotech SA
- Lonza Group
- AGC Biologics
- Wuxi Biologics
- Charles River
- Abcam
- Bio-Rad Laboratories
- Eppendorf
- Boehringer Ingelheim BioXcellence
- Samsung Group
- Genscript
- Polpharma Biologics
- Rentschler Biopharma SE
- KBI Biopharma
- Selexis
- Biocon Biologics
- AGC Biologics

Market Opportunities and Future Outlook
Large, recent capacity additions and upgrades across regions create near-term whitespace for suppliers of bioreactors, single-use assemblies, resins, and process services that support faster changeovers and higher throughput. In February 2026, Fujifilm Biotechnologies opened an expanded Teesside, UK manufacturing facility built around 2,000 L and 5,000 L single-use bioreactors for antibody production, pointing to continued demand for flexible trains that fit multi-product portfolios. In Asia, LOTTE Biologics completed construction of Songdo Bio Campus Plant 1 in June 2026 with 120,000 L across eight 15,000 L stainless-steel bioreactors, and Celltrion announced in March 2026 an investment plan through 2030 to expand Songdo Plants 4 and 5 and increase total capacity by 180,000 L, while also expanding its Branchburg, New Jersey facility to 75,000 L, indicating parallel buildouts across Asia and North America.
Opportunities also cluster around outsourcing models and complex antibody formats that raise process-development, analytics, and containment requirements, supporting CDMO differentiation and vendor pull-through across upstream and downstream workflows. In India, Aurobindo Pharma (via TheraNym) announced in April 2026 a USD 150-175 million investment to establish a large-scale drug substance facility for MSD with 60,000 L of mammalian cell culture capacity, and it inaugurated a TheraNym biologics facility in Telangana in June 2026 with MSD as an anchor customer. Alongside capacity growth, technical roadmaps from bodies such as NIIMBL point to standardization needs in areas like single-use connectivity and automated process monitoring, which sustains demand for integrated platforms that reduce tech-transfer friction across sites and partners.
Recent Industry Developments in Antibody Production Market
- June 2026: Sartorius expanded its collaboration with LFB BIOMANUFACTURING to provide an integrated offering spanning cell line development through the first GMP drug substance batch. The move links upstream development and GMP execution under one service framework, supporting faster handoffs for sponsors scaling antibody programs and increasing competitive pressure on CDMOs and tool providers to deliver end-to-end packages.
- March 2026: Sartorius launched a rational-design, genetically engineered CHO host cell line developed using proteomic profiling and targeted genome editing, reporting up to a three-fold productivity increase. This strengthens supplier-led differentiation in cell line and upstream platform choices, with downstream implications for capacity utilization and cost-of-goods in commercial antibody production.
- October 2024: Merck KGaA announced a EUR 70 million investment to triple antibody-drug conjugate (ADC) manufacturing capacity at its BioConjugation Center of Excellence in St. Louis, Missouri. The expansion adds specialized bioconjugation capability adjacent to antibody production workflows, increasing demand for high-purity intermediates, robust analytics, and compliant change-control practices across connected manufacturing steps.


Antibody Production Market Report Scope and Research Methodology
Market Definition and Coverage
This market covers the revenues linked to producing antibodies, starting from upstream steps like cell line and cell culture preparation, and moving through downstream purification and finishing steps used to make bulk antibodies.
Scope exclusions: Finished antibody medicines sold as drugs, antibody drug conjugates, and packaged diagnostic test kits are excluded from this market sizing.
Segments Covered in This Report
- By Product
- Consumables
- Media & Sera
- Reagents & Supplements
- Buffers & Chemicals
- Instruments
- Bioreactors
- Chromatography Systems
- Filtration & Separation Devices
- Supporting Lab Equipment
- Consumables
- By Process
- Upstream Processing
- Cell-Line Development
- Culture Expansion & Expression Systems
- Downstream Processing
- Clarification & Capture
- Purification
- Formulation & Fill-Finish
- Upstream Processing
- By Antibody Type
- Monoclonal Antibodies
- Polyclonal Antibodies
- Bispecific Antibodies
- Antibody Fragments
- By End User
- Pharmaceutical & Biotechnology Companies
- Contract Manufacturing / Research Organizations (CMOs/CROs)
- Academic & Government Research Institutes
- Diagnostic Laboratories
- By Geography
- North America
- United States
- Canada
- Mexico
- Europe
- Germany
- United Kingdom
- France
- Italy
- Spain
- Rest of Europe
- Asia-Pacific
- China
- Japan
- India
- South Korea
- Australia
- Rest of Asia
- Middle East and Africa
- GCC
- South Africa
- Rest of Middle East and Africa
- South America
- Brazil
- Argentina
- Rest of South America
- North America
Data Sources, Market Sizing, and Validation
Desk Research
Desk research began by mapping the antibody production workflow and the main spend items that typically repeat across programs. This helped keep the market definition stable when we moved into sizing. For public context, we referenced the US FDA (biologics and manufacturing guidance), the NIH and PubMed-indexed journals for process trends, the WHO for biologics context, and OECD health statistics as broader demand signals tied back to therapy volumes.
We also used company filings, annual reports, investor presentations, and product documentation to understand where revenues sit across instruments, consumables, and process services, then sanity checked typical price ranges. Where needed, selected paid databases supported company financials and news tracking, and patent databases were used to track technology intensity in expression systems and purification. The desk sources noted above are illustrative, and additional public references were reviewed for data collection, validation, and clarification.
Primary Interviews and Surveys
Primary discussions were held with process-development leads, manufacturing heads, procurement teams, and distribution-side specialists who track ordering patterns for media, resins, single-use systems, and related equipment. To reduce the risk of relying on a single viewpoint, feedback was gathered across in-house manufacturing and outsourced production settings, then checked across major regions where antibody development pipelines and capacity additions are active.
Distribution of primary research fieldwork respondents
| Company type | Respondent position | Region |
|---|---|---|
| Top tier: 39% | CXOs: 14% | APAC: 37% |
| Mid tier: 43% | Functional/Unit leaders: 39% | EMEA: 37% |
| Smaller Players: 18% | Managers: 47% | Americas: 26% |
Market-Sizing & Forecasting
Sizing was built using a top-down approach where bioprocess production footprints and antibody pipeline activity were translated into a demand pool for production inputs, and then converted into value using typical spend mixes across instruments, consumables, and process services. After that first pass, we corroborated the outputs with selective bottom-up checks, including supplier and channel checks on sampled pricing, replacement cycles for core systems, and volume-linked consumable run rates. This step helped adjust outliers rather than carrying them through to the final totals.
Key inputs included the count and scale of manufacturing capacity additions, the intensity of single-use adoption in upstream runs, chromatography and filtration utilization patterns in downstream steps, typical batch yields and run frequency for common production modes, and pricing movement for high-turn consumables (media, buffers, resins, and filters). Forecasting used scenario analysis informed by expert views on capacity timing, regulation-driven quality upgrades, and the pace of clinical to commercial transitions. When primary inputs were not available by country, gaps were handled using proxy indicators such as biologics manufacturing presence, import-export signals for key consumables, and cross-checked regional mix assumptions.
Data Validation & Update Cycle
Validation was done by checking the model against independent signals, including capacity announcements, biologics pipeline momentum, and observed procurement behavior for frequently replenished inputs. When large variances appeared by region or by cost bucket, we reworked the underlying assumptions and used follow-up calls to confirm what changed in utilization or pricing.
Before sign-off, the work goes through multi-step analyst review that includes unit checks, currency consistency checks, and reasonableness checks against historical growth patterns. Reports are refreshed annually, and interim updates are made when material events occur, such as major capacity ramps, regulatory changes that affect process demand, or sharp input price shifts. Right before delivery, a final pass is completed to ensure the latest view is reflected.
Mordor Intelligence's Antibody Production Market Estimate Compared With Other Published Estimates
Published market sizes for antibody production can differ even when the topic name sounds the same. The main drivers are that each publisher may count a different revenue pool and may also anchor the model to a different base year. Differences often reflect scope inclusions, how pricing is handled for high-turn consumables, and how quickly assumptions are refreshed when capacity plans change.
Finished antibody therapeutics sit outside Mordor Intelligence's scope, which keeps the estimate focused on production infrastructure, consumables, software, and process services rather than drug sales. That single exclusion can shift totals by several billions depending on the source. Other gaps come from whether a study treats equipment as a one-time capital item or spreads it through replacement cycles, and whether growth is driven by aggressive capacity utilization assumptions instead of run-rate signals that can be observed through suppliers and end users.
Benchmark comparison
| Source | Market Size | Gaps in Research Methodology |
|---|---|---|
| Mordor Intelligence | USD 21.46 B (2026) | |
| Global Consultancy A | USD 15.44 B (2024) | Uses an earlier base year and may apply a different split between consumables and capital equipment, which can suppress the starting value if replacement and utilization effects are not fully reflected. |
| Industry Publisher B | USD 17.00 B (2025) | Leans more toward production services and technology models and can exclude parts of the equipment and consumables revenue stream when those are treated as separate upstream bioprocessing markets. |
Taken together, the spread is mainly explained by what gets counted around drug sales versus production inputs, along with base-year selection and how equipment spend is normalized over time. By tying the market back to observable manufacturing activity and repeatable spend drivers, the sizing stays transparent and easier to reconcile when new capacity or pricing information comes in.


Key Questions Answered in the Report
What is the current Antibody Production Market size?
The antibody production market stands at USD 21.46 billion in 2026 and is projected to grow to USD 37.73 billion by 2031.
Which product category is expanding fastest?
Instrument-bioreactors, particularly single-use systems, show the highest growth with an 11.7% CAGR through 2031.
Why are bispecific antibodies important?
Bispecific antibodies can bind two distinct targets simultaneously, improving therapeutic efficacy and driving a 11.78% CAGR, the highest among antibody types.
How quickly is Asia-Pacific growing?
Asia-Pacific is forecast to register a 12.75% CAGR from 2026-2031, making it the fastest-growing regional market.
Why do companies outsource antibody production?
Outsourcing to CDMOs offers flexible capacity and specialist expertise, highlighted by CDMOs’ 12.42% projected CAGR.
What role do single-use bioreactors play in market expansion?
Single-use bioreactors reduce contamination risk and capital costs, contributing ~+2.8 percentage-points to the overall market CAGR.
Page last updated on:





