Anti-Drone Market Size and Share
Market Overview
| Study Period | 2019 - 2031 |
|---|---|
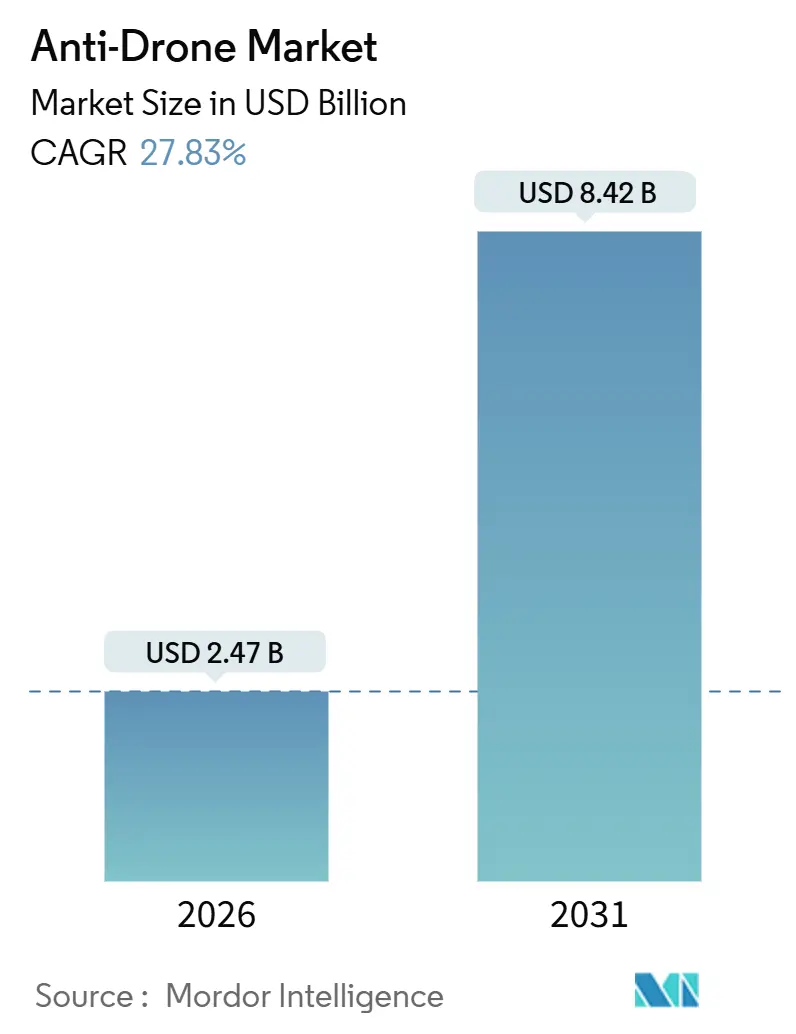
| Market Size (2026) | USD 2.47 Billion |
| Market Size (2031) | USD 8.42 Billion |
| Growth Rate (2026 - 2031) | 27.83% CAGR |
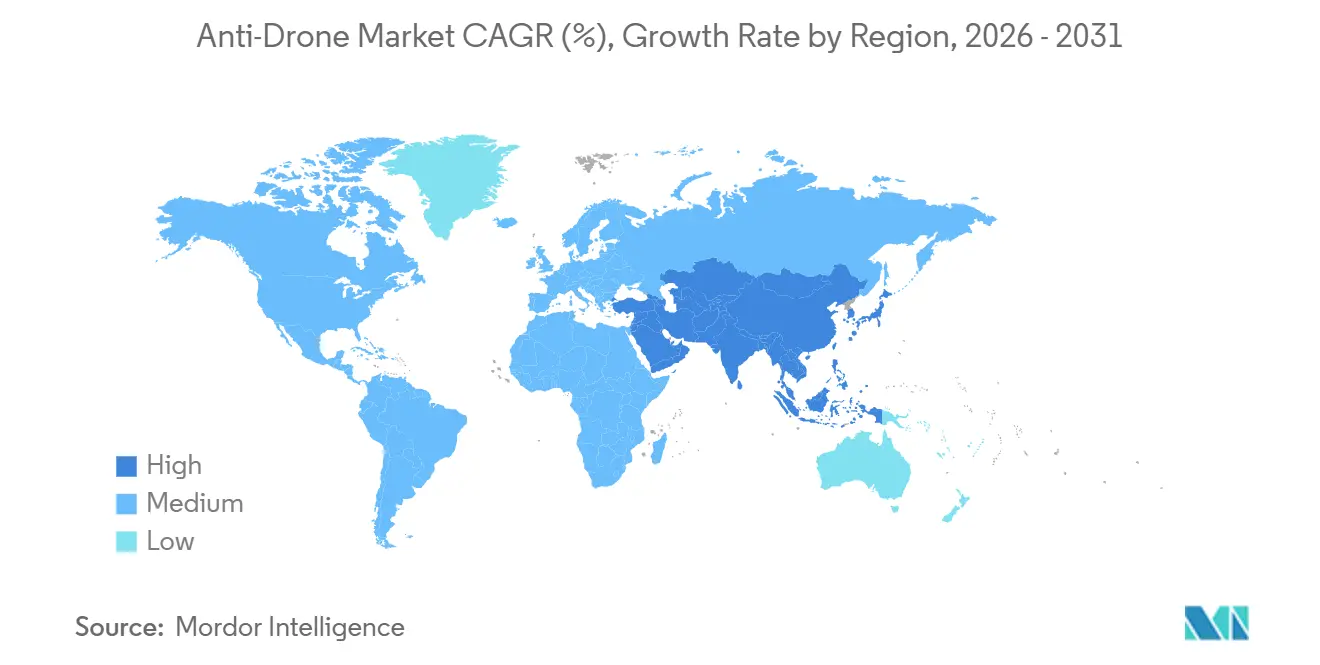
| Fastest Growing Market | Asia Pacific |
| Largest Market | North America |
| Market Concentration | Medium |
Major Players *Disclaimer: Major Players sorted in no particular order Image © Mordor Intelligence. Reuse requires attribution under CC BY 4.0. | |
Anti-Drone Market Analysis by Mordor Intelligence
The anti-drone market size was valued at USD 2.47 billion in 2026, and is projected to reach USD 8.42 billion by 2031, advancing at a 27.83% CAGR, as commercial operators, critical infrastructure managers, and homeland security agencies move to counter the accelerating proliferation of small unmanned aerial systems. Demand momentum stems from converging regulatory mandates, a sharp increase in airspace incursions, and the maturation of AI-powered sensor fusion, which lowers false-alarm rates while improving range discrimination. Vendors that package detection and mitigation capabilities into software-defined, service-based offerings now address long-standing capital-budget hurdles and shorten procurement cycles for stadiums, prisons, and temporary venues. Simultaneously, rising geopolitical risk, particularly in Eastern Europe and the Middle East, prompts increased public-sector spending, which accelerates the diffusion of technology into civilian facilities. Overall, the anti-drone market benefits from a multi-layered growth engine, comprising regulation, threat escalation, and technology convergence, which creates structural resilience even when discretionary security budgets are tightened.
Key Report Takeaways
- By technology, detection systems led with a 53.95% revenue share in 2025; neutralization/countermeasure systems are projected to grow at a 27.65% CAGR through 2031.
- By platform type, fixed installations held 39.85% of the anti-drone market share in 2025; portable systems are forecasted to expand at a 28.59% CAGR through 2031.
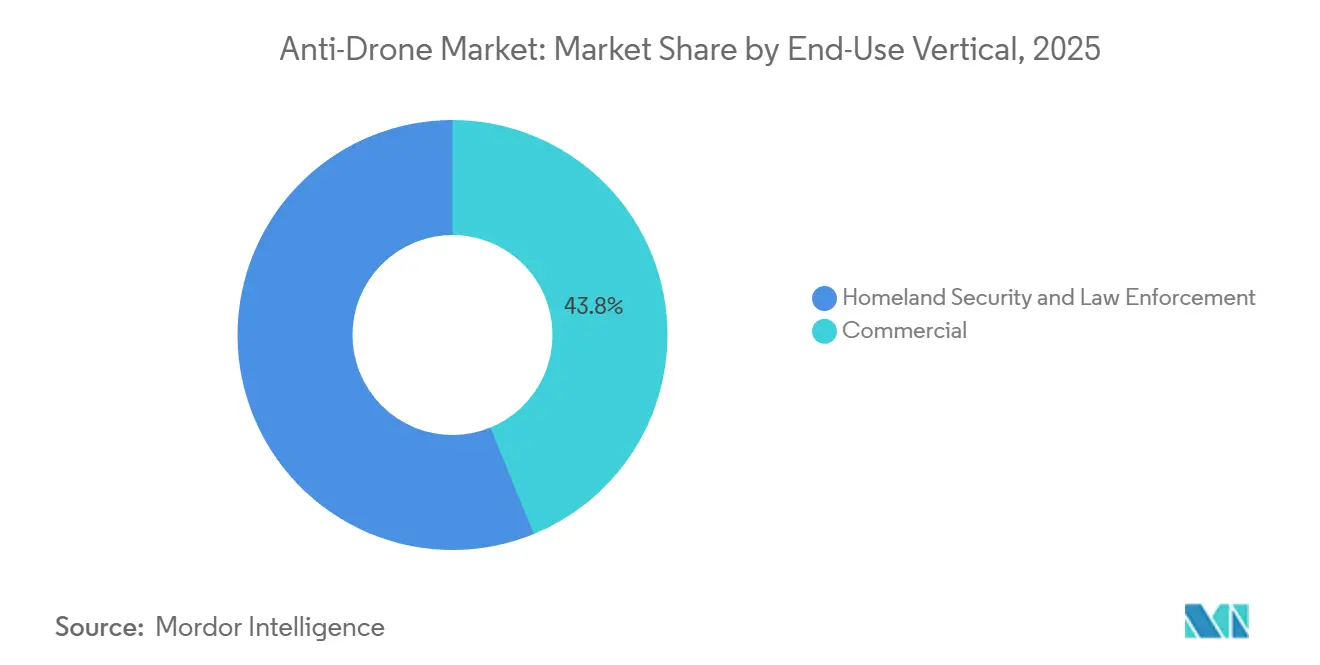
- By end-use vertical, commercial facilities accounted for 43.83% of 2025 spending; homeland security and law enforcement deployments are advancing at a 26.12% CAGR, driven by remote ID enforcement cycles.
- By operating range, medium-range solutions captured 48.29% of 2025 revenue; short-range platforms are expected to post a 26.34% CAGR to 2031.
- By geography, North America contributed 40.55% of the global revenue in 2025, while the Asia-Pacific region is the fastest-growing at a 27.11% CAGR through 2031.
Note: Market size and forecast figures in this report are generated using Mordor Intelligence’s proprietary estimation framework, updated with the latest available data and insights as of January 2026.
Global Anti-Drone Market Trends and Insights
Drivers Impact Analysis*
| Driver | (~) % Impact on CAGR Forecast | Geographic Relevance | Impact Timeline |
|---|---|---|---|
| Proliferation of low-cost commercial drones threatening civilian assets | +6.2% | Global, acute in North America, Europe, Asia-Pacific urban corridors | Short term (≤ 2 years) |
| Stricter FAA and EU U-space mandates for drone detection | +5.8% | North America and Europe, spillover to Middle East | Medium term (2-4 years) |
| Drone incursions at critical infrastructure (energy, airports) | +5.1% | Global; US energy belt, European airports, Middle East oil facilities | Short term (≤ 2 years) |
| AI-powered multi-sensor fusion improves detection accuracy | +4.7% | North America and Europe early adopters, Asia-Pacific rapid follower | Medium term (2-4 years) |
| C-UAS-as-a-Service cuts CapEx for venue operators | +3.9% | North America and Europe event markets, expanding to Asia-Pacific mega-events | Medium term (2-4 years) |
| Private 5G campus networks enable passive RF detection | +2.4% | North America industrial campuses, Europe manufacturing hubs, Asia-Pacific smart cities | Long term (≥ 4 years) |
| Source: Mordor Intelligence | |||


Proliferation Of Low-Cost Commercial Drones Threatening Civilian Assets
Consumer drones priced under USD 500 now deliver 4K video and 30-minute endurance, enabling hostile actors to gather intelligence or deliver payloads with minimal skill. Monthly FAA incident logs exceeded 100 airport drone sightings in 2024, a year-on-year rise of 40%, while Copenhagen Airport halted operations for 90 minutes in September 2025 after an unidentified quadcopter breached its perimeter.[1]Copenhagen Airport, “September 2025 Drone Incident,” cph.dk UK prisons recorded 347 contraband-carrying drone incursions in 2024, prompting the Ministry of Justice to issue an order for fixed counter-UAS installations at all Category A facilities by mid-2026. The asymmetry is stark: a USD 400 drone can idle a multi-million-dollar facility, forcing operators to adopt layered detection and mitigation frameworks. Insurance underwriters began excluding drone-related losses from standard property cover in 2025, effectively obligating risk-exposed sites to invest in counter-UAS technologies to retain coverage.
Stricter FAA And EU U-Space Mandates For Drone Detection
The FAA’s Remote ID rule, which has been in effect since March 2024, requires drones weighing more than 250 grams to broadcast identifying data, establishing an implicit obligation for airports and critical infrastructure owners to monitor compliance in real-time. In the EU, Regulation 2021/664 requires member states to develop U-space corridors that integrate cooperative and non-cooperative traffic detection by 2026.[2]European Commission Joint Research Centre, “Multi-Sensor Fusion Study,” ec.europa.eu These policies shift liability: operators that fail to detect incursions face risks to their license renewal and rising insurance premiums. National aviation authorities now routinely link operating permits to demonstrated anti-drone capability, compressing procurement timelines and rewarding vendors that ship software-defined, update-ready platforms.
Drone Incursions at Critical Infrastructure (Energy, Airports)
Energy sites and airports experience a disproportionate share of high-impact incursions. The Palo Verde Nuclear Generating Station in Arizona reported multiple drone overflights in 2024, prompting the US Nuclear Regulatory Commission to issue guidance mandating perimeter detection at all plants by 2027. German refineries suffered coordinated reconnaissance probes in early 2025, leading the Federal Network Agency to authorize limited RF jamming inside 500-meter exclusion zones, an unprecedented carve-out in the EU regulatory framework. Gatwick’s 2018 closure remains a reference point; subsequent UK Civil Aviation Authority rules oblige every airport with over 5 million annual passengers to maintain 24/7 counter-UAS coverage. These events validate the use of multi-sensor layering, including radio-frequency (RF), electro-optical (EO), infrared (IR), and acoustic, as single-modality solutions fail when adversaries employ frequency hopping or waypoint autonomy.
AI-Powered Multi-Sensor Fusion Improves Detection Accuracy
RF-only detection falters when drones fly pre-programmed missions or masquerade within spread-spectrum traffic. DroneShield’s SensorFusionAI, deployed at Australian critical infrastructure sites in 2025, combines RF, EO, IR, and acoustic data through convolutional neural networks trained on 50,000 labeled signatures, delivering 94% classification accuracy compared to 67% for RF-only baselines. A European Commission Joint Research Centre study demonstrated that acoustic arrays can detect rotor harmonics at a distance of 300 meters, even when RF emissions cease, thereby reducing false negatives by 40%. YOLO-based vision models running on NVIDIA Jetson edge processors now analyze 4K feeds at 30 fps with sub-200 ms latency, enabling seamless handoffs across fixed cameras as drones transit facility perimeters. This convergence pushes the anti-drone market toward data-centric value propositions and lowers the cost of compliance for smaller sites.
Restraints Impact Analysis*
| Restraint | (~) % Impact on CAGR Forecast | Geographic Relevance | Impact Timeline |
|---|---|---|---|
| Ambiguous legality of RF jamming and kinetic takedown | -3.8% | Europe and North America commercial sectors, less restrictive in Middle East government applications | Medium term (2-4 years) |
| High false-alarm rates in 5G-dense urban zones | -2.6% | North America and Asia-Pacific metro areas, Europe dense-city cores | Short term (≤ 2 years) |
| Privacy concerns over wide-area acoustic/EO surveillance | -1.9% | Europe under GDPR, California and select US states, emerging in Asia-Pacific | Long term (≥ 4 years) |
| Fragmented liability between drone and site operators | -1.4% | Global, acute in North American tort environment, evolving in Europe under Product Liability Directive | Medium term (2-4 years) |
| Source: Mordor Intelligence | |||
Ambiguous Legality of RF Jamming and Kinetic Takedown
US law prohibits non-federal entities from emitting RF jammers; however, experimental licenses granted by the Federal Communications Commission, under the supervision of the Department of Homeland Security (DHS), permit limited use. This process can take a year to complete.[3]Federal Communications Commission, “RF Jammer Enforcement,” fcc.gov The EU’s Radio Equipment Directive also restricts intentional interference, pushing commercial sites toward cyber takeover or kinetic options that raise concerns about safety and tort liability. Net-capture drones or interceptor rounds risk third-party damage, yet few jurisdictions provide safe-harbor immunity. This patchwork hinders the commercial adoption of neutralization technologies and diverts capital toward detection-only deployments that cannot resolve immediate threats.
High False-Alarm Rates In 5G-Dense Urban Zones
Government Accountability Office pilots at large US airports in 2024 logged false positives on 32% of alerts, with C-band 5G handset uplinks imitating drone control bursts.[4]U.S. Government Accountability Office, “Airport Counter-UAS Pilots,” gao.gov Dedrone’s urban RF study warns that spectral overlap forces systems to insert masking algorithms, which add 200 ms of processing latency and reduce detection range by up to 30%. Seoul’s Incheon Airport retrained AI classifiers in 2025 to suppress alerts from delivery robots and autonomous tugs; however, site-specific tuning increased deployment costs by 15% and delayed go-live milestones. High false-positive rates erode operator confidence, prompting temporary shutdowns and, in some cases, system deactivation during peak traffic; a window that hostile drone pilots often exploit.
*Our forecasts treat driver/restraint impacts as directional, not additive. The impact forecasts reflect baseline growth, mix effects, and variable interactions.
Segment Analysis
By Technology: Neutralization Gains as Legal Clarity Improves
Neutralization systems are projected to expand at a 27.65% CAGR from 2026 to 2031, gradually eroding the detection-only dominance that delivered 53.95% of 2025 revenue. The shift accelerates as aviation and telecommunication regulators begin granting conditional approvals for cyber-takeover and low-collateral kinetic interceptors. Anduril’s Roadrunner reusable interceptor demonstrated 95% kill probability in US Army trials and slashed per-engagement costs below USD 10,000 compared with expendable net-capture solutions.[5]Anduril Industries, “Roadrunner,” anduril.com D-Fend Solutions’ EnforceAir2 guides rogue drones to safe-landing zones via GPS spoofing, avoiding RF-jamming prohibitions in European jurisdictions. Detection remains critical, yet insurers started offering 10% to 15% premium reductions in 2025 for sites that demonstrate autonomous mitigation, tilting capital-allocation decisions toward neutralization capability.
Detection vendors answer by embedding analytics and machine-learning (ML) classifiers rather than proliferating hardware. Dedrone’s RF-EO fusion sensors integrate into Verizon private LTE cores, enabling subscription pricing that offsets upfront capital expenditure. Directed-energy systems, such as Epirus’s 20 kW microwave effector, attract defense customers but remain niche in civil markets due to their 30 kVA power requirements and USD 2 million unit costs. Between 2026 and 2031, the anti-drone market is expected to split by jurisdiction: detection-only in regulation-heavy regions and integrated detection-defeat packages in territories where liability regimes evolve faster than legislative reform.


By Platform Type: Portable Units Serve Temporary Venues
In 2025, fixed platforms accounted for 39.85% of the revenue, as airports, nuclear plants, and oil refineries require 24/7 coverage with overlapping sensor fields. Even so, portable systems are forecast to post a 28.59% CAGR, mirroring the rise of event-driven security contracting. DroneShield’s DroneSentry-X Mk2, weighing 35 kg and deployable in 15 minutes, protected the 2024 Paris Olympics and the 2025 World Economic Forum.
Rental economics amplify traction for portables: operators pay USD 10,000-20,000 per week versus USD 500,000 upfront for fixed arrays, aligning with the C-UAS-as-a-Service paradigm. Fixed installations still dominate the anti-drone market size for critical facilities because 10-km radar envelopes, as offered by Thales’ Falcon Shield, remain indispensable at congested airfields. Modular designs blur the boundary; Saab’s Giraffe 1X ships in ISO containers that bolt to rooftops or truck beds, satisfying semi-permanent use cases.
By End-Use Vertical: Commercial Leads, Homeland-Security Cycles
Commercial facilities accounted for 43.83% of 2025 revenue and are projected to maintain a robust 26.12% CAGR through 2031, driven by airport compliance deadlines and energy-sector hardening measures. US homeland security allocations increased 35% year-over-year to USD 180 million in fiscal 2025, with a focus on solutions interoperable with legacy command centers. Airports account for roughly 55% of commercial expenditures; EU U-space and FAA Remote ID mandates drive installations at terminals handling over 1 million passengers. Energy sites follow at approximately 25% share, with nuclear reactors and refineries demanding medium-range detection that integrates into site-security SCADA networks.
Prisons are posting the fastest sub-segment growth, with a CAGR above 30%, following the UK's requirement that all Category A facilities implement counter-UAS coverage by mid-2026. Homeland security buyers tend to opt for portable systems for border surveillance and VIP events. In contrast, commercial buyers prefer fixed or hybrid architectures, supported by service contracts that bundle maintenance, analytics, and insurance indemnities.
By Operating Range: Short-Range Gains in Urban Zones
Medium-range systems (1 to 5 km) captured 48.29% of the 2025 revenue, as they strike a balance between cost and coverage for most industrial campuses. Short-range platforms, typically under 1 km, are forecast to grow at a 26.34% CAGR as stadiums, corporate campuses, and prisons prioritize compact form factors and reduced RF emissions. CERBAIR’s Hydra, installed at French correctional facilities, employs passive RF direction-finding within 300 m to avoid interference with adjacent cellular towers. Regulatory ceilings on radar output near airports tend to push urban deployments toward passive or EO detection, naturally limiting their effective range.
Long-range assets (over 5 km) remain relevant at major airfields. Saab’s Giraffe 1X tracks small drones at a range of 10 km, but for a price of USD 3 million per unit, it confines sales to high-traffic or defense-adjacent sites. AI-assisted sensor fusion erodes rigid range categories: pairing short-range acoustic arrays with medium-range RF detectors yields overlapping coverage that improves classification accuracy without expanding capital budgets. This modularity supports the anti-drone market goal of scalable, site-specific deployments.
Geography Analysis
North America commanded 40.55% of the global revenue in 2025, driven by US DHS contracts and FAA enforcement of Remote ID. The region is forecasted to post a 25.8% CAGR through 2031, slightly trailing the global average as early adopters transition from new installations to software upgrades. US nuclear plants must install perimeter detection systems by 2027 under NRC guidance, while GAO-validated airport pilots reinforce multi-sensor architectures that reduce false positives in dense RF environments. Canada moves more slowly, yet Transport Canada’s 2025 draft mandates extend counter-UAS coverage to Vancouver, Toronto, and Montreal airports. Mexico remains nascent, but cartel drone incidents triggered pilot deployments at Guadalajara and Tijuana in late 2024.
The Asia-Pacific region is expected to post the fastest growth at a 27.11% CAGR from 2026 to 2031, as India’s Digital Sky platform enforces drone registration, China scales up smart-city surveillance, and Japan liberalizes kinetic interceptors. India removed prior-approval bottlenecks for commercial counter-UAS installs in 2024, accelerating project timelines. China’s state-owned airport operators have disclosed that more than 50 major hubs now operate RF-EO fusion systems, primarily sourced from domestic vendors, including CETC. Japan awarded Mitsubishi Electric a contract in 2024 for Narita Airport, integrating radar, EO, and net interceptors. South Korea’s nationwide 5G rollout complicates RF detection; yet, Incheon Airport’s AI retraining reduced false alarms to below 10% in 2025 trials.
Europe represented roughly 28% of 2025 revenue and is expected to grow at a 26.5% CAGR through 2031, primarily due to U-space compliance and high-profile incidents, such as Copenhagen’s 2025 shutdown. The UK leads adoption: airports exceeding 5 million passengers must sustain 24/7 coverage, and Category A prisons must install systems by mid-2026. Germany created an RF-jamming carve-out for refineries in 2025, potentially easing broader EU restrictions. France validated C-UAS-as-a-Service during the 2024 Paris Olympics, awarding contracts to Thales and DroneShield that showcase rapid redeployment capabilities. The Middle East and Africa are expected to expand at a 26.8% CAGR as Saudi Arabia’s NEOM and the UAE integrate detection layers into smart-city blueprints, backed by 2024 GACA rules mandating systems at all commercial airports. South America remains the smallest but shows momentum after Brazil’s 2025 ANAC guidelines triggered a procurement wave led by São Paulo’s Guarulhos Airport.

Competitive Landscape
Incumbents, such as Northrop Grumman Corporation, benefit from their extensive radar portfolios and established defense contracts. At the same time, emerging players capitalize on commercial opportunities by offering software-defined stacks and subscription models. DroneShield’s USD 54 million Ukraine contract in December 2024 validated portable, OTA-update architectures for conflict-zone redeployment. Anduril’s Roadrunner interceptor slashes per-engagement costs and demonstrated 95% success in Army trials, setting a new price-performance benchmark. D-Fend Solutions differentiates itself through cyber-takeover, sidestepping RF-jamming prohibitions to secure partnerships with Bosch and Leonardo in 2024.
Strategic moves concentrate on ecosystem bundling. Dedrone’s 2024 alliance with Axon merges detection, body-camera footage, and incident management, increasing switching costs for law enforcement agencies. Verizon embeds Dedrone sensors into its private LTE offerings, allowing enterprise customers to book detection services as a telecom line item, an innovation that bypasses capital-expenditure reviews. Rheinmetall’s Skyranger 30 integrates radar, optics, and a 30 mm cannon, inching toward full-spectrum air defense for border security, where kinetic action faces fewer legal constraints. Patent filings underscore the pivot to edge AI: Anduril, DroneShield, and Dedrone collectively lodged 47 US applications in 2024 aimed at low-power inference on portable units: urban false-alarm mitigation, insurance indemnity, and interoperability standards present white-space openings for next-wave entrants.
Anti-Drone Industry Leaders
Dedrone Holdings, Inc. (Axon Enterprise, Inc.)
CERBAIR
D-Fend Solutions AD Ltd.
DroneShield Group Pty Ltd
Rohde & Schwarz GmbH & Co. KG
- *Disclaimer: Major Players sorted in no particular order

Recent Industry Developments
- October 2025: Denmark started deploying Terma’s integrated counter-UAS solution at key strategic sites to address the rising unidentified drone activity and enhance the multi-domain protection of military and critical infrastructure.
- June 2025: Cambridge Pixel and OpenWorks Engineering partnered to deliver integrated counter-drone solutions to European police forces, combining radar processing software with AI-enabled optical tracking to provide rapid detection, tracking, and situational awareness against evolving UAS threats.


Research Methodology Framework and Report Scope
Market Definitions and Key Coverage
Our study defines the anti-drone market as the aggregated annual revenue generated from dedicated systems that detect, track, identify, and neutralize unauthorized small unmanned aerial vehicles across military, homeland security, critical infrastructure, and commercial venues. Solutions covered include multi-sensor detection suites (radar, RF, EO/IR, acoustic) as well as mitigation tools such as RF jammers, directed-energy weapons, kinetic interceptors, and integrated command and control software.
Scope exclusion: stand-alone drone detection apps for personal smartphones and generic air traffic surveillance radars are excluded because they fall outside professional counter-UAS procurement channels.
Segmentation Overview
- By Technology
- Detection Systems
- Neutralization/Countermeasure Systems
- By Platform Type
- Fixed
- Portable
- By End-Use Vertical
- Commercial
- Homeland Security and Law Enforcement
- By Operating Range
- Short-Range (Less than 1 km)
- Medium-Range (1 to 5 km)
- Long-Range (Greater than 5 km)
- Geography
- North America
- United States
- Canada
- Mexico
- Europe
- United Kingdom
- France
- Germany
- Rest of Europe
- Asia-Pacific
- China
- India
- Japan
- South Korea
- Rest of Asia-Pacific
- South America
- Brazil
- Rest of South America
- Middle East and Africa
- Middle East
- Saudi Arabia
- United Arab Emirates
- Rest of Middle East
- Africa
- South Africa
- Rest of Africa
- Middle East
- North America
Detailed Research Methodology and Data Validation
Primary Research
Mordor analysts interviewed procurement officers from defense ministries in North America, Europe, and Asia-Pacific, airport security directors, and two technology integrators specializing in RF defeat systems.
These conversations verified operating range preferences, average selling prices, and refresh cycles, filling gaps left by desk research and grounding scenario assumptions.
Desk Research
We began with publicly available defense budgets, procurement notices, aviation incident logs, and import-export records from bodies such as the US DoD, NATO's Support and Procurement Agency, Eurocontrol, and the UN Comtrade database, which help size demand pools. Open-access academic papers on RF spoofing countermeasures and patents filed through WIPO clarified technology readiness timelines. Annual reports, 10-Ks, and investor decks from leading prime contractors supplemented unit price discovery and recent contract values.
Subscription sources from Mordor's toolset, including D&B Hoovers for company financials and Dow Jones Factiva for deal news, added transaction-level validation. The sources listed are illustrative; many additional publications and datasets informed intermediate checks and contextual understanding.
Market-Sizing and Forecasting
A top-down reconstruction converts defense and civil security spending lines into an addressable counter-UAS pool, followed by selective supplier roll-ups (sampled ASP × units) to sanity check totals. Key variables fed into the model include:
• documented drone incursion incidents around sensitive sites,
• national defense modernization outlays earmarked for electronic warfare,
• average radar module cost curves, and
• regional regulations governing jamming equipment.
Forecasts rely on multivariate regression that links incident growth and spending capacity to anti-drone uptake, with ARIMA smoothing applied where data are volatile. Where bottom-up inputs are sparse, interpolation is guided by peer contract benchmarks and validated through follow-up calls.
Data Validation and Update Cycle
Outputs pass an anomaly screen against independent trade statistics, then two-step analyst peer review.
Reports are refreshed every twelve months, and extraordinary events such as large-scale border skirmishes or new counter-UAS export bans trigger mid-cycle updates before final delivery.
Why Our Anti-Drone Market Baseline Commands Reliability
Published figures often diverge because each firm selects different system families, price constructs, and refresh cadences.
Key gap drivers include the inclusion of passive surveillance hardware without neutralization capability, varying assumptions on average selling prices for directed-energy modules, and whether one reports fiscal or calendar year currency conversion. Mordor's model locks scope to deployable counter-UAS solutions, applies blended ASPs derived from signed contracts, and is updated annually, which curbs projection drift.
Benchmark comparison
| Market Size | Anonymized source | Primary gap driver |
|---|---|---|
| USD 3.03 billion (2025) | Mordor Intelligence | - |
| USD 4.48 billion (2025) | Global Consultancy A | Counts wide-area surveillance radars and inflates totals using vendor shipment revenue multipliers |
| USD 2.45 billion (2024) | Industry Association B | Merges anti-drone and generic drone detection software revenue; uses single-region ASPs across all geographies |
The comparison shows that estimates swing when scopes broaden or price escalators lack validation. By triangulating transparent variables and maintaining a disciplined update rhythm, Mordor Intelligence delivers a balanced baseline that decision-makers can trace, replicate, and confidently apply.


Key Questions Answered in the Report
How large is global spending on anti-drone solutions today?
Anti-drone outlays reach USD 2.47 billion in 2026 and are projected to hit USD 8.42 billion by 2031 as demand grows across airports, energy sites, and event venues.
What is the expected growth rate for counter-drone demand through 2031?
Aggregate spending is forecasted to advance at a 27.83% CAGR, outperforming most other security technologies.
Which deployment platform is gaining momentum with event organizers and rapid-response teams?
Portable, trailer- or backpack-based systems are expanding at a 28.59% CAGR because they eliminate large capital outlays and support C-UAS-as-a-Service contracts.
Why are airports investing heavily in detection and mitigation upgrades?
FAA Remote ID enforcement and EU U-space rules shift liability for incursions onto airport operators, prompting mandatory 24/7 counter-UAS coverage.
How are insurance firms influencing adoption of drone-mitigation technology?
Underwriters now exclude unmanned-aircraft losses from many property policies or offer premium discounts only when sites prove autonomous neutralization capability.
Which geographic region will post the fastest rise in anti-drone spending?
Asia-Pacific is set to grow at roughly 27.11% CAGR, driven by India’s Digital Sky program, China’s smart-city build-outs, and Japan’s permissive kinetic-intercept rules.
What legal barrier most often delays commercial neutralization deployments?
Ambiguous rules around RF jamming and kinetic takedown expose operators to regulatory fines and tort liability, slowing approval outside government facilities.
Page last updated on:


