
Anti-Aging Products Market Size and Share
Market Overview
| Study Period | 2021 - 2031 |
|---|---|
| Market Size (2026) | USD 67.29 Billion |
| Market Size (2031) | USD 92.35 Billion |
| Growth Rate (2026 - 2031) | 6.56 % |
| Fastest Growing Market | Asia Pacific |
| Largest Market | Asia Pacific |
| Market Concentration | Medium |
Major Players
*Disclaimer: Major Players sorted in no particular order Image © Mordor Intelligence. Reuse requires attribution under CC BY 4.0. |
|
Anti-Aging Products Market Analysis by Mordor Intelligence
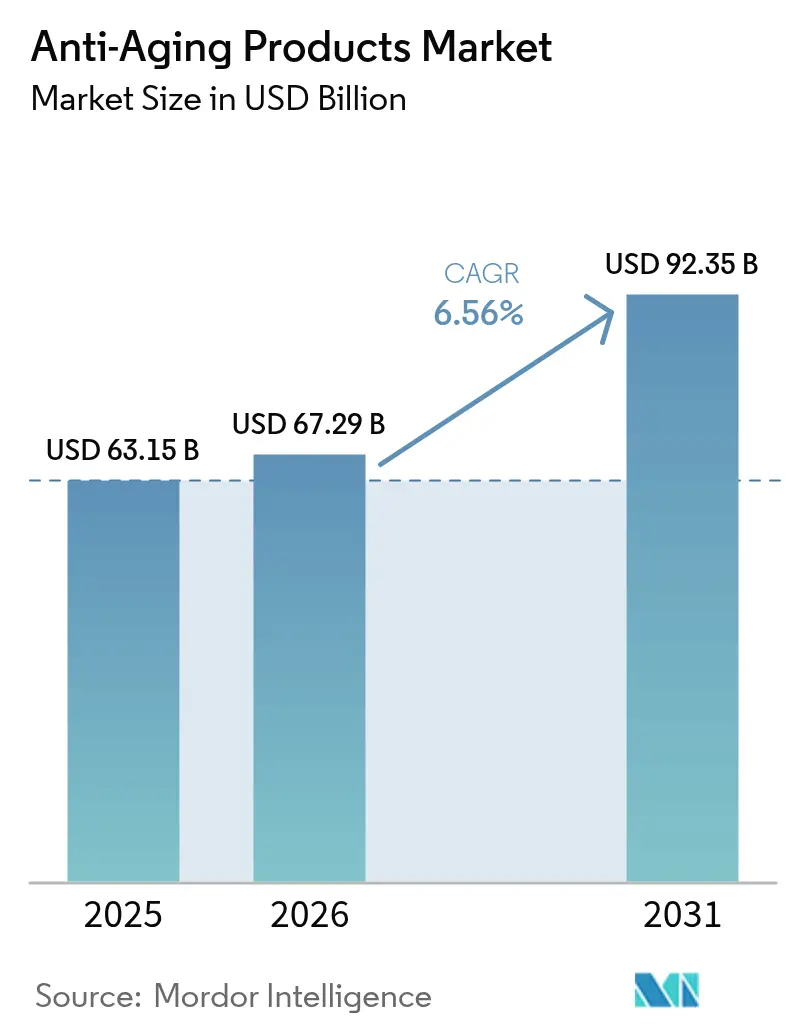
The anti-aging products market size is expected to grow from USD 63.15 billion in 2025 to USD 67.29 billion in 2026 and is forecast to reach USD 92.35 billion by 2031 at 6.56% CAGR over 2026-2031. This growth trajectory reflects the convergence of demographic shifts, technological breakthroughs, and evolving consumer behaviors that are fundamentally reshaping how beauty brands approach skin aging solutions. The market's expansion is anchored by scientific innovations in peptide formulations and biotechnology-derived ingredients, with Shiseido's recent discovery of the CCN2 "definitive beauty gene" demonstrating how molecular-level research is translating into commercially viable anti-aging strategies. Regional growth is led by Asia-Pacific, where sophisticated consumers and supportive policy frameworks accelerate ingredient experimentation. Meanwhile, online channels capitalize on algorithmic personalization to simplify complex anti-aging science for time-constrained shoppers, driving new customer acquisition at lower marginal costs. Competitive intensity remains moderate; multinationals leverage scale and regulatory depth, yet biotechnology start-ups capture high-margin niches with proprietary actives that answer precise skin-aging pathways.
Key Report Takeaways
- By product type, facial creams and lotions held 48.21% of facial anti-aging skincare market share in 2025, while serums and concentrates are primed for a 7.52% CAGR through 2031.
- By price range, mass offerings commanded 70.82% share of the facial anti-aging skincare market size in 2025; premium lines are forecast to expand at 7.22% CAGR through 2031.
- By end-user, women represented 79.05% of the 2025 revenue base, but men’s products are set to grow fastest at 6.74% CAGR to 2031.
- By category, conventional products dominated 76.88% of 2025 value, whereas organic alternatives are poised for an 8.21% CAGR during the outlook period.
- By distribution channel, health and beauty stores led with 46.10% of 2025 sales, yet online retail is advancing at an 7.71% CAGR through 2031.
- By geography, Asia-Pacific led with 41.10% of 2025 sales, yet Asia-Pacific is advancing at an 7.08% CAGR through 2031.
Note: Market size and forecast figures in this report are generated using Mordor Intelligence’s proprietary estimation framework, updated with the latest available data and insights as of 2026.
Market Trends and Insights
Drivers Impact Analysis of Anti-Aging Products Market*
| Driver | (~) % Impact on CAGR Forecast | Geographic Relevance | Impact Timeline |
|---|---|---|---|
| Growing awareness about skin health | +1.2% | Global, with stronger adoption in Asia-Pacific and North America | Medium term (2-4 years) |
| Scientific and technological advancements | +1.8% | Global, led by innovation hubs in Japan, South Korea, and European Union | Long term (≥ 4 years) |
| Influence of social media and beauty influencers | +0.9% | Global, particularly strong in Gen Z and Millennial demographics | Short term (≤ 2 years) |
| Transparency and clean beauty movement | +1.1% | North America and European Union leading, expanding to Asia-Pacific | Medium term (2-4 years) |
| Aging demographic seeking active aging | +1.3% | North America and Europe primary, emerging in developed Asia-Pacific | Long term (≥ 4 years) |
| Expansion of modern retail and e-commerce | +0.8% | Global, with accelerated adoption in emerging markets | Short term (≤ 2 years) |
| Source: Mordor Intelligence | |||
Growing Awareness About Skin Health
Consumer understanding of skin biology has evolved beyond surface-level concerns to encompass cellular mechanisms, with research demonstrating that majority of women aged 55+ want brands to address aging openly rather than through euphemistic messaging. This shift drives demand for formulations targeting specific pathways like inflammaging, where chronic low-grade inflammation accelerates visible aging signs. Biotechnology companies are responding with ingredients like naringenin, which L'Oréal-backed Deinde utilizes to combat inflammatory processes that begin affecting skin repair mechanisms after age 25. The awareness trend extends to understanding environmental factors, with consumers increasingly recognizing the "exposome" concept that encompasses all external influences on skin aging. This knowledge base enables more targeted product selection and creates opportunities for brands that can effectively communicate complex scientific concepts through accessible channels.
Scientific and Technological Advancements
Breakthrough discoveries in cellular senescence research are revolutionizing anti-aging approaches, with senotherapeutic peptides demonstrating superior efficacy compared to traditional retinol treatments in clinical studies. Artificial intelligence integration is accelerating ingredient discovery and formulation optimization, as demonstrated by Shiseido's VOYAGER platform that analyzes over 500,000 data points to enhance product development efficiency. Advanced delivery systems, including nanoliposomes that co-deliver multiple bioactive peptides, are achieving enhanced penetration and sustained release profiles that significantly improve clinical outcomes. Biotechnology-derived ingredients are gaining regulatory acceptance, with Estée Lauder's Belgium BioTech Hub producing bio-based raw materials that meet both efficacy and sustainability requirements. These technological advances are creating competitive moats for companies that can successfully translate laboratory innovations into consumer-accessible products.
Influence of Social Media and Beauty Influencers
Social media platforms have fundamentally altered consumer discovery and evaluation processes, with TikTok marketing and beauty influencers significantly enhancing purchasing decisions through brand awareness mechanisms. The Federal Trade Commission's updated influencer marketing guidelines require enhanced transparency in endorsement disclosures, creating compliance challenges that favor brands with sophisticated legal frameworks. Consumer research indicates that perceived informativeness, entertainment value, and credibility of beauty content significantly influence purchasing behavior, particularly among Generation Y female consumers who prioritize detailed product education. Social media's impact extends beyond marketing to product development, with brands increasingly incorporating user-generated feedback into formulation decisions. The platform ecosystem enables rapid trend dissemination, creating both opportunities for viral product success and risks associated with misinformation about ingredient safety and efficacy.
Transparency and Clean Beauty Movement
Consumer demand for ingredient transparency has intensified following the COVID-19 pandemic, with brands increasingly required to provide comprehensive safety data and sourcing information to maintain market credibility. The movement extends beyond ingredient lists to encompass manufacturing processes, with sustainable sourcing and green chemistry principles becoming competitive differentiators rather than optional enhancements. Regulatory bodies are responding with enhanced oversight, including the EU's prohibition of retinol derivatives from market placement starting November 2025, forcing brands to develop alternative active ingredients. Clean beauty formulations are achieving clinical efficacy comparable to traditional synthetic alternatives, with plant-derived peptides and fermented ingredients demonstrating measurable anti-aging benefits. The transparency imperative creates operational complexities for multinational brands that must navigate varying disclosure requirements across different regulatory jurisdictions while maintaining consistent brand messaging.
Restraints Impact Analysis of Anti-Aging Products Market*
| Restraint | (~) % Impact on CAGR Forecast | Geographic Relevance | Impact Timeline |
|---|---|---|---|
| Prevalence of counterfeit and unsafe products | -0.8% | Global, with higher concentration in emerging markets | Short term (≤ 2 years) |
| Complexity in ingredient compliance and testing | -1.1% | Global, particularly affecting multi-regional brands | Medium term (2-4 years) |
| Ethical concerns about anti-aging claims | -0.6% | Primarily developed markets with mature regulatory frameworks | Medium term (2-4 years) |
| Social and psychological barriers | -0.4% | Cultural variations across regions, stronger in traditional societies | Long term (≥ 4 years) |
| Source: Mordor Intelligence | |||
Prevalence of Counterfeit and Unsafe Products
Counterfeit skincare products pose significant consumer safety risks and market integrity challenges, as demonstrated by recent FDA enforcement actions against aestheticians importing counterfeit Botox from China that resulted in severe botulism cases [1]Source: U.S Food & Drug Administration, "Hell’s Kitchen Aesthetician Arrested For Unlawfully Injecting Counterfeit Botox", fda.gov. Research from Iraq reveals that counterfeit cosmetic products cause adverse effects including acne, erythema, and long-term skin atrophy, particularly affecting young female consumers seeking skin lightening benefits. The proliferation of unsafe products undermines consumer confidence in legitimate anti-aging formulations and creates regulatory compliance burdens for authentic manufacturers. Cosmetovigilance systems are being implemented globally to monitor adverse events and enhance consumer protection, though enforcement capabilities vary significantly across different markets. The counterfeit challenge is exacerbated by e-commerce platforms where product authenticity verification remains technically complex and economically challenging for both platforms and consumers.
Complexity in Ingredient Compliance and Testing
Regulatory harmonization challenges create significant operational complexities for multinational skincare brands, with divergent safety assessment requirements across major markets increasing development costs and time-to-market delays, China's implementation of full safety assessment dossiers starting May 2025, combined with new testing methodologies, requires substantial regulatory affairs investments that favor larger corporations with dedicated compliance teams. The FDA's Modernization of Cosmetics Regulation Act introduces new reporting requirements and potential Good Manufacturing Practice standards that will reshape industry compliance frameworks. Ingredient testing complexity is compounded by evolving scientific understanding of skin penetration mechanisms and long-term safety profiles, requiring continuous investment in toxicological research. These regulatory burdens create market entry barriers for smaller innovative companies while potentially stifling ingredient innovation due to risk-averse formulation strategies.
*Our forecasts treat driver/restraint impacts as directional, not additive. The impact forecasts reflect baseline growth, mix effects, and variable interactions.
Anti-Aging Products Market Segment Analysis
By Product Type:
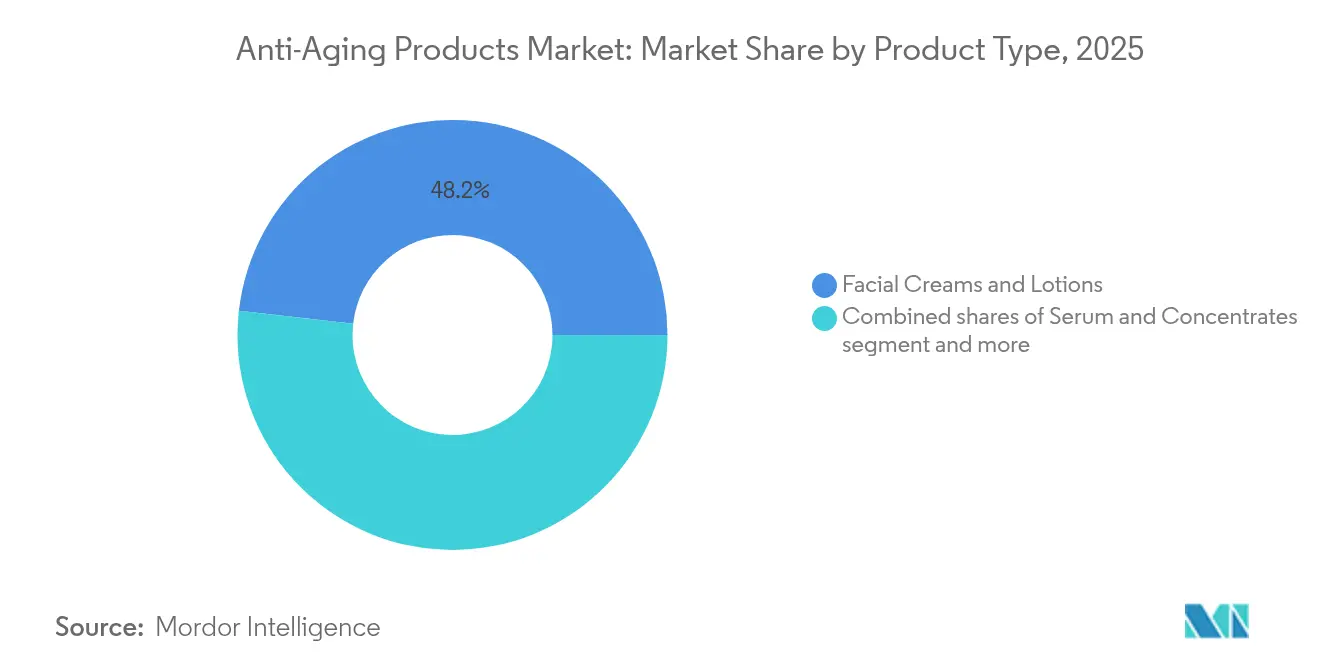
Serums Drive Innovation Despite Cream DominanceFacial creams and lotions command 48.21% market share in 2025, reflecting consumer familiarity with traditional formulation formats and their suitability for comprehensive skincare routines that address multiple aging concerns simultaneously. However, serums and concentrates represent the fastest-growing segment with 7.52% CAGR through 2031, driven by consumer preference for targeted active delivery and higher ingredient concentrations that enable visible results in shorter timeframes. Under-eye creams maintain steady demand as consumers increasingly recognize the delicate eye area's unique aging patterns and specialized treatment requirements. The "others" category, encompassing facial oils and sheet masks, benefits from Korean beauty influence and consumer experimentation with diverse application methods.
Advanced peptide formulations are revolutionizing serum efficacy, with clinical evidence demonstrating that multi-peptide combinations can synergistically activate skin cell regenerative capacity beyond individual ingredient performance. Estée Lauder's recent launch of the GF 15% Solution anti-aging serum exemplifies how brands are leveraging concentrated active formulations to differentiate premium offerings in competitive markets. The segment's growth trajectory reflects technological advances in ingredient stability and delivery systems that enable higher active concentrations without compromising skin tolerance or product shelf life.



By Price Range:
Premium Growth Challenges Mass DominanceMass-market products maintain 70.82% market share in 2025, demonstrating consumer price sensitivity and the effectiveness of accessible formulations in delivering basic anti-aging benefits through established retail channels. The premium segment's 7.22% CAGR through 2031 reflects growing consumer willingness to invest in scientifically backed formulations that offer superior efficacy or unique ingredient profiles. This growth pattern indicates market polarization where consumers either seek value-oriented solutions or invest significantly in premium products, with limited middle-market expansion opportunities.
The demand for premium anti-aging products is rising steadily as consumers increasingly prioritize skincare and overall wellness. Affluent and health-conscious buyers are willing to invest in high-quality formulations that promise visible results and use advanced ingredients. Growing awareness of preventive skincare, coupled with the influence of social media and beauty trends, further fuels this demand. Additionally, the desire for personalized and luxury skincare experiences is driving the expansion of the premium anti-aging segment globally. Premium segment success increasingly depends on proprietary ingredient technologies, clinical validation, and sophisticated consumer education that demonstrates measurable benefits over mass-market alternatives.
By End-User:
Men's Market Emergence Reshapes StrategiesWomen represent 79.05% of market share in 2025, reflecting traditional gender associations with skincare routines and anti-aging concerns, though this dominance is gradually shifting as male consumer behavior evolves. Men's skincare achieves the fastest growth rate at 6.74% CAGR through 2031, driven by changing social attitudes toward male grooming and increased awareness of skin health benefits beyond aesthetic considerations. This demographic shift requires brands to develop gender-specific formulations and marketing approaches that address distinct consumer preferences and usage patterns.
The men's segment growth reflects broader societal changes in masculinity concepts and self-care acceptance, with younger male consumers particularly receptive to anti-aging products that emphasize health and performance benefits rather than traditional beauty messaging. Product development for male consumers increasingly focuses on multifunctional formulations that combine anti-aging benefits with sun protection, hydration, and skin barrier support in simplified routines. Regulatory compliance factors remain consistent across gender segments, though marketing claims and clinical testing may require gender-specific validation to support efficacy assertions in diverse consumer populations.
By Category:
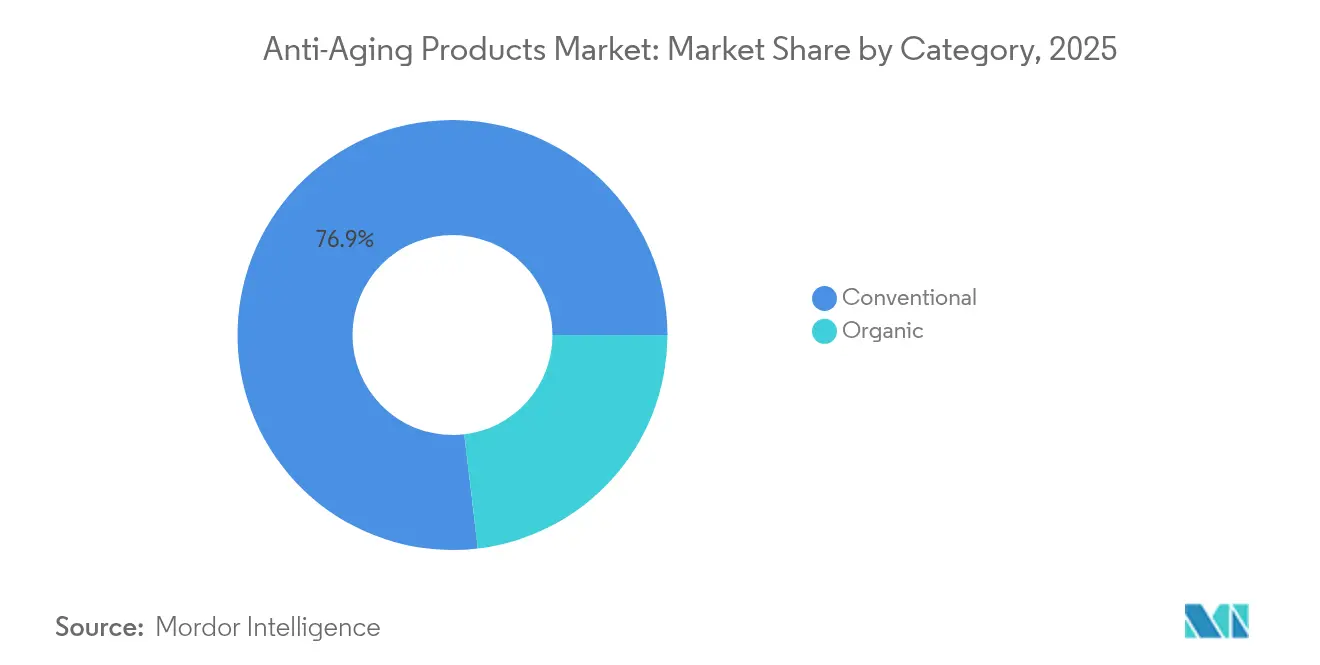
Organic Surge Challenges Conventional DominanceConventional products maintain 76.88% market share in 2025, supported by established supply chains, proven efficacy profiles, and cost advantages that enable broad market accessibility across diverse consumer segments. The organic segment's 8.21% CAGR through 2031 represents the fastest category growth, reflecting consumer preference for natural ingredients and sustainable production methods that align with broader environmental consciousness trends. This growth trajectory indicates significant market share transfer potential as organic formulations achieve efficacy parity with conventional alternatives.
Consumer demand for eco-friendly products has intensified post-COVID-19, with sustainable ingredients and green chemistry principles becoming essential competitive differentiators rather than optional enhancements. Organic segment expansion faces regulatory challenges as natural ingredient sourcing requires enhanced traceability and quality control systems that increase operational complexity. The category's success depends on brands' ability to demonstrate that organic formulations deliver comparable anti-aging benefits while meeting consumer expectations for environmental responsibility and ingredient transparency.
By Distribution Channel:
Digital Transformation AcceleratesHealth and beauty stores command 46.10% market share in 2025, benefiting from consumer preference for in-person product consultation and the tactile evaluation experience that remains important for skincare purchasing decisions. Online retail stores achieve the fastest growth at 7.71% CAGR through 2031, driven by enhanced digital education capabilities, personalized recommendation algorithms, and convenience factors that appeal to time-constrained consumers. Supermarkets and hypermarkets provide broad accessibility but face competitive pressure from specialized channels that offer superior product knowledge and customer service.
Post-COVID purchasing pattern changes have permanently altered beauty market dynamics, with non-face-to-face environments expanding consumer comfort with digital skincare purchases. The e-commerce channel's success reflects technological advances in virtual skin analysis, AI-powered product matching, and digital education content that enables informed purchasing decisions without physical product interaction. Traditional retail channels are adapting through omnichannel strategies that integrate digital tools with in-store experiences, though pure-play online retailers maintain advantages in data collection and personalization capabilities.
Geography Analysis
APAC Anti-Aging Products Market
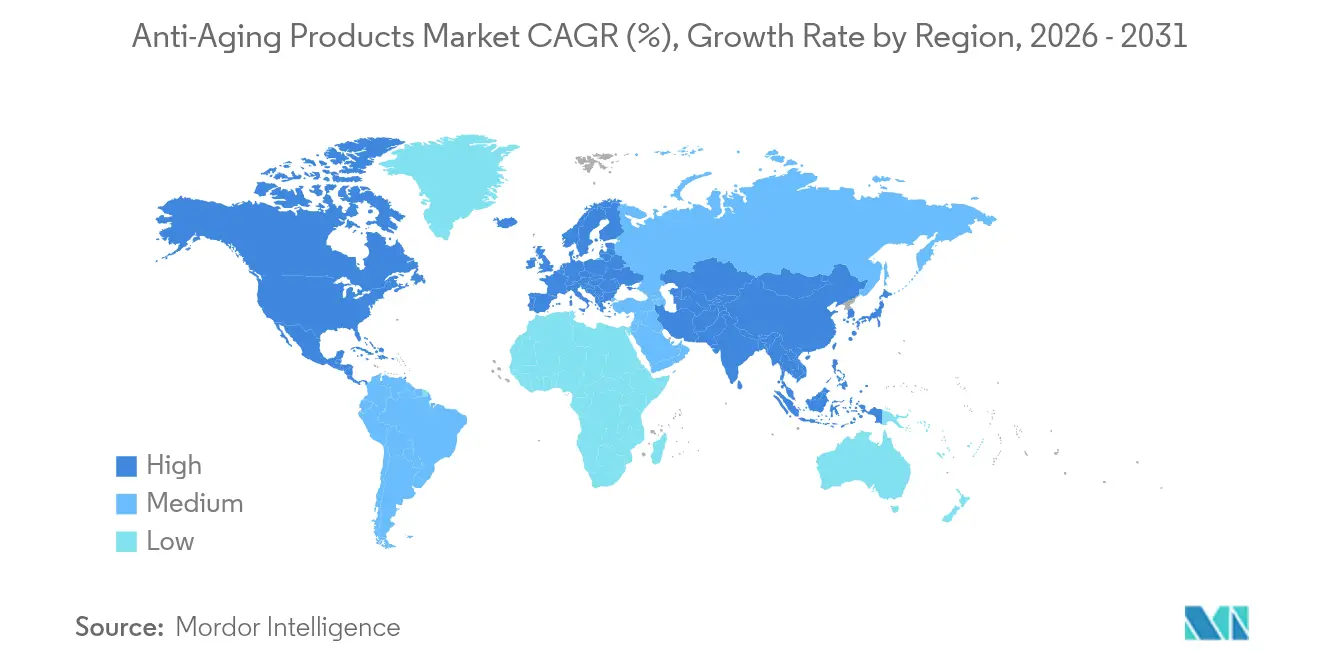
Asia-Pacific dominates with 41.10% market share in 2025 and leads growth at 7.08% CAGR through 2031, driven by sophisticated consumer preferences, regulatory frameworks that encourage ingredient innovation, and robust domestic manufacturing capabilities. China's cosmetics export value increased 8.7% year-on-year while imports declined, indicating local brand strength and consumer preference shifts toward domestic alternatives. India's luxury beauty market is projected to grow, with skincare expected as the fastest-growing category. Japanese and South Korean markets drive technological innovation through advanced research capabilities and consumer willingness to adopt novel ingredients and application methods. The region's regulatory harmonization efforts, particularly China's implementation of comprehensive safety assessment requirements, are establishing new global standards for product development and market entry strategies.
The Americas and EMEA Anti-Aging Products Market
North America represents a mature market characterized by high consumer awareness, stringent regulatory oversight, and premium product adoption rates that support innovation investments. The region's aging demographic creates sustained demand for anti-aging solutions, with baby boomers controlling USD 2.6 trillion in buying power and demonstrating strong preference for products that support healthy aging . The U.S. population over 65 increased 38.6% from 2010 to 2020, creating a substantial consumer base for specialized anti-aging formulations. Regulatory complexity is increasing with state-level initiatives like Washington's Toxic-Free Cosmetics Act and California's PFAS restrictions, requiring enhanced compliance capabilities that favor established multinational corporations over smaller market entrants. Europe maintains strong market presence through sophisticated regulatory frameworks, consumer preference for scientifically validated products, and leadership in clean beauty movement adoption. The EU's ban on 1,300 skincare ingredients and upcoming restrictions on retinol derivatives are reshaping product formulation strategies and creating opportunities for alternative active ingredients. Extended Producer Responsibility laws are expanding across European markets, requiring brands to manage packaging waste and incorporate sustainability considerations into product development processes. South America and Middle East and Africa represent emerging opportunities with growing middle-class populations and increasing beauty product accessibility, though market development requires localized strategies that address distinct consumer preferences and regulatory environments.

Regulatory Landscape
The regulatory environment for anti-aging products is tightening around ingredient restrictions, labeling, and substantiation. In the EU, the Cosmetics Regulation (EC) No 1223/2009 sets a high bar for formulation and compliance. In January 2026, Commission Regulation (EU) 2026/78 updated annex restrictions for additional CMR substances, with effect from May 1, 2026, which increases reformulation pressure for products that rely on restricted preservatives, colorants, or UV filters. In April 2026, the EU also published Commission Regulation (EU) 2026/909, introducing further restrictions (including benzyl salicylate, triphenyl phosphate, and citral) with compliance timelines starting January 1, 2027, and new mandatory warnings for formaldehyde-releasing preservatives became effective in July 2026.
In the United States, the Modernization of Cosmetics Regulation Act (MoCRA) is reshaping operational compliance by requiring FDA facility registration and product listing, with facility registration renewals every two years and increased emphasis on safety records and adverse event reporting. State-level chemical restrictions continue to fragment compliance strategies on top of federal requirements, including PFAS prohibitions in certain states taking effect during 2026 (with different effective dates such as January 1 and July 1). These changes raise the cost of multi-region portfolio management and tend to favor companies with stronger regulatory affairs, quality systems, and ingredient traceability across both conventional and clean beauty anti-aging lines.
Competitive Landscape
The facial anti-aging skincare market exhibits moderate concentration with established multinational corporations maintaining competitive advantages through research capabilities, regulatory expertise, and global distribution networks, while emerging biotechnology firms capture niche opportunities through proprietary ingredient innovations. Some of the prominent players include Procter & Gamble, Beiersdorf, Unilever, Estée Lauder Inc., Johnson & Johnson, and L’Oreal S.A., among others.
Strategic patterns increasingly emphasize scientific differentiation over traditional marketing approaches, with companies investing in AI-driven product development, clinical validation, and patent portfolios that create sustainable competitive moats. Shiseido's VOYAGER platform exemplifies how artificial intelligence integration enables analysis of over 500,000 formulation data points to accelerate innovation cycles and improve product efficacy.
Opportunities exist in personalized skincare solutions, with L'Oréal's Cell BioPrint device demonstrating how portable diagnostic technology can provide customized product recommendations based on individual skin analysis. Technology adoption patterns favor companies that can integrate digital tools with traditional product development, as demonstrated by AI-enhanced physical activity optimization for skin health outcomes [3]Source: National Institute of Health, "Artificial Intelligence in Aesthetic Medicine: Applications, Challenges, and Future Directions", pmc.ncbi.nlm.nih.gov. Emerging disruptors leverage biotechnology advances and direct-to-consumer models to challenge established players, though regulatory compliance requirements and clinical validation costs create significant barriers to market entry and scale achievement.
Anti-Aging Products Industry Leaders
-
Procter & Gamble
-
Beiersdorf
-
Unilever
-
L’Oreal S.A.
-
Johnson & Johnson
- *Disclaimer: Major Players sorted in no particular order

Anti-Aging Products Market Companies Covered in this Report
- L’Oreal S.A.
- Estée Lauder Inc.
- Procter & Gamble
- Shiseido Co. Ltd.
- Beiersdorf
- Unilever
- Johnson & Johnson
- Amorepacific Corp.
- Kao Corp.
- Natura & Co.
- Clarins Group
- Coty Inc.
- Oriflame Holding AG
- Naos (Bioderma)
- Caudalie SAS
- Galderma SA
- Allergan Aesthetics (AbbVie)
- No7 Beauty Company
- Innisfree Corp.
- The Ordinary (Deciem)
- LVMH

Market Opportunities and Future Outlook
Regulation-driven reformulation and claims discipline are creating demand for suppliers and brands that can industrialize safety documentation, traceable sourcing, and standardized quality verification across regions. NSF/ANSI 527 (published March 2026 by NSF International) adds a third-party framework that brands can use to support safety and quality positioning for finished cosmetic products, which fits the move toward documentation-ready portfolios under MoCRA and stricter EU ingredient and labeling updates. At the same time, longevity positioning and clinically anchored actives are opening space for differentiated anti-aging pipelines built on bio-identical and biotech-derived ingredients, supported by large-scale ingredient players introducing new platforms for peptides and collagen-related actives.
M&A and partnerships in 2026 reflect investment in regional capability and ingredient innovation that can be leveraged for anti-aging portfolios. L'Oreal signed an agreement in June 2026 to acquire a majority stake in Innovist, strengthening access to India-focused science-led personal care brands and local execution. Ingredient and active-technology consolidation also advanced, including Solabia Group completing its acquisition of Mibelle Biochemistry in July 2026 to accelerate natural active ingredient innovation tied to healthy aging. Product and ingredient roadmaps also point to AI-enabled discovery and precision biology, with BASF introducing SkinNexus Collag3n and NeoHelix Regenerate in April 2026, and Debut partnering with Natura in May 2026 to commercialize an AI-discovered longevity ingredient complex using Amazonian botanicals, supporting anti-aging concepts that combine biotech efficacy with clean beauty narratives.
Recent Industry Developments in Anti-Aging Products Market
- July 2026: L'Oreal Paris launched new Revitalift serum innovations, including a Hyaluronic Acid & PDRN+ anti-wrinkle plumping serum and a Melasyl dark spot creamy-serum positioned around visible correction benefits. These launches expand access to advanced active stories in mass-market retail and reinforce the push to translate premium-grade actives into scalable anti-aging regimens.
- August 2025: Beiersdorf announced it was bringing epigenetic innovation to the mass market, extending advanced aging-science positioning beyond premium price tiers. This supports wider adoption of longevity and skin-biology narratives and raises the bar for scientific differentiation in mainstream anti-aging portfolios.
- January 2024: Shiseido launched a refillable Ultimune Power Infusing Serum featuring its patented Power Fermented Camellia+ ingredient. The refill-led packaging and proprietary fermentation positioning highlighted how leading brands are pairing sustainability formats with differentiated biotech ingredient stories in anti-aging skincare.


Anti-Aging Products Market Report Scope and Research Methodology
Market Definition and Coverage
For this study, the market covers revenues generated from anti-aging cosmetic products that are used to reduce visible signs of skin aging, such as wrinkles, uneven tone, and loss of firmness, across consumer retail and professional selling channels.
Scope exclusions: we exclude anti-aging treatments and procedures, along with devices and clinic-led services, because these offerings follow a different demand cycle and pricing structure than product sales.
Segments Covered in This Report
-
By Product Type
- Facial Creams and Lotions
- Serum and Concentrates
- Under Eye Cream
- Others
-
By Price Range
- Mass
- Luxury
-
By End-User
- Men
- Women
-
By Category
- Conventional
- Organic
-
By Distribution Channel
- Supermarkets/Hypermarkets
- Health and Beauty Stores
- Online Retail Stores
- Other Distribution Channels
-
By Geography
-
North America
- United States
- Canada
- Mexico
- Rest of North America
-
Europe
- Germany
- United Kingdom
- Italy
- France
- Spain
- Netherlands
- Poland
- Belgium
- Sweden
- Rest of Europe
-
Asia-Pacific
- China
- India
- Japan
- Australia
- Indonesia
- South Korea
- Thailand
- Singapore
- Rest of Asia-Pacific
-
South America
- Brazil
- Argentina
- Colombia
- Chile
- Peru
- Rest of South America
-
Middle East and Africa
- South Africa
- Saudi Arabia
- United Arab Emirates
- Nigeria
- Egypt
- Morocco
- Turkey
- Rest of Middle East and Africa
-
North America
Data Sources, Market Sizing, and Validation
Desk Research
Desk research is used to map the demand context, define the product boundary, and compile the input series that show whether the market expands or slows down across regions. We rely on public sources such as the US FDA (cosmetics guidance and ingredient oversight), the European Commission (CosIng and related cosmetics regulation notes), the US Census Bureau and Eurostat (retail and trade statistics), and UN Comtrade (import and export flows for relevant skin care product codes).
To align the model with what is happening in the beauty market, we also review annual reports and investor presentations from listed personal care companies, along with reputable press coverage and trade association updates, including cosmetics councils and dermatology associations. Where useful, we use paid subscriptions for company financials and intelligence, news and financials, and patent databases to track formulation activity and claim trends. These desk sources are not exhaustive, and we reviewed other public references for data collection, validation, and clarification checks.
Primary Interviews and Surveys
Primary work is used to pressure-test assumptions that desk research cannot fully settle, especially around pricing bands, channel mixes, and how quickly specific claims are being adopted in each region. We speak with a mix of brand and contract manufacturing teams, ingredient and packaging participants, distributors and retailers, and dermatology-adjacent experts across APAC, EMEA, and the Americas to confirm volumes, value splits, and realistic growth drivers.
Distribution of primary research fieldwork respondents
| Company type | Respondent position | Region |
|---|---|---|
| Top tier: 35% | CXOs: 14% | APAC: 52% |
| Mid tier: 46% | Functional/Unit leaders: 35% | EMEA: 30% |
| Smaller Players: 19% | Managers: 51% | Americas: 18% |
Market-Sizing & Forecasting
Our sizing starts with a top-down build that reconstructs the addressable spend on anti-aging skin care within the broader beauty and skin care value pool, then allocates it using region and channel indicators that can be checked year over year. We corroborate this using selective bottom-up approximations, such as sampled average selling price by product type multiplied by estimated unit movement, supported by supplier and channel checks, so totals can be adjusted when a mismatch is detected.
Key inputs used in the model include anti-aging-relevant skin care import and export movements, mass versus luxury pricing ladders, e-commerce share shifts in beauty retail, category mix between creams, serums, and under-eye products, and the pace of claim adoption around wrinkles, tone correction, and firming. When data gaps appear in smaller countries, proxy ratios are used from comparable markets based on income bands and channel structure, then normalized using trade and retail signals.
For forecasting, scenario analysis is applied around price progression and channel expansion, and the scenario weights are tuned using what interviewees say about promotions, premiumization, and expected demand resilience. We carry growth forward only when the underlying indicators also move in the same direction, which keeps the forecast practical and traceable.
Data Validation & Update Cycle
Model outputs are checked against independent signals, including trade movement direction, reported skin care performance, and region-level retail indicators, and then any unusual jumps are reviewed before sign-off. If a variance cannot be explained by a known driver, we revisit assumptions and recheck the relevant inputs, then re-contact select respondents when needed.
The work goes through multiple analyst review steps to keep calculation logic, units, and currency conversions consistent across countries and years. Reports are refreshed annually, and interim updates are made when material events affect pricing, distribution, or regulatory conditions. Before delivery, a fresh validation pass is completed so clients receive the latest updated view.
Mordor Intelligence's Anti Aging Products Market Size Compared With Other Published Estimates
Published market numbers for anti-aging products often differ, even when they appear to cover the same space, because the boundary can shift between product-only sales and wider anti-aging offerings. Differences also come from how pricing is handled across mass and luxury ranges, how online channels are treated, and how frequently assumptions are refreshed.
Trade-direction checks for skin care codes, retail channel share signals, and claim-based product mix validation are the evidence points that anchor Mordor Intelligence's estimate to a product-only demand pool, instead of mixing in procedure and device spend that can inflate totals. Some publishers rely on a single base-year snapshot and then carry forward an aggressive CAGR, but our model adjusts for region-by-region pricing ladders and the pace of premiumization that interviewees describe as realistic.
Benchmark comparison
| Source | Market Size | Gaps in Research Methodology |
|---|---|---|
| Mordor Intelligence | USD 67.29 B (2026) | |
| Global Consultancy A | USD 55.66 B (2025) | Uses an earlier base year and a narrower read on what qualifies as anti-aging SKUs, which can undercount premium serums and multi-claim products in modern assortments. |
| Industry Publisher B | USD 77.96 B (2025) | Expands scope into a broader anti-aging market that includes treatments, devices, and clinic-linked services, which lifts the number beyond product sales. |
The table shows that the spread is mostly explained by scope boundary and base-year choice, and then by how pricing and product qualification rules are applied. By keeping inputs anchored to observable trade, retail, and mix signals, and then confirming assumptions through interviews, the final number stays easier to reconcile and repeat when new data comes in.


Key Questions Answered in the Report
What is the projected value of the facial anti-aging skincare market by 2031?
The market is expected to reach USD 92.35 billion by 2031, growing at a 6.56% CAGR.
Which product type is set to grow fastest in facial anti-aging skincare?
Serums and concentrates will expand at 7.52% CAGR through 2031 due to high-concentration active delivery.
Why is Asia-Pacific pivotal for facial anti-aging skincare growth?
The region holds 41.10% share and leads with 7.08% CAGR, driven by innovation-friendly regulations and digitally savvy consumers.
How are regulations affecting ingredient innovation?
EU and U.S. safety acts plus China’s 2025 dossiers increase compliance costs, favoring firms with strong regulatory teams.
Page last updated on:


 Your data is secure and never sold or shared.


